See market activity more clearly in real time.
Compare plans to access deeper market visibility for market activity.
Education
June 3, 2025
SHARE
Get the Real Story Behind the Tape: Why the MBO Bundle Is a Game-Changer for Futures Traders
If you’re trading futures using standard market-by-price (MBP) data, you’re likely missing crucial details that influence price movement. MBP data shows aggregated order sizes at each price level, but it hides the identity and intent behind those orders. This is where Market-by-Order (MBO) data changes everything—and where Bookmap’s MBO Bundle provides a unique analytical advantage.
In this article, we’ll explore what MBO data is, how it compares to conventional market data, and how traders can leverage the bundle of add-ons to gain real-time insight into stop runs, iceberg orders, liquidity shifts, and order book pressure. This isn’t just about tools—it’s about understanding what’s really driving price action beneath the surface.
What Is MBO Data and Why Does It Matter?
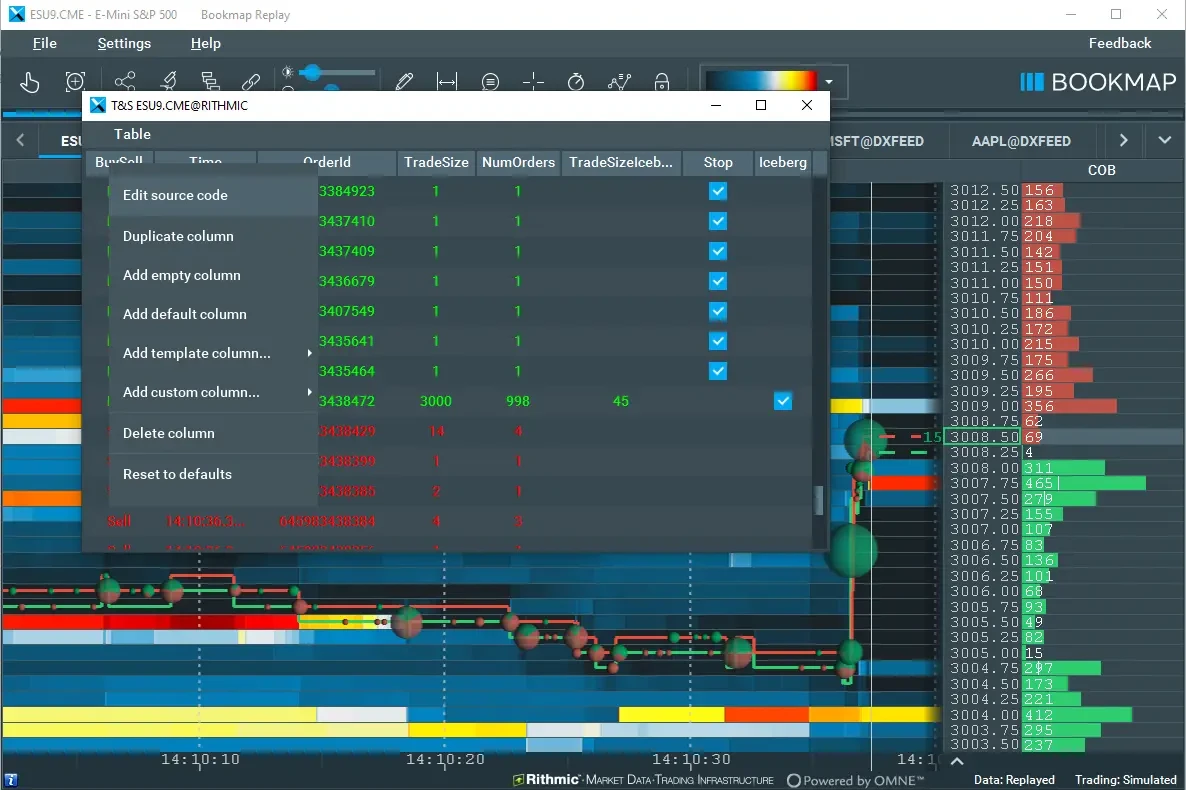
Market-by-Order (MBO) data offers unmatched transparency into market activity. It provides the ability to track every individual order in the book, including:
- Its size, price, and direction (buy/sell)
- Whether it’s passive (resting) or aggressive (marketable)
- If it was modified or canceled
- Whether it originated as a hidden iceberg or a triggered stop order
This level of detail allows traders to distinguish between passive liquidity and active execution pressure. For example, you can:
- Detect stop runs as bursts of aggressive orders clearing through multiple price levels
- Spot iceberg orders by analyzing partial fills and hidden size replenishment
- Recognize spoofing patterns when large orders appear and vanish quickly
This is not possible with Market-by-Price data, which aggregates orders at each level and conceals individual intent. MBO gives you structure beneath the tape—vital context when you’re looking to make timing-based or momentum-driven decisions.
A Closer Look at the MBO Bundle
The MBO Bundle is a curated package of indicators that help you extract, visualize, and interpret MBO data in real time within the Bookmap platform. Here’s what it includes:
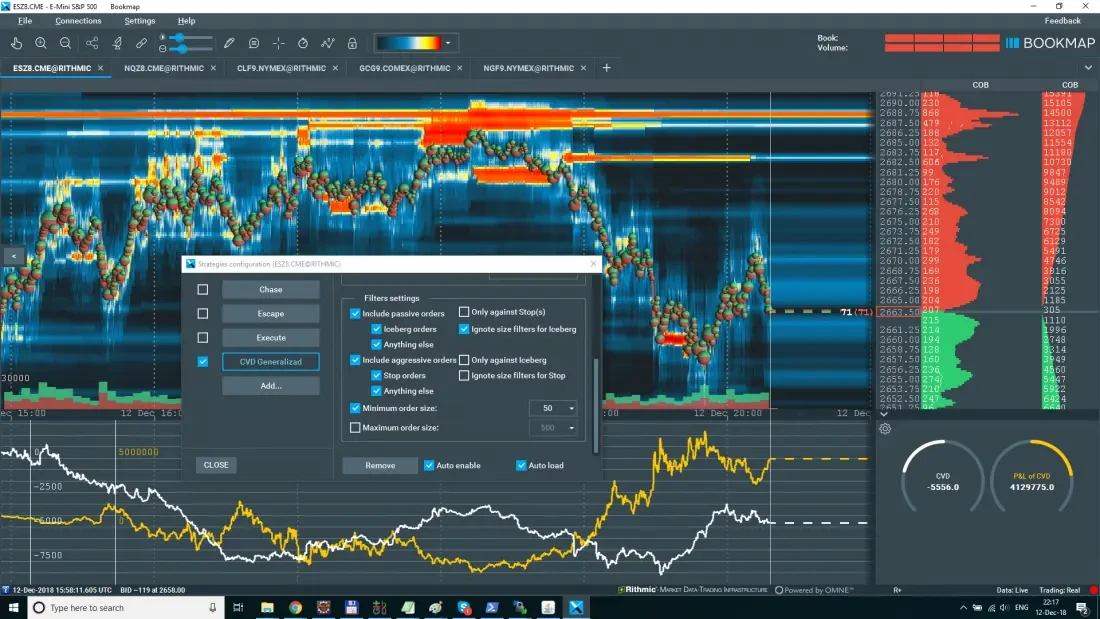
Stops & Icebergs Sub-Chart
Visualizes the execution of stop and iceberg orders on a dedicated sub-chart. This lets you spot large bursts of hidden activity and filter them by size or accumulation mode. Useful for identifying key turning points. Learn how it works.
Stops & Icebergs On-Chart
Displays the exact location and timing of iceberg and stop executions directly on the heatmap. Helps pinpoint whether the current move is retail-driven or caused by stealthy institutional action.
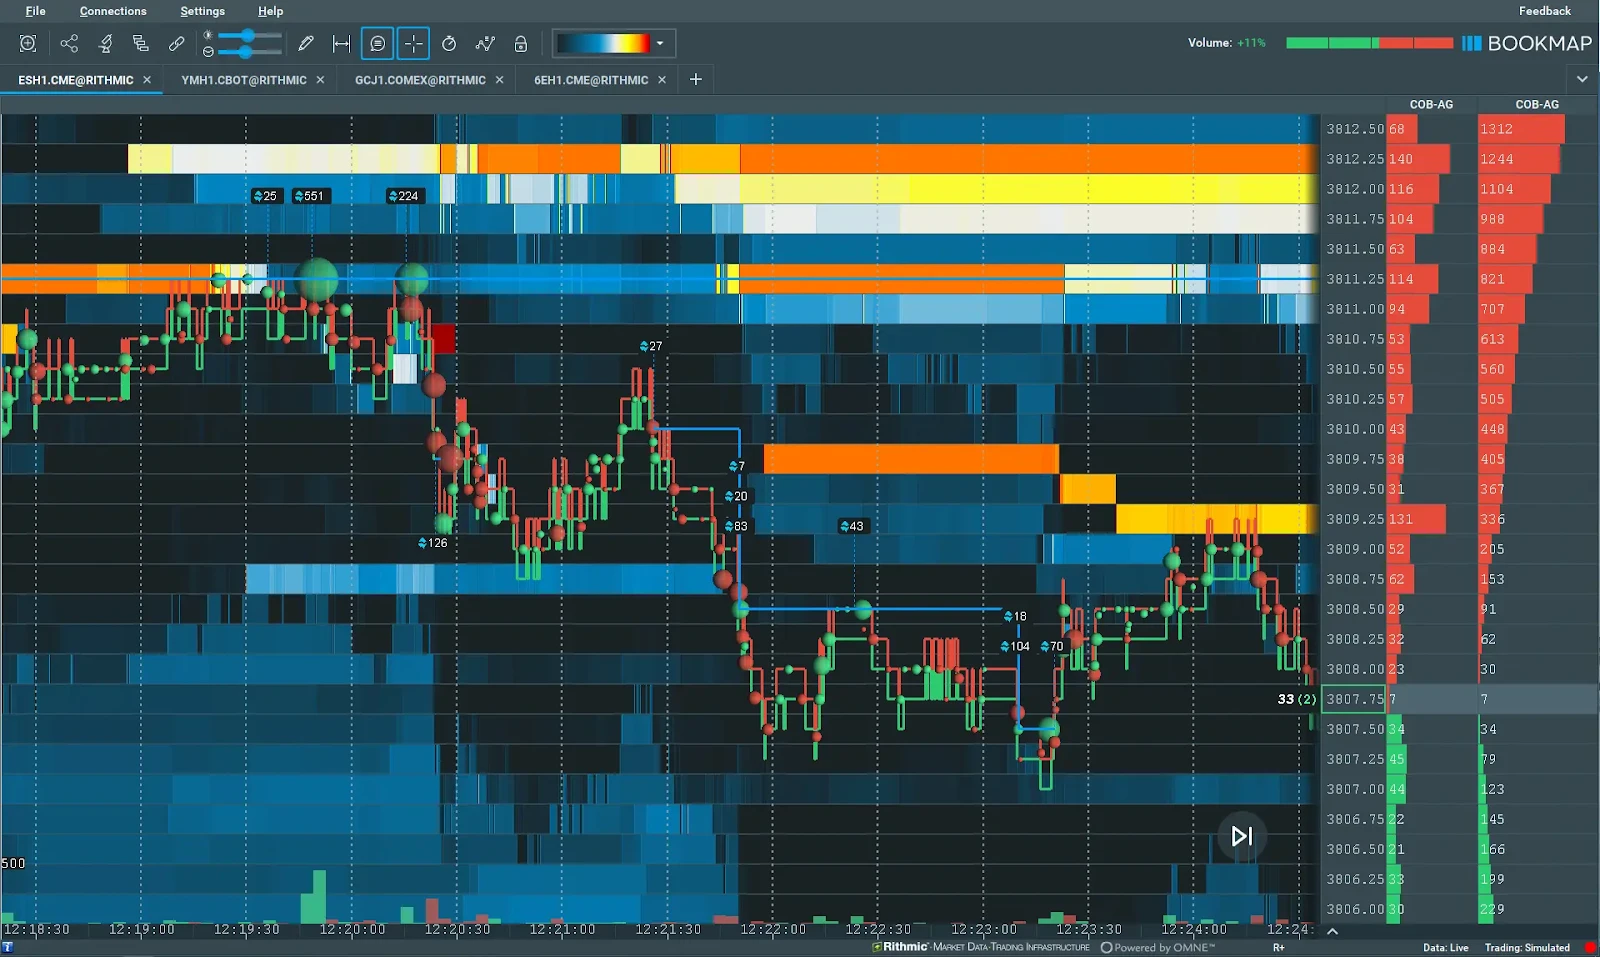
Liquidity Tracker Pro
Tracks limit order activity across the full depth of the book using an exponentially weighted model. Offers real-time filtering by order size to help isolate informed liquidity. Dive deeper into LT Pro.
Tradermap Pro
Enables you to build custom filtered heatmaps of any instrument. Clean up your view using filters for bot behavior, order duration, size thresholds, and more. Ideal for traders who want to remove noise. Explore full setup options.
Market Pulse
A widget-based tool for monitoring pressure from volume, order book shifts, absorption, and more. Each algorithm focuses on a specific event type and can be configured per instrument. Excellent for traders who monitor multiple markets. Understand Market Pulse features.
These add-ons aren’t isolated tools. They’re part of a framework. For example:
- See a stop run with SI Sub-Chart.
- Confirm whether large traders are stepping in using LT Pro.
- Filter out bot activity via Tradermap Pro.
- Get alerted to additional pressure via Market Pulse.
This kind of multi-layered confirmation is what separates random trades from structured, confident execution.
Using the MBO Bundle in Practice
Traders using the MBO Bundle often integrate it into their playbooks like this:
- For trend continuation: Look for iceberg absorption on SI tools, steady large bids via LT Pro, and reinforcing pressure on Market Pulse.
- For reversals: Watch for aggressive stop runs followed by liquidity imbalance shifts, confirmed by Tradermap Pro filters and pulse weakening.
- For scalping: Use Tradermap Pro to isolate large short-term liquidity zones, then monitor real-time execution using SI On-Chart.
You can create highly customized workflows depending on your style—but the common thread is clarity. The bundle turns noisy, abstract price movement into specific order-driven insight.
Compatibility and Setup Requirements
The MBO Bundle requires:
- A Bookmap Global or Global+ subscription
- A live MBO data connection via BookmapData CME or Rithmic
If you’re using a different data provider or only have access to MBP data, many of the core features (especially size filtering and iceberg detection) will not function.
Conclusion: A Data Advantage That Grows With You
The MBO Bundle isn’t just a premium product. It’s a learning tool. The more you explore how the market reacts to stop runs, absorption, and liquidity shifts, the more fluent you become in real-time market structure.
Even if you start by using only one or two add-ons, you’ll find value in layering them over time. You don’t need to be a high-frequency trader to benefit. You just need to care about why price moves.
For those ready to move beyond surface-level analysis, the MBO Bundle offers a direct view into what most traders never see.
View the full MBO Bundle here →
Sign Up Now