See futures more clearly in real time.
Compare plans to access deeper market visibility for futures.
Futures
September 5, 2025
SHARE
How the Options Market Dictates Intraday Futures Moves (Even If You Don’t Trade Options)

Do you think futures move only on “big news” or “smart money”? Oops! You’re missing the quiet puppeteer, or let’s call them “options dealers”.
Every day, their hedging flows push and sometimes pin futures prices to certain levels. And, most traders never see it happening. Why? They lack knowledge! Yes, from open interest “magnets” to gamma-driven reversals, options influence futures in several ways. Your regular charts don’t show this; thus, intraday moves seem random to you.
So, want to understand these hidden forces? In this article, you’ll learn how dealer hedging futures works, why options gamma futures zones matter, and how to spot these flows in popular order flow tools, like our Bookmap. Lastly, you will learn how to avoid traps. Read the complete article to start seeing the market through the lens of the people who are actually moving it.
The Hidden Influence: How Options Dealers Impact Futures
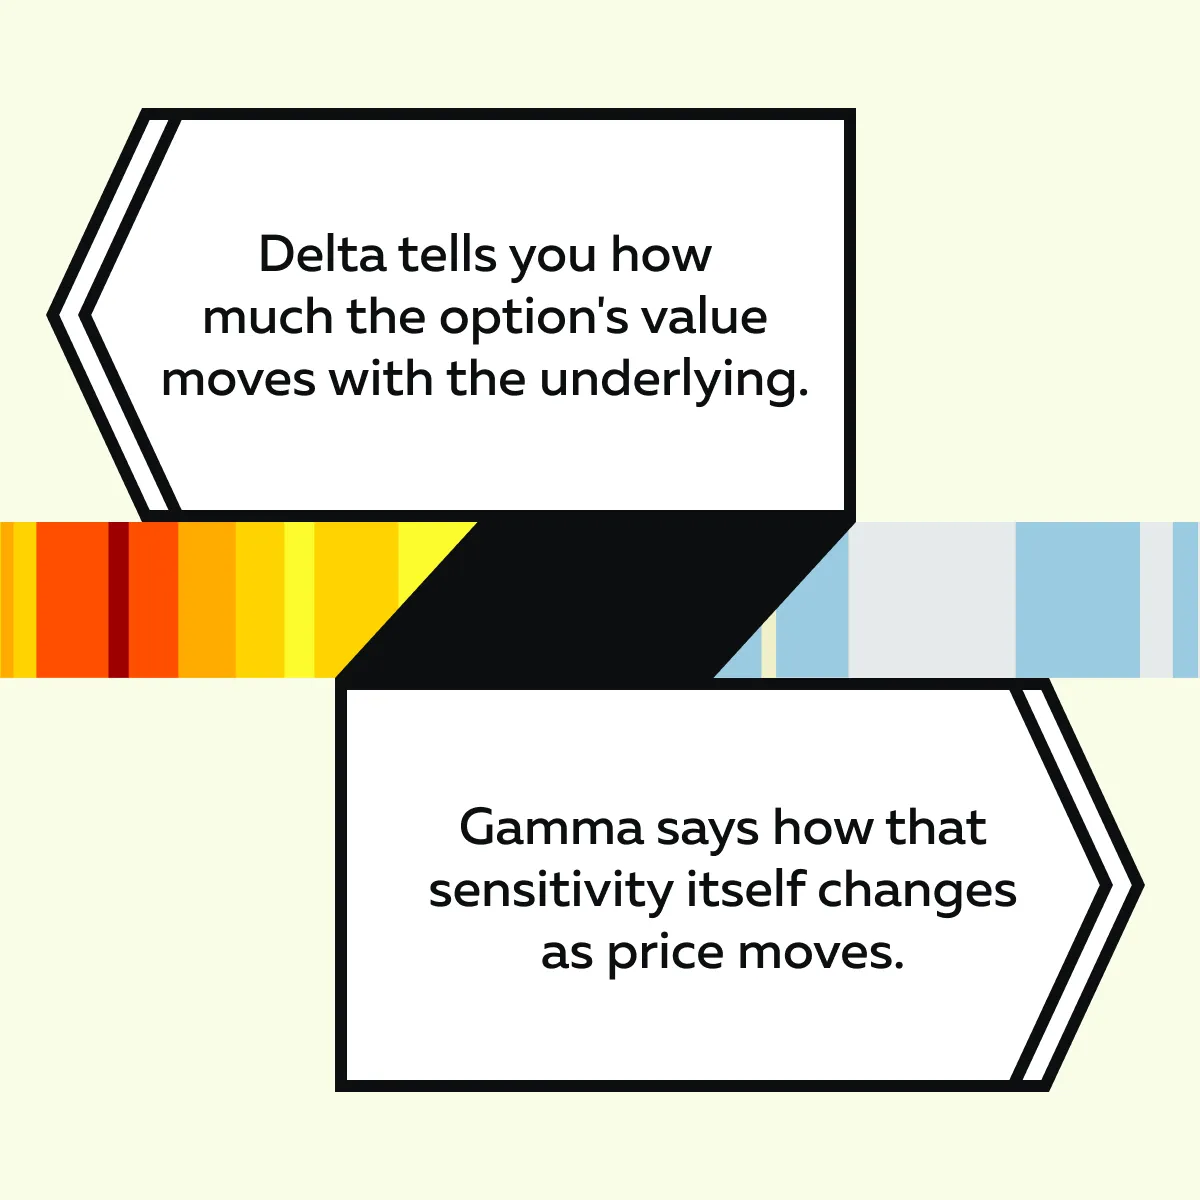
When traders buy or sell options, the counterparty is often a market maker, known as a “dealer”. Usually, dealers do not prefer facing the price risk from these trades and try to hedge that risk! But how? One common way is by using futures to balance their delta. For those unaware, delta measures how sensitive their position is to price changes in the underlying asset.
Due to this hedging process, volatility in the futures market has been created. For example,
- Say many traders buy SPX call options.
- The dealers end up shorting those calls.
- Now, to hedge, they buy ES futures.
- This extra buying pushes ES prices higher.
- This surge happens even if there is no change in economic news or fundamentals.
Understand that the same effect can reverse when hedging requires selling futures. Let’s learn when these flows are most noticeable:

Key Concepts You Need to Know (Even If You Don’t Trade Options)
You don’t trade options? Still, you must know how dealers hedge futures. This information allows you to see hidden forces in price moves easily.
Furthermore, certain option levels create a strong pull on futures prices, particularly as expiration approaches. Check out some key concepts you must know:
1. Open Interest (OI) Zones Act Like Magnets
Open Interest (OI) means the number of outstanding option contracts at a specific strike price. A strike with high OI represents a large concentration of open positions. As expiration gets closer, dealers managing these positions usually adjust their hedges using futures.
Now, this hedging activity causes prices in the futures market to drift toward these high OI strikes almost like a magnet! On some days, you may particularly notice the price staying close to a strike price with heavy OI. This concept is called “pinning.”
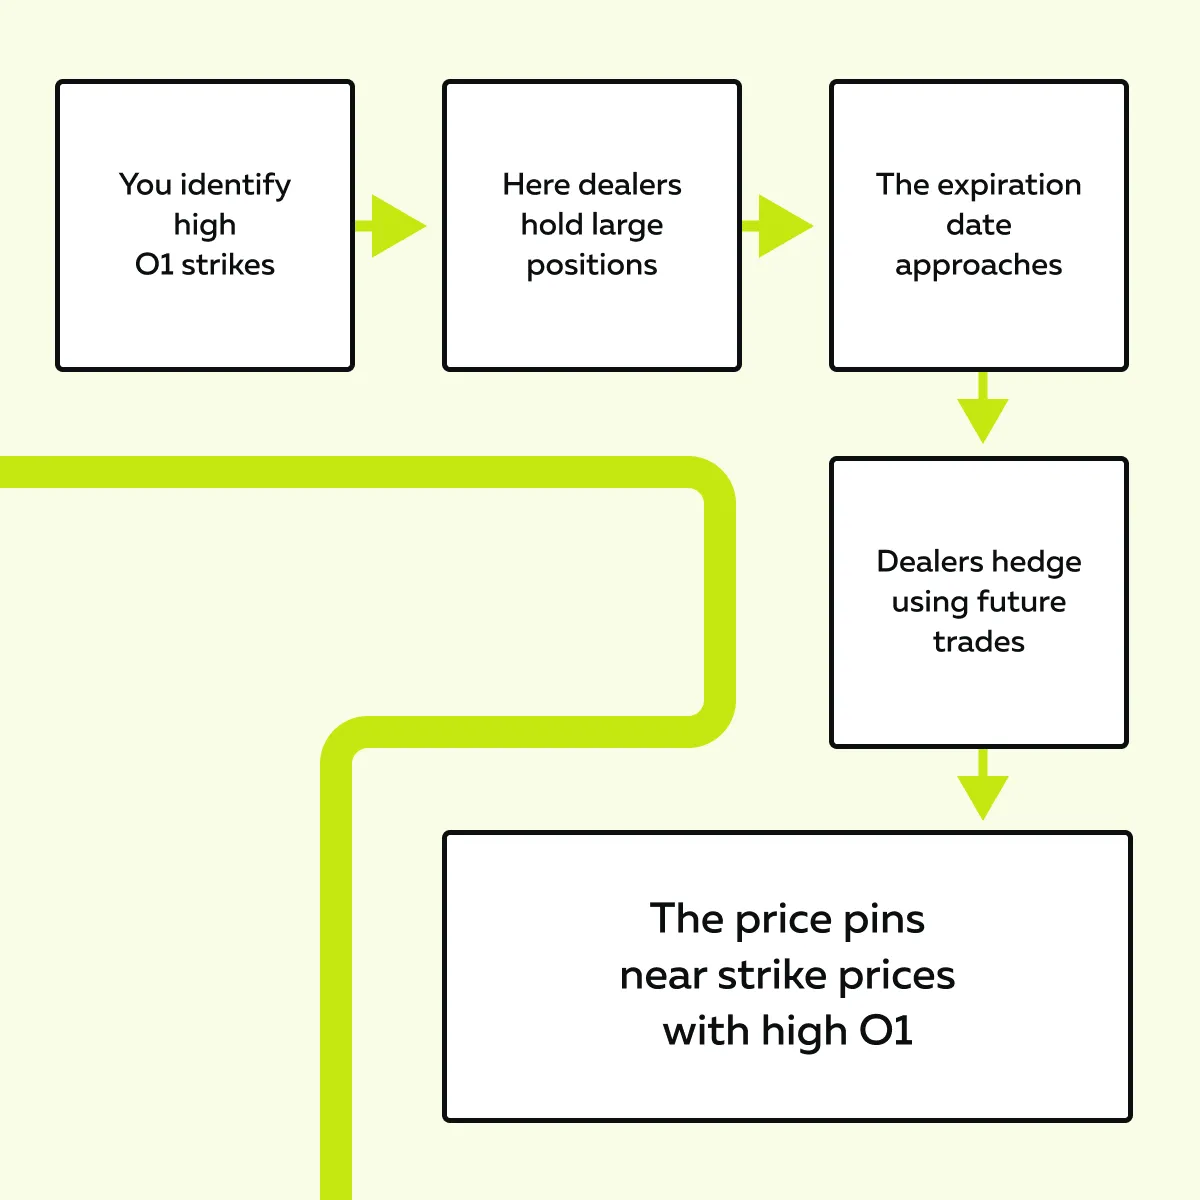
This primarily happens because dealers keep buying or selling futures to stay neutral as the underlying price moves. Want to track these OI clusters? You can easily do so on tools like SpotGamma or CME dashboards. Also, you can watch these zones on our platform, Bookmap. Through our tool, Bookmap, you can easily see where liquidity builds and where futures price action may slow or stall.
2. Gamma Shapes Dealer Hedging and the Tape
Gamma measures how fast an option’s delta changes when the underlying price moves. Firstly, let’s see how it is different from Delta:
As a trader, you must note that gamma is highest for at-the-money options and rises as expiry approaches. It significantly influences the way dealers do hedging. Let’s see how!
How Does Gamma Shape Dealer Hedging?
Dealers who sell or buy options manage the option delta by trading the underlying futures. How they trade depends on whether they are long gamma or short gamma:
| Long Gamma | Short Gamma |
|
and
|
Now, How Does It Influence Futures Prices?
Dealers’ hedging flows create predictable buying or selling pressure separate from fundamentals. Dealer hedges create persistent flows in the futures market if many option positions concentrate around a strike (say, a high gamma zone). These flows change how the price behaves.
Tape / Bookmap Clues (What to Watch For)
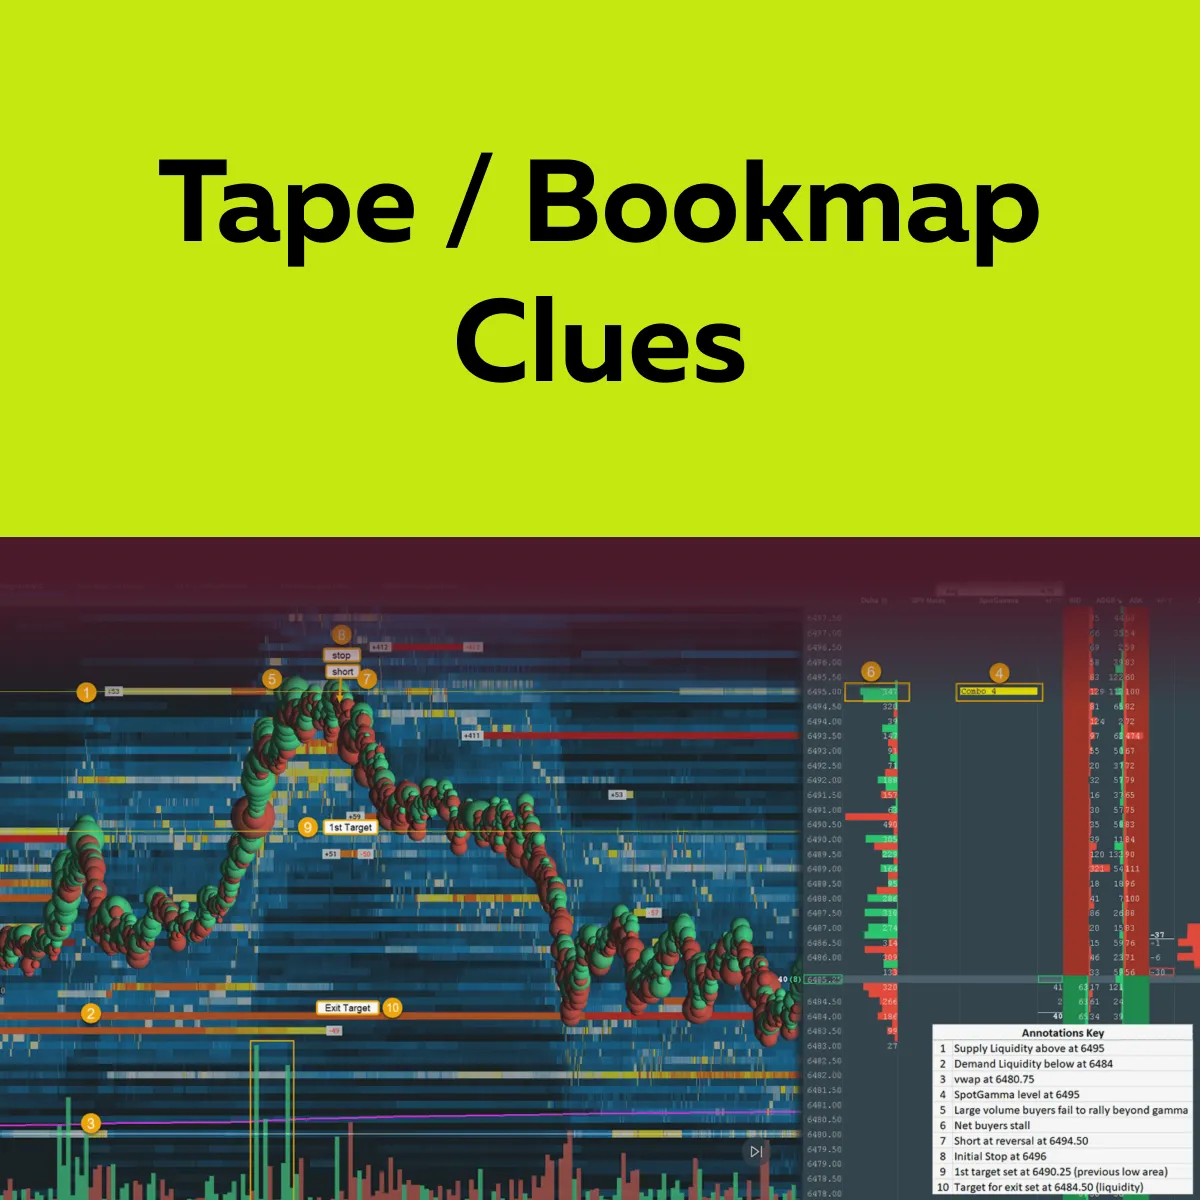
On days when gamma exposure changes, the futures tape shows these four recognizable patterns:
| Pattern I | Pattern II | Pattern III | Pattern IV |
| Liquidity pulls (resting bids/asks disappear) right before big moves. | Aggressive market orders chase price. While doing so, they leave clusters of large trades. | Price fails to mean-revert after move attempts. Particularly, this happens on short-gamma days. | On long-gamma days, the price “sticks” near a strike. This pattern shows lower realized volatility. |
Don’t trade in the dark — use Bookmap to visualize how options-driven flows move the futures market.
Some Pro Tips
- Always monitor gamma and OI zones. Through such monitoring, you can predict where dealer hedging in futures will likely occur. As a result, you can anticipate:
- Price magnets,
- Reversals, and
- Volatility.
- Be aware that there is always a higher risk for strong price fluctuations and stop runs on days with heavy short gamma.
- To better read the tape, always follow this formula/ ideology:
As a dealer, you should know that dealer flows are a source of directional pressure! When you know how to spot dealer hedging futures, you can avoid getting swept into moves that have little to do with fundamentals.
3. “Max Pain” Isn’t Just a Myth
“Max pain” is the price level where the greatest number of outstanding options (both calls and puts) would expire worthless. At this level:
- The total payout to option holders is the smallest
and
- Option sellers (often dealers) keep the most premium.
As you know, dealers manage risk via futures; their hedging activities sometimes pull the market toward this level. In particular, such a pulling happens when the options expiration (OPEX) approaches.
Furthermore, it has been observed in many cases that if price drifts too far from the max pain level, dealers “adjust their hedges” by buying or selling futures to reduce risk. These trades again push the price back toward the max pain zone.
The impact? This dealer activity is why you sometimes see futures prices stall or reverse intraday near certain strikes on OPEX Friday. The price movements do not match the day’s news or fundamentals! They are simply being caused by dealers adjusting positions.
With this knowledge, you can easily recognize when price action is influenced more by options gamma futures than by investor sentiment or economic data.
What This Looks Like in Futures Order Flow
Futures price action often shows patterns related to options positioning. Dealer hedging can leave clear footprints in the order flow. Let’s see what these footprints are:
Let’s understand these footprints in detail:
Dealer Hedging Creates Visible Liquidity Behavior
When dealers hedge large option positions, liquidity often builds or vanishes at specific strikes. These strike prices are mostly tied to:
- High open interest,
or
- High gamma exposure.
Want to know how this looks on our Bookmap? They look like “stacked bids or offers” at certain price levels. You can see them even if there’s no technical reason for support or resistance.
For example,
- Let’s assume that on an OPEX Friday, ES futures oscillate between two nearby levels, such as 4440 and 4460.
- This oscillation between levels occurs because the options market’s impact on futures keeps pinning prices.
- Now, dealers keep adjusting positions via futures.
- They buy on small drops and sell on small rises.
- This activity leads to repeated micro-reversals.
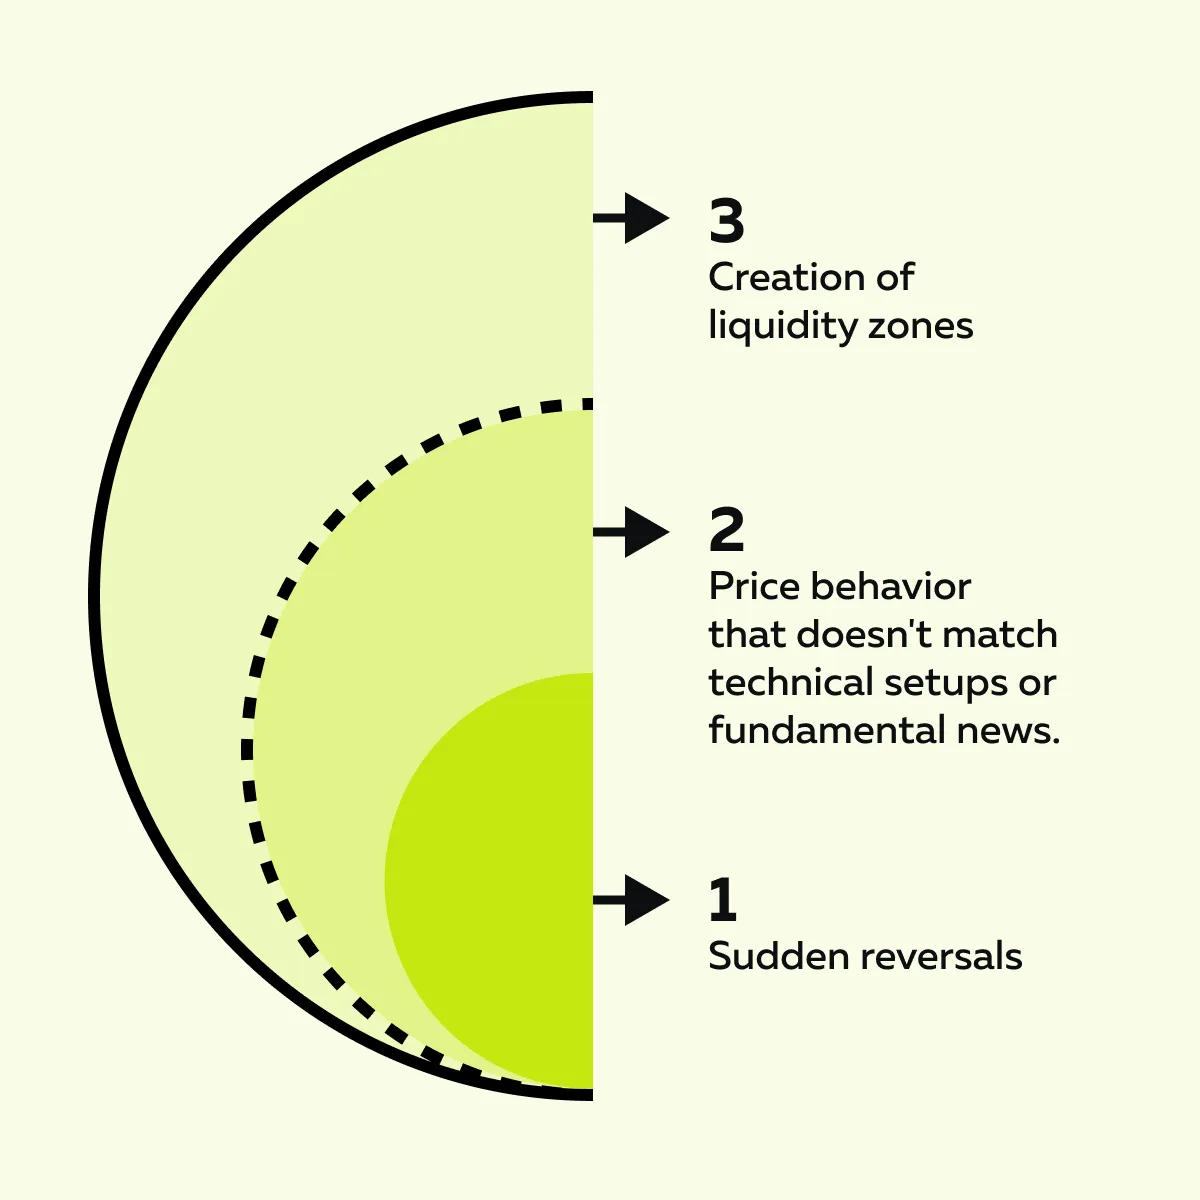
Sudden Reversals with No News? This Might Be Why
Let’s assume that the futures price breaks past a major strike price. What is the impact on the dealer? Their delta exposure shifts quickly. Now, to stay hedged, they need to buy or sell a large number of contracts in a short time. This activity causes short-lived squeezes or drops that reverse just as fast!
What Will You See On the Tape?
Primarily, you will observe these three patterns:
- A burst of aggressive volume with no follow-through,
- Large iceberg orders absorbing at key strikes,
- Price stalling or snapping back near round numbers or expiry times.
You must realize these moves occur due to options gamma futures and not from fresh fundamental information. By recognizing them, you can avoid entering late or getting stopped out in false breakouts.
How to Incorporate Options Flows Into Your Futures Trading
You can analyze “options flow” to predict where futures prices may stall, reverse, or accelerate. Let’s see how such an analysis can be made:
Need more clarity? Let’s understand how you can incorporate options flows into your futures trading:
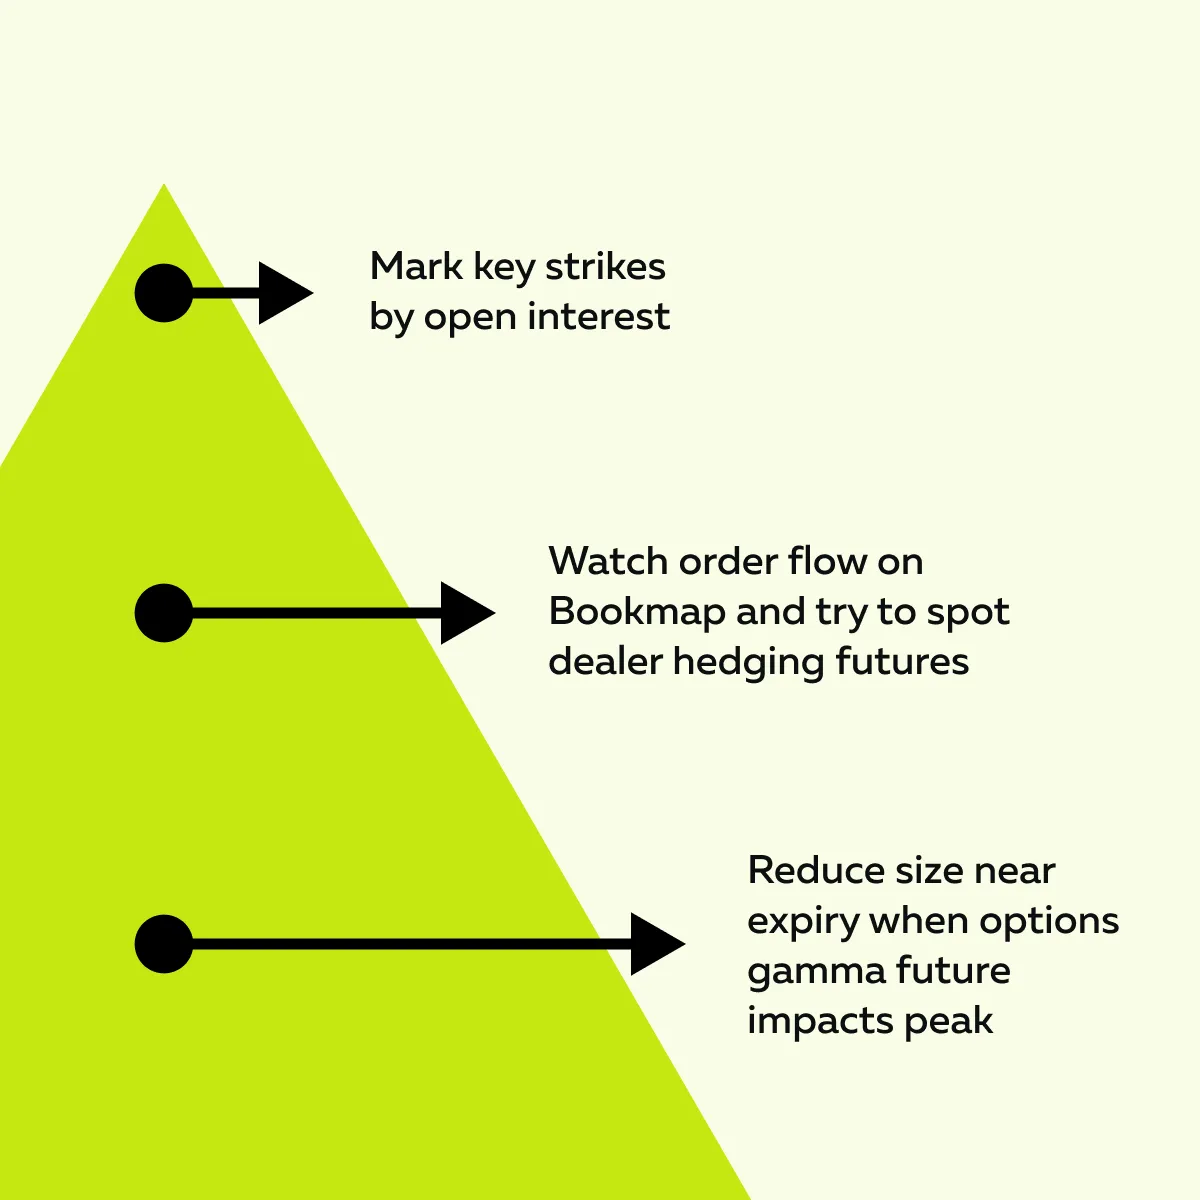
Overlay Options Levels on Your Chart
Follow these five proven techniques:
| Techniques | Explanation |
| Pick the strikes |
|
| Map to your futures |
|
| Mark gamma zones |
|
| Refresh daily |
|
| Use context |
|
Even if you don’t trade options, you can track their effect with Bookmap’s order flow view.
Use Bookmap to Confirm Behavior at These Levels
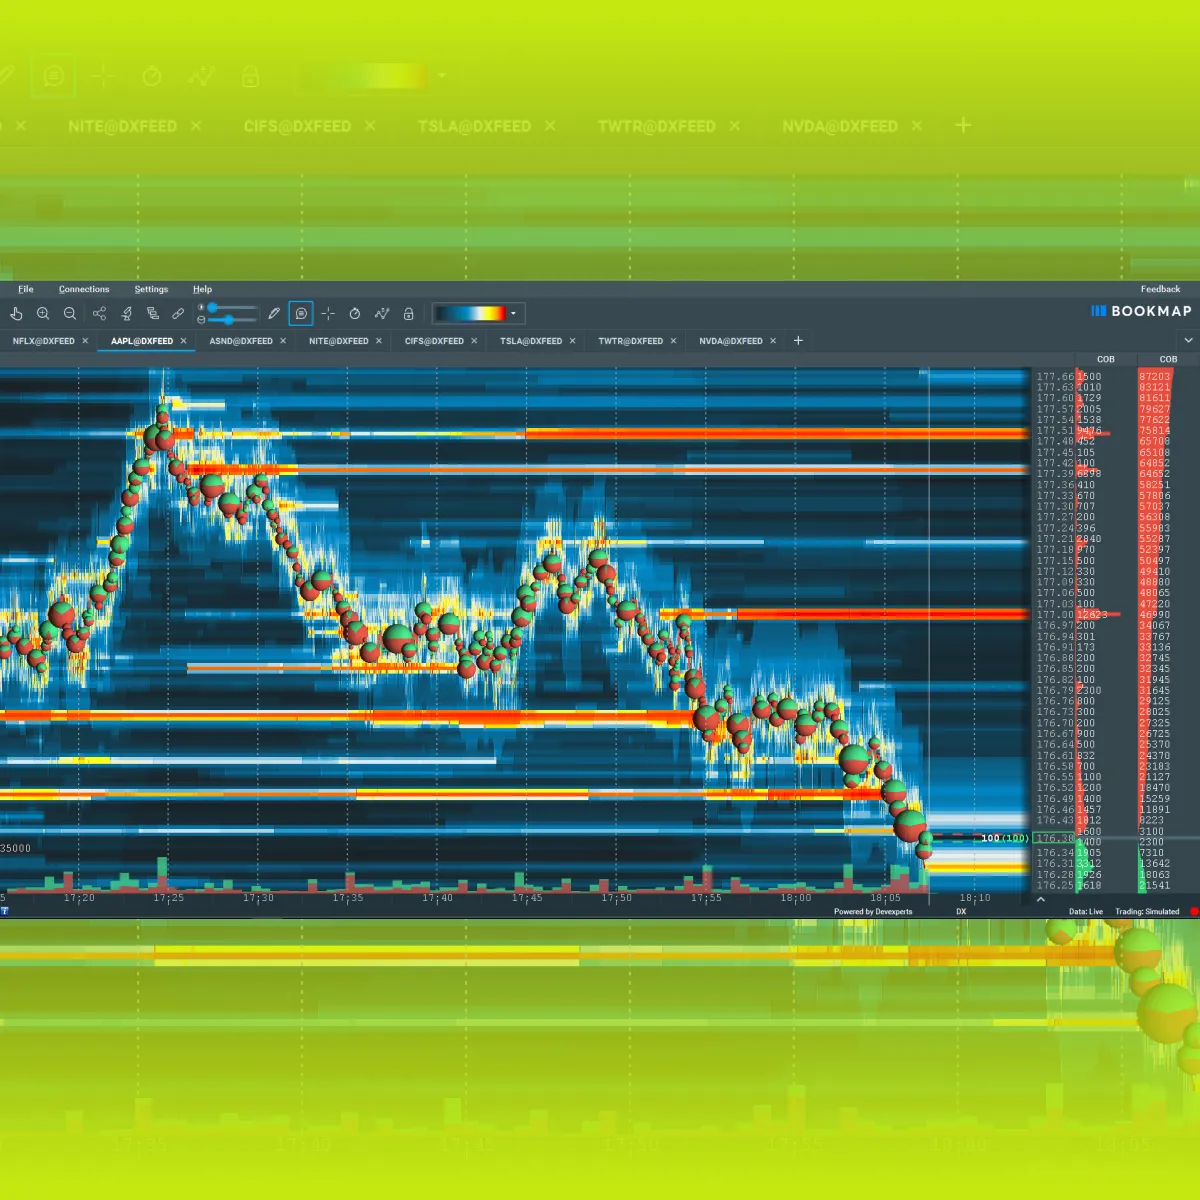
As a trader using our tool, Bookmap, you should look for stacked liquidity. On our platform, Bookmap, try to find big resting bids or offers on your option lines. These often indicate dealer targeting or absorption. Furthermore, spot these confirmations:
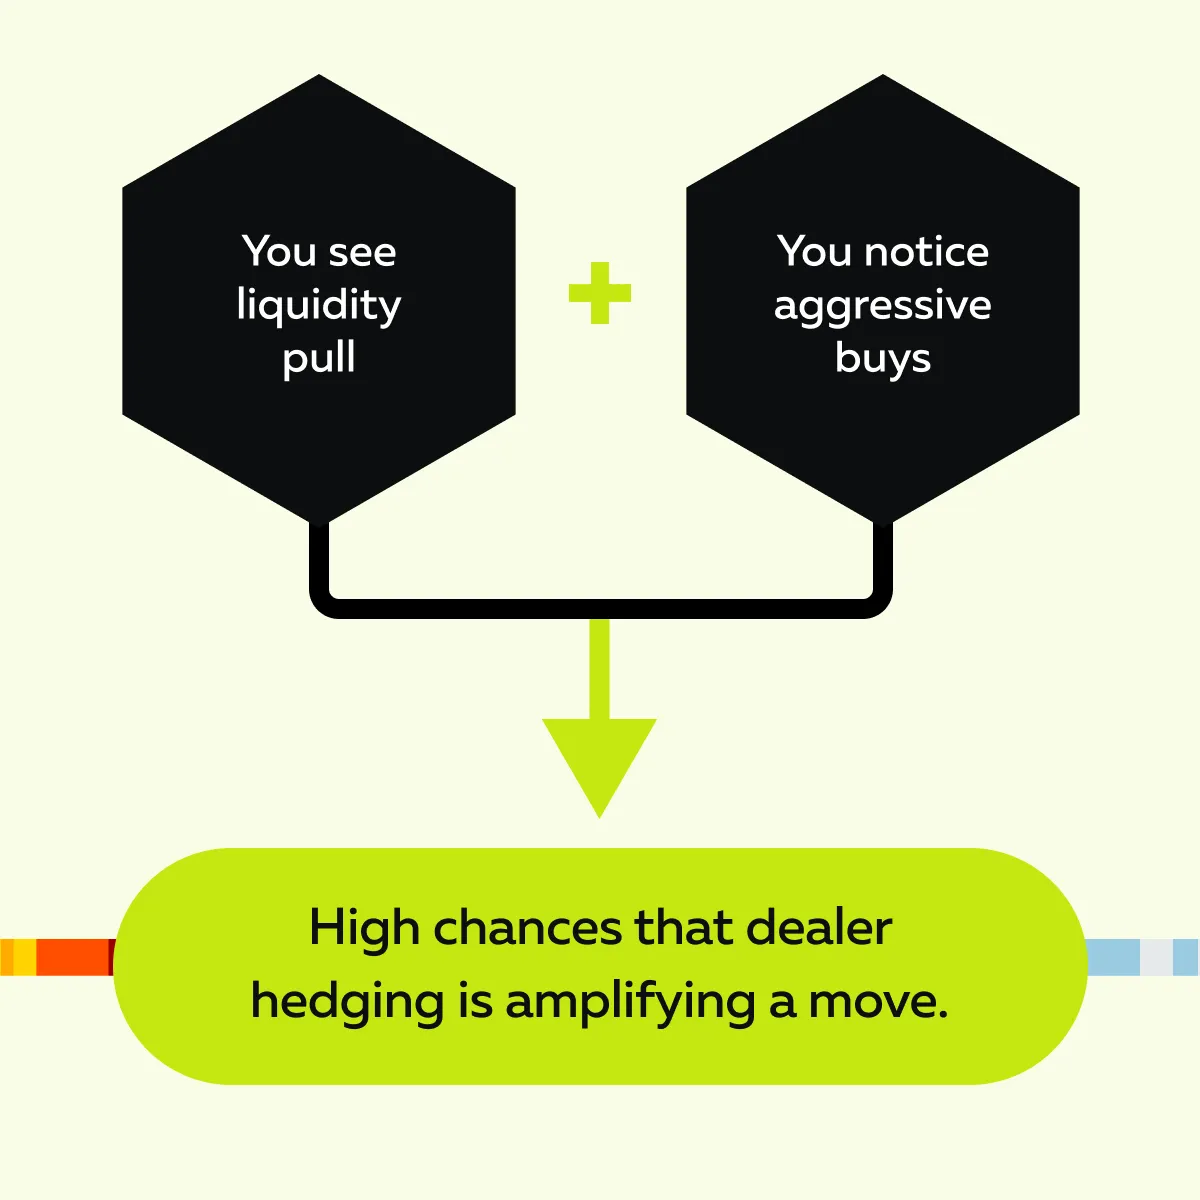
- Watch for liquidity pulls:
-
-
- If you notice the sudden removal of resting orders before a move, this signals a squeeze or dealer re-hedge.
-
- Spot absorption:
-
-
- Say you observed aggressive market orders hitting a level while large resting blocks remain.
- This is a sign that dealers are absorbing the flow via dealer hedging futures.
-
- Read the dots:
-
- Clusters of aggressive volume chasing price usually mean hedging is in play (short gamma days).
Lastly, always confirm before acting! Say price touches an OI line, but you see absorption. There is no follow-through. In this case, you should wait for a clear acceptance or rejection. This signal is shown by subsequent order flow.
Be Cautious Near Expiry
As options get closer to expiration, gamma increases! This gamma spike increases the sensitivity of option deltas, and they change faster with price moves. At this time, dealers need to adjust their futures hedges more frequently. Such rapid adjustment creates stronger and more noticeable hedging flows in the market.
What can you expect?
Be ready for pinning and whipsaws! Yes, the price may stick to a strike (pin), snap through it, and reverse as the dealer rebalances. To trade smartly, follow these trade rules for OPEX:
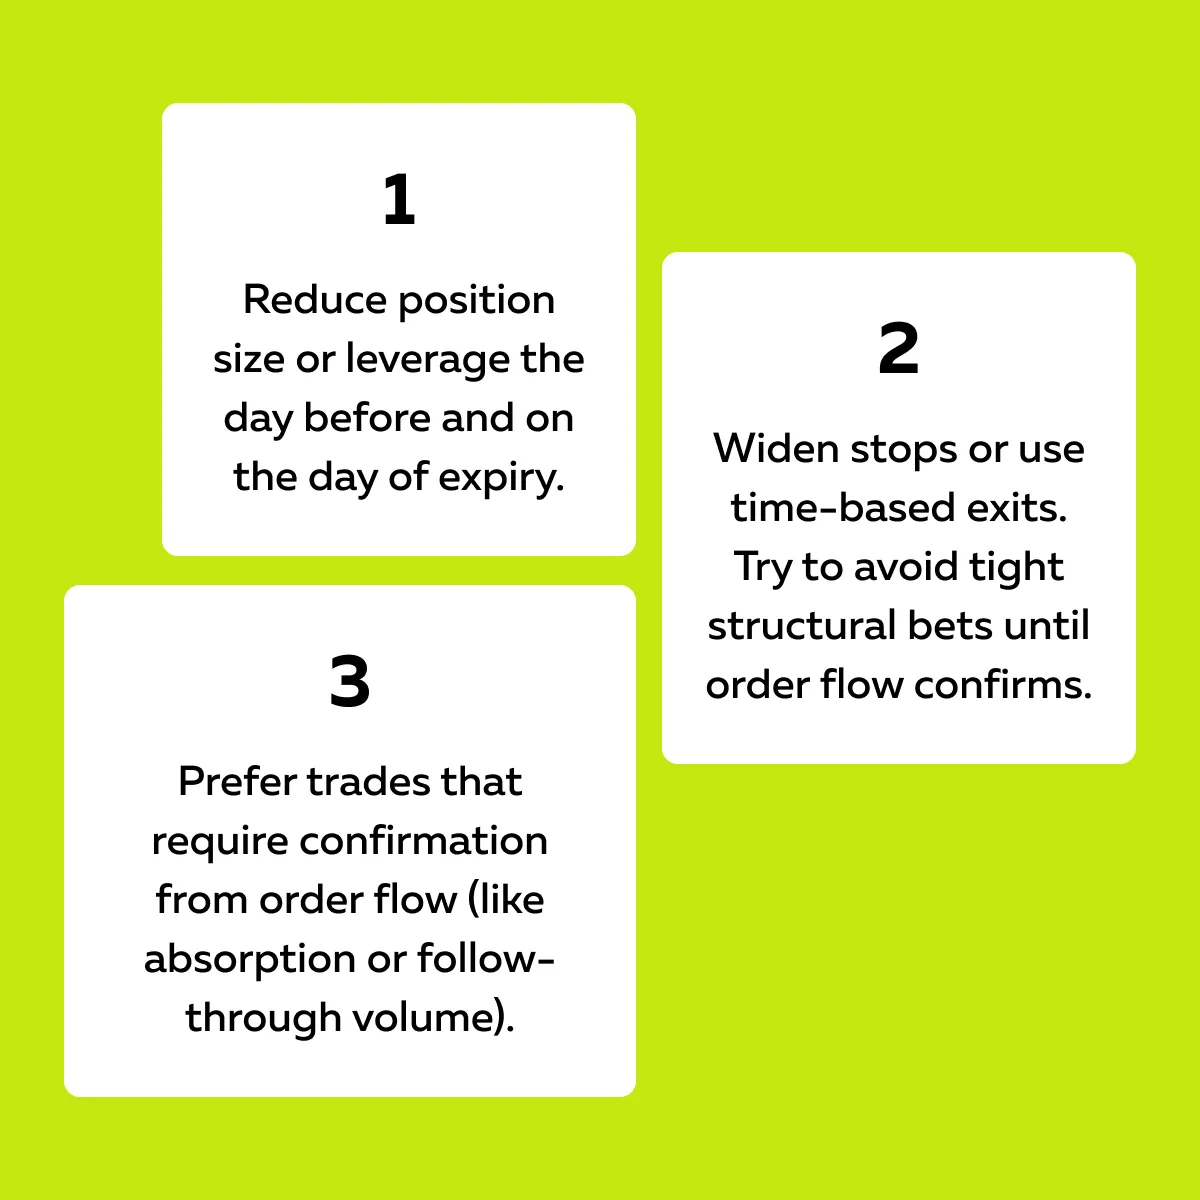
Furthermore, if you must trade, try to use a smaller size and set clear risk limits. Always avoid assuming a breakout on the first touch of a gamma-heavy strike.
Conclusion
Even if you never trade options, their influence on futures is constant! For most traders, dealer hedging futures around high open interest and key gamma levels creates price behavior that looks random.
But by now, you must have understood what’s driving it! By understanding the options market impact on futures, you can spot where liquidity will build, where reversals may occur, and when breakouts are likely to fail.
With practice, you can easily recognize popular patterns. Always combine OI and gamma data with live order flow as a tip. This strategy will allow you to align your trades with real market drivers. But how can you create this combination? Our platform, Bookmap, is the perfect tool for this purpose. See how dealer hedging shows up in real-time with Bookmap’s volume and liquidity tools.
FAQ
1. Why should I care about options if I only trade futures?
As a trader, you must understand that options trading affects futures. That’s because dealers hedge option positions using futures. This buying or selling pushes futures prices toward certain levels or keeps them pinned there.
If you ignore option flows, you miss out on factoring in a major force that moves futures markets daily.
2. What are the signs of options-driven price behavior?
You might see these common signs related to futures prices:
- They stick to a round number.
- They reverse suddenly without news.
- They act choppy near strikes with high open interest.
But why? These patterns happen because dealer hedging flows from options positions that are influencing the futures market.
3. Can I see this in Bookmap?
Yes! On our tool, Bookmap, you can clearly see options-driven activity. It appears as follows:
- Sudden spikes in aggressive buying or selling,
- Large resting orders are stacking at key strikes, and
- Iceberg orders absorbing volume.
These behaviors are often more visible near option expiration or major news events.
4. Where can I find the open interest levels?
You can check free or paid sources like Coe, SpotGamma, CME Group, or TradingView OI overlays. Mark these levels on your chart and then watch Bookmap to see if the price reacts there. This activity confirms whether dealer hedging is influencing the futures market.
Sign Up Now