See order flow more clearly in real time.
Compare plans to access deeper market visibility for order flow.
Education
July 8, 2025
SHARE
Beyond Level II: How Order Flow and Historical Context Help You Trade Smarter
Level II is prima facie. Order flow reveals the full fantasia!
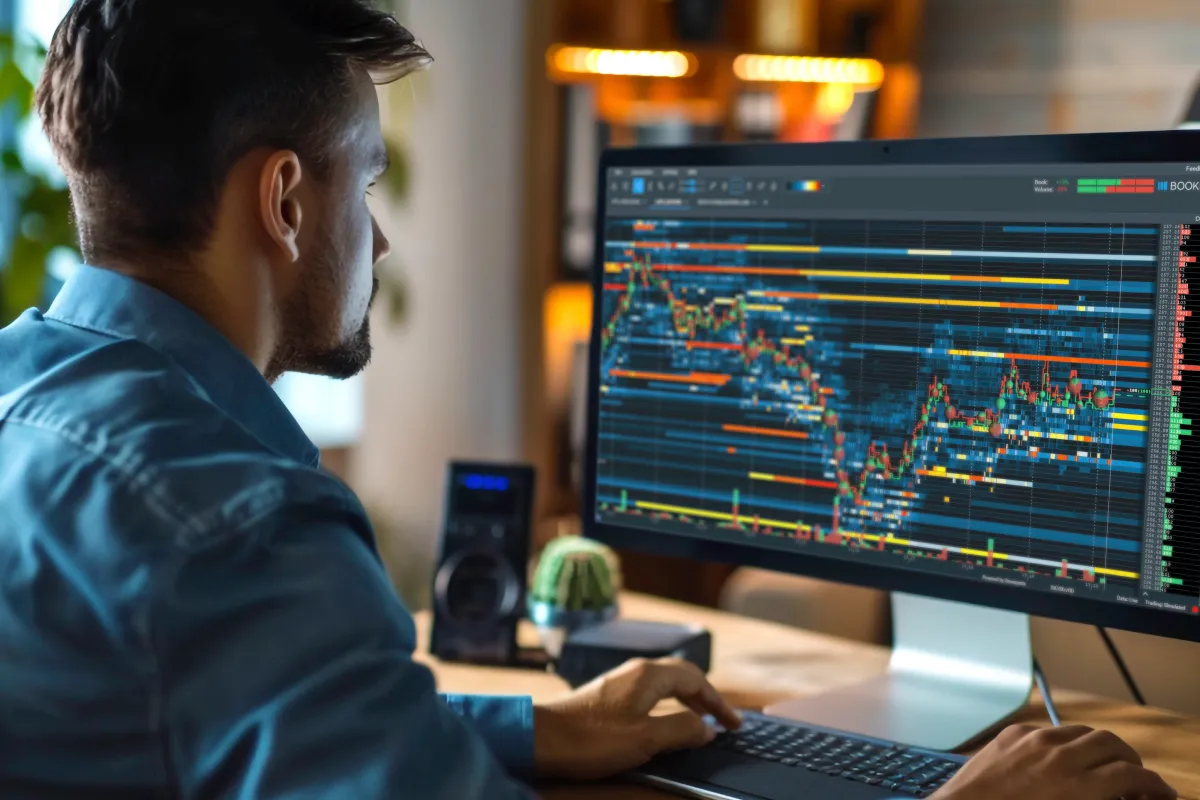
For active traders, understanding market intent versus actual behavior is highly important. Level 2 market data displays resting orders across price levels. However, it doesn’t go into detail about which orders are real, which get filled, or how the market responds. That’s where order flow trading steps in!
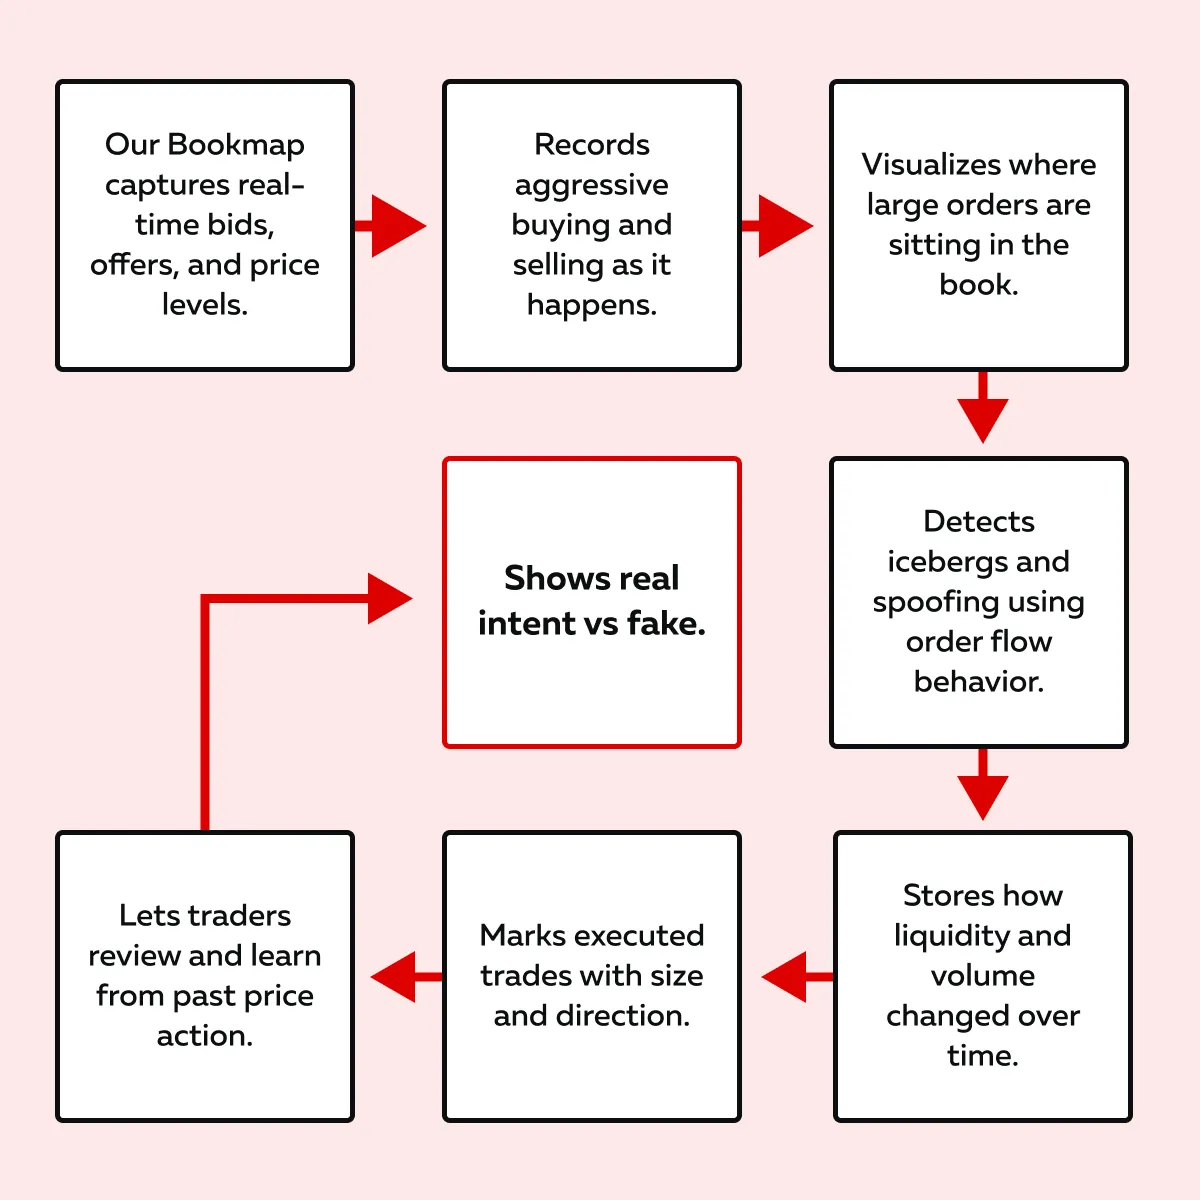
Modern real-time order flow tools, like Bookmap, track executed trades, show hidden liquidity, and display historical activity. Through them, you get a complete view of market behavior.
So, want to move beyond guesswork? In this article, you will study the key differences between order flow vs Level 2, the role of tape reading, and how order book trading becomes far more effective when you add historical context. Let’s begin.
What Level II Data Shows – and Where It Stops?
Level II data is also called depth of market (DOM). It shows you the visible limit orders sitting in the order book at different price levels (usually 5 to 10 levels above and below the current market price).
It tells you:
- Who’s willing to buy or sell
and
- At what prices.
This type of level 2 market data reveals liquidity. By analyzing it, you can understand how much demand or supply exists at various prices. For example,
- Say you see a large number of contracts stacked at a price level.
- Now, this might suggest support or resistance.
What Does Level II Show?
It shows you the current bids and offers. Additionally, it updates in real-time as orders enter or leave the book. Through it, you can identify where other traders are interested in transacting!
But, Level II isn’t Foolproof! It Falls Short Here –
Despite being helpful, Level II has some serious blind spots! Check out the graphic below to know them:
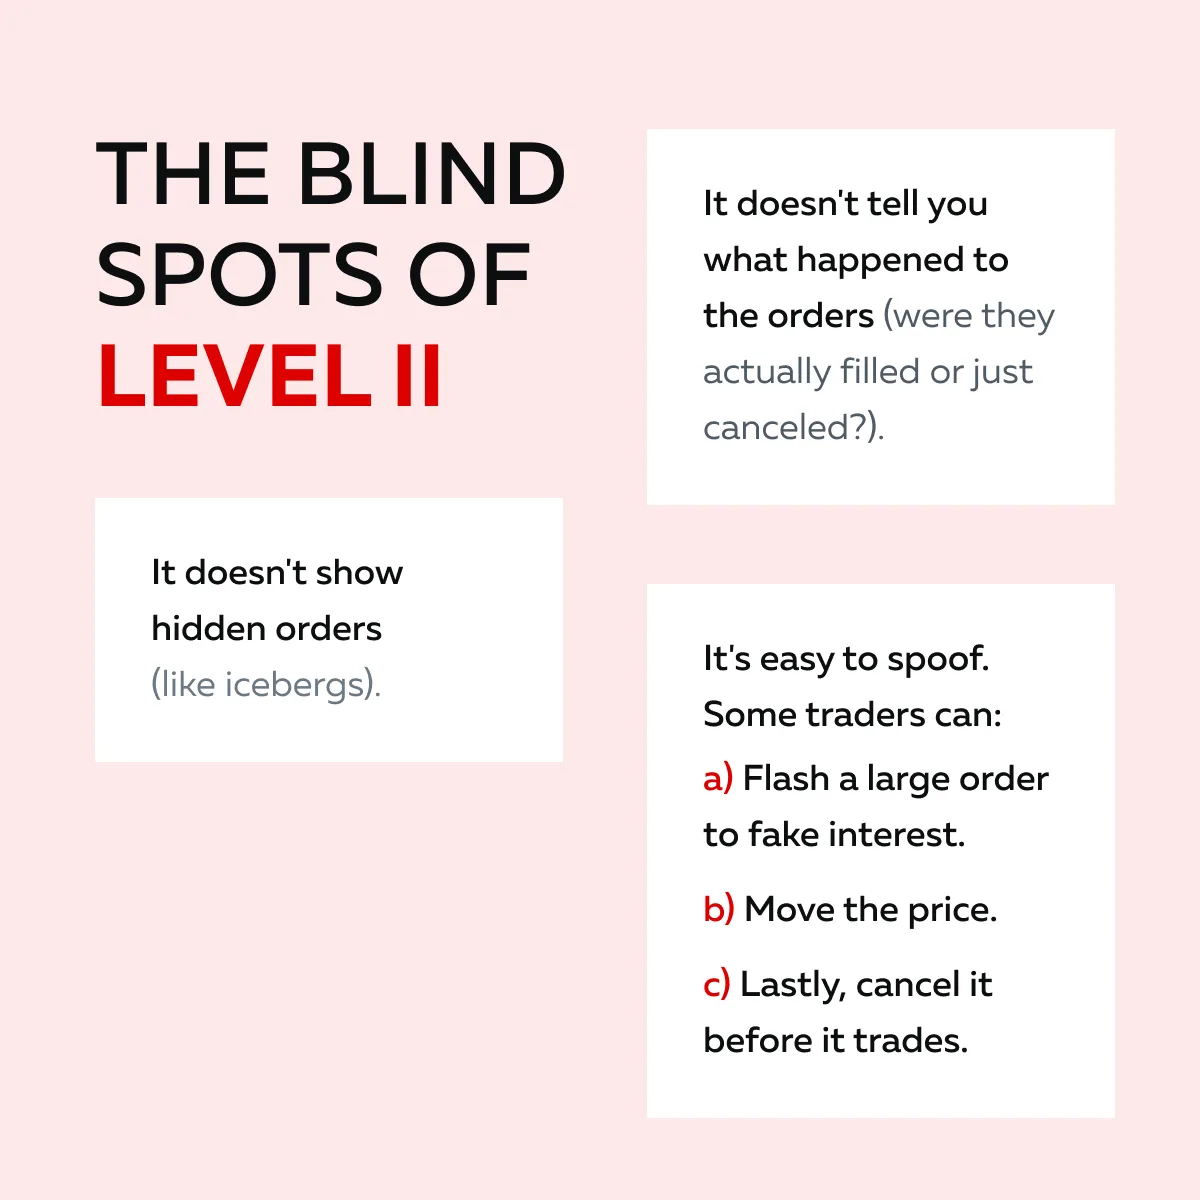
For more clarity, let’s study an example:
-
- Say you see a bid of 1,000 contracts appear on the DOM at a certain price.
- The price moves toward it, but then the order disappears.
- Was that order filled (executed), or was it canceled to trick other traders?
-
- You won’t know just by looking at Level II, as it leaves no trace.
- That’s a major limitation!
Why Do Some Traders Go Beyond Level II?
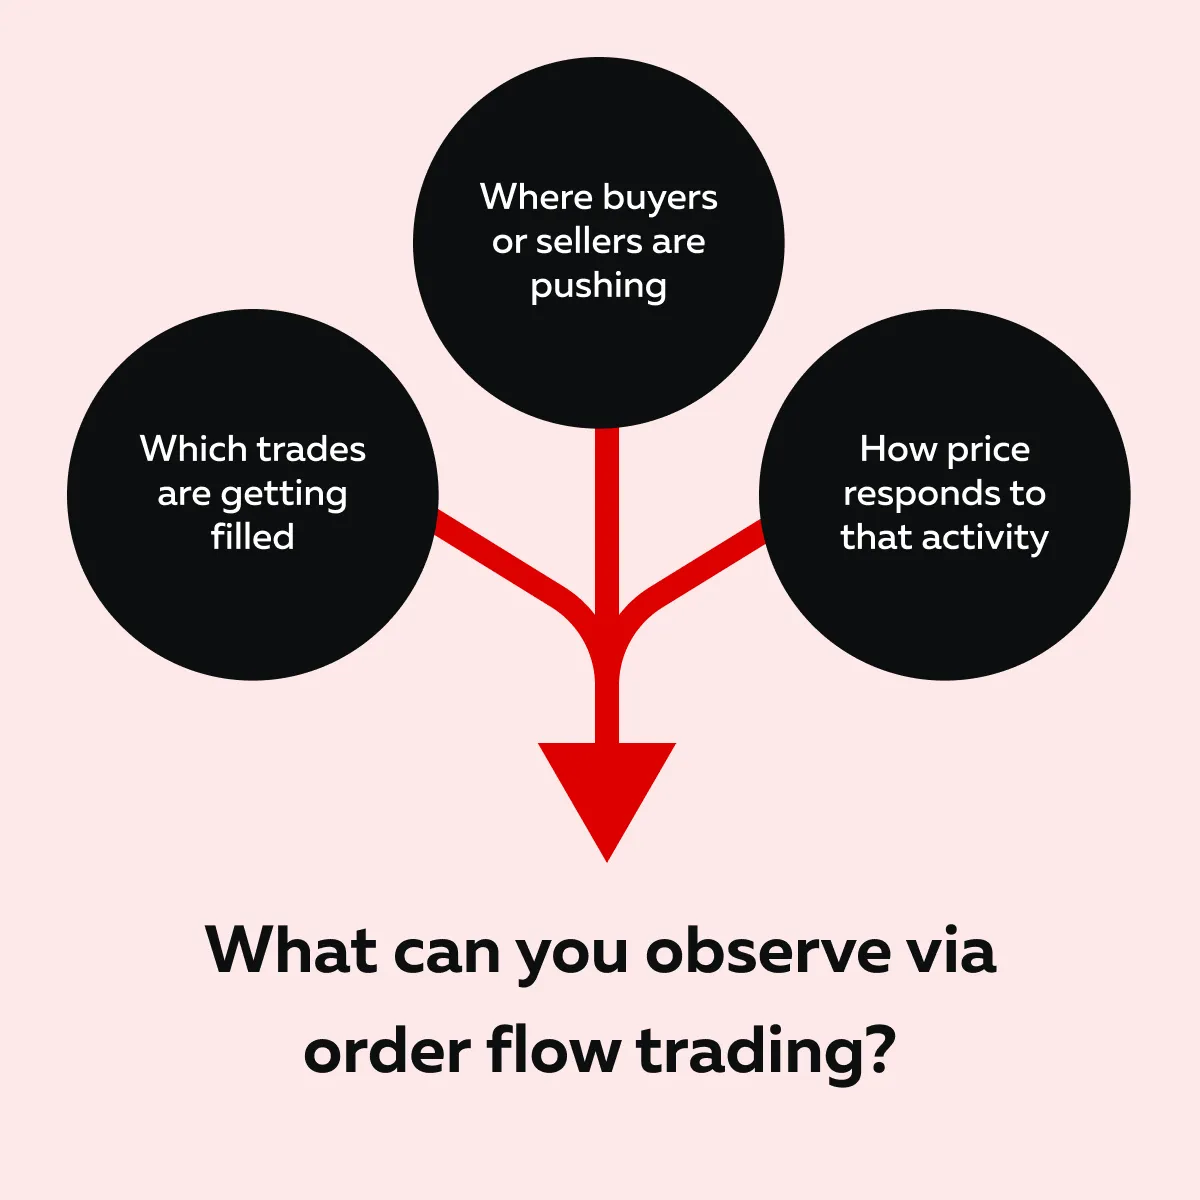
This is why many traders prefer order flow trading. Instead of merely watching what might happen based on visible orders, “order flow” shows:
- What’s actually being executed, and
and
- Which trades are going through, and at what price and size?
Through it, you can separate intent from action. In fact, tape reading vs level 2 is a classic debate! Level II shows you the current interest in the market, but it lacks the detail and context that order flow or tape reading can provide.
Refer to the table below to understand what all of them show:
| Tape reading (aka time and sales) | Level II | Order flow trading |
|
|
|
Additionally, some traders use order book trading strategies. They apply these strategies to discern patterns in how orders enter and exit the book (particularly when combined with executed trades).
What Order Flow Adds: Real and Historical Behavior
Level 2 market data shows you who wants to trade and at what price. However, order flow trading goes a step further! It reveals:
This information helps you move beyond guesswork. Wondering which tool to use? Bookmap is a modern, real-time market analysis tool. It offers you several features that let you perform intelligent order flow trading. Let’s explore them:
| Bookmap’s Features | Explanation |
| Heatmap |
|
| Volume Dots |
|
| Iceberg Detection |
|
| Historical Playback |
and
|
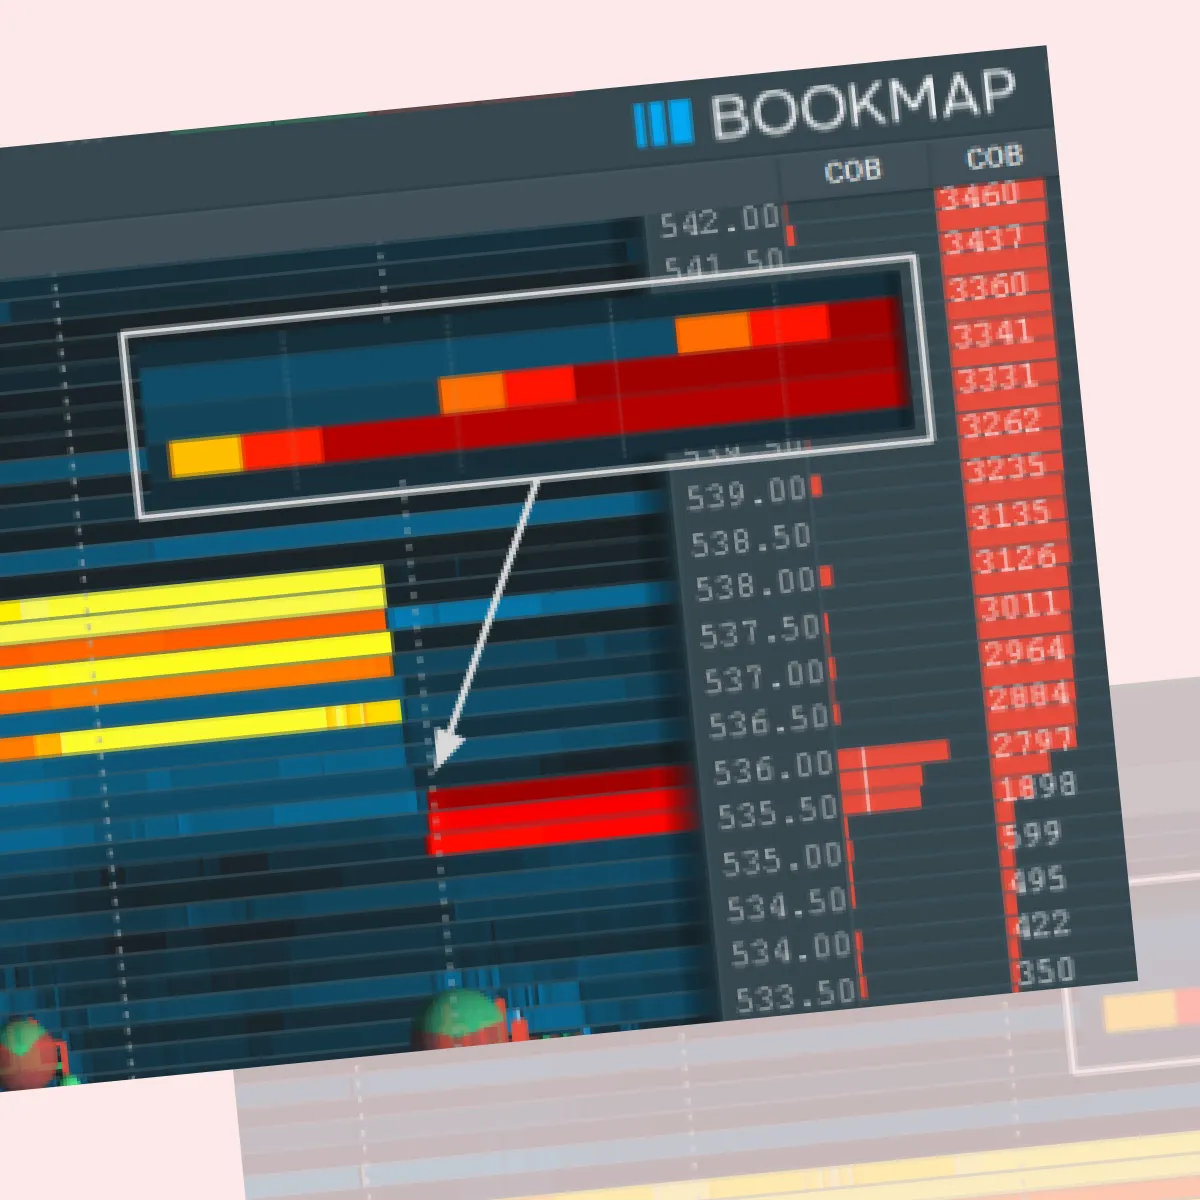
Want to move beyond Level II? See how Bookmap gives you a deeper look at real-time order flow.
How Bookmap’s Features Help You in Real Trading?
Using our modern tool, Bookmap, you can spot spoofing or fake walls. A big sell order might appear on Level 2, but if it never gets hit and vanishes, it is likely fake! With Bookmap, you can confirm whether real trades occurred at that level.
Additionally, you can see absorption:
- Bookmap helps you spot when aggressive buyers or sellers enter the market, but the price doesn’t move.
- This suggests a large passive trader is absorbing the volume.
- This insight is highly useful for fade or breakout setups.
How Bookmap Complements (and Extends) Level II
Many traders treat Level 2 market data and Bookmap as separate tools! However, the truth is that Bookmap builds on what Level II offers. You can think of Bookmap as a smarter and more visual way to:
- Read the order book
and
- Combine depth, execution, and order flow history in one place.
Please note that Level II shows the top few levels of buy/ sell orders. They are helpful, but limited! On the other hand, our Bookmap platform takes that “raw order book trading data” and layers on:
- Real-time execution,
- Historical patterns,
- Hidden liquidity, and more.
Check out the graphic below to gain more clarity:
This makes order flow trading with Bookmap far more comprehensive. With our platform, you’re not just seeing what traders intend to do(like in Level II). Instead, you’re seeing:
- What they’re actually doing
and
- How they’ve behaved over time.
To understand better, refer to the “Level II vs. Bookmap” feature comparison table below:
| Feature | Level 2 Market Data | Bookmap (Order Flow Visualization) |
| Top-of-book visibility | ✅ Yes | ✅ Yes |
| Full depth of the book | ❌ Usually limited | ✅ Full depth (if data supports it) |
| Shows real executions | ❌ No | ✅ Yes – volume dots show aggressive trades |
| Historical record | ❌ No | ✅ Yes – heatmap + trade history |
| Iceberg detection | ❌ No | ✅ Yes – detects hidden liquidity |
| Visual absorption tracking | ❌ No | ✅ Yes – shows price stalling vs pressure |
| Replay for review/training | ❌ No | ✅ Yes – replay full market behavior |
Now, let’s study how having historical order flow data (via Bookmap) helps in real trades:
1. Breakout Traps
What does Level 2 show?
- During a breakout (such as when the price pushes above a key resistance), you’ll often see the top levels of the order book thin out.
- This means fewer visible sell orders above the current price.
- On Level 2, that might look bullish!
- However, you can’t tell whether:
- Traders are pulling orders to trick you.
or
- There’s real buying interest.
What does Bookmap add?
On Bookmap, you can see the following:
| Heatmap fade | Volume dots | Post-breakout behavior |
|
|
|
How does it help?
Level 2 only shows present intent (which might be fake). However, order flow trading shows real-time execution. Through it, you can avoid being the last one in before the price reverses!
2. Absorption After Earnings
What does Level 2 show?
- During earnings releases or other big news events, prices fluctuate rapidly.
- You might see big buy or sell orders flash on Level 2 market data.
- However, you can’t tell if those are real trades or just noise.
What does Bookmap reveal with order flow analysis?
On our tool, Bookmap, you can observe the following:
| Absorption at key levels | Iceberg detection | Buyer reaction |
|
|
|
How does it help?
Order book trading around earnings is tricky! That’s because it’s fast and manipulative. By using our tool, Bookmap, you can separate emotional reactions from institutional moves. You can see what actually gets executed!
Learn how real traders are reading the tape—check out the Learning Center.
3. Spoofing and Fake Walls
What does Level 2 show?
- Sometimes, you’ll see a massive order appear on the bid or ask in Level 2.
- It might look like strong support or resistance.
- But is it real?
- Level 2 doesn’t reveal whether the order was genuine or just spoofing (a fake order meant to influence other traders).
How does Bookmap help you detect spoofing?
On our Bookmap platform, you can see the following:
| Historical heatmap | Executed vs pulled | Pattern recognition |
|
|
|
How does it help?
Spoofing can suck traders in and trap them. Order flow vs level 2 is highly important here! That’s because Level 2 shows fake intent, while Bookmap shows real behavior.
Why Historical Context Changes Everything
When you’re trading live, the market moves rapidly! Due to strong fluctuations, sometimes, by the time you process what just happened, it’s already gone. That’s the biggest limitation of traditional Level 2 market data! There’s no memory. If you don’t catch the movement in real-time, it vanishes!
This is where popular order flow trading tools, like Bookmap, create a serious edge! Let’s go into detail:
Level II Has No History!
Level II only shows you what’s happening right now. It displays the visible order book trading data (top 5 to 10 levels of bids and offers). But once orders are pulled or executed, they disappear from view. Due to this, you don’t know:
- Whether that 500-lot bid got filled or was pulled.
- Whether that large offer stalled the price or
- Whether traders stepped in to defend a level.
You’re left guessing!
Bookmap Gives You a Memory of the Market
Bookmap doesn’t just show you the current market! Instead, it shows you the story behind the moves. Here’s what you can do with Bookmap:
- Revisit Key Events: You can replay the entire session and see:
- How resting liquidity shifted (as shown by the heatmap).
- Where volume dots exploded with aggressive buying or selling.
- How large traders positioned themselves before and after big moves.
This is impossible with Level 2 alone.
- Analyze Player Behavior: Want to know how institutional players entered or exited? With Bookmap, you can go back and study:
- How price moved into a large iceberg order,
- How traders absorbed or faded earnings moves, and
- How spoofing behavior occurred across multiple levels.
This information lets you spot repeatable patterns! Want to turn Bookmap into a trading edge? Check out the graphic below:
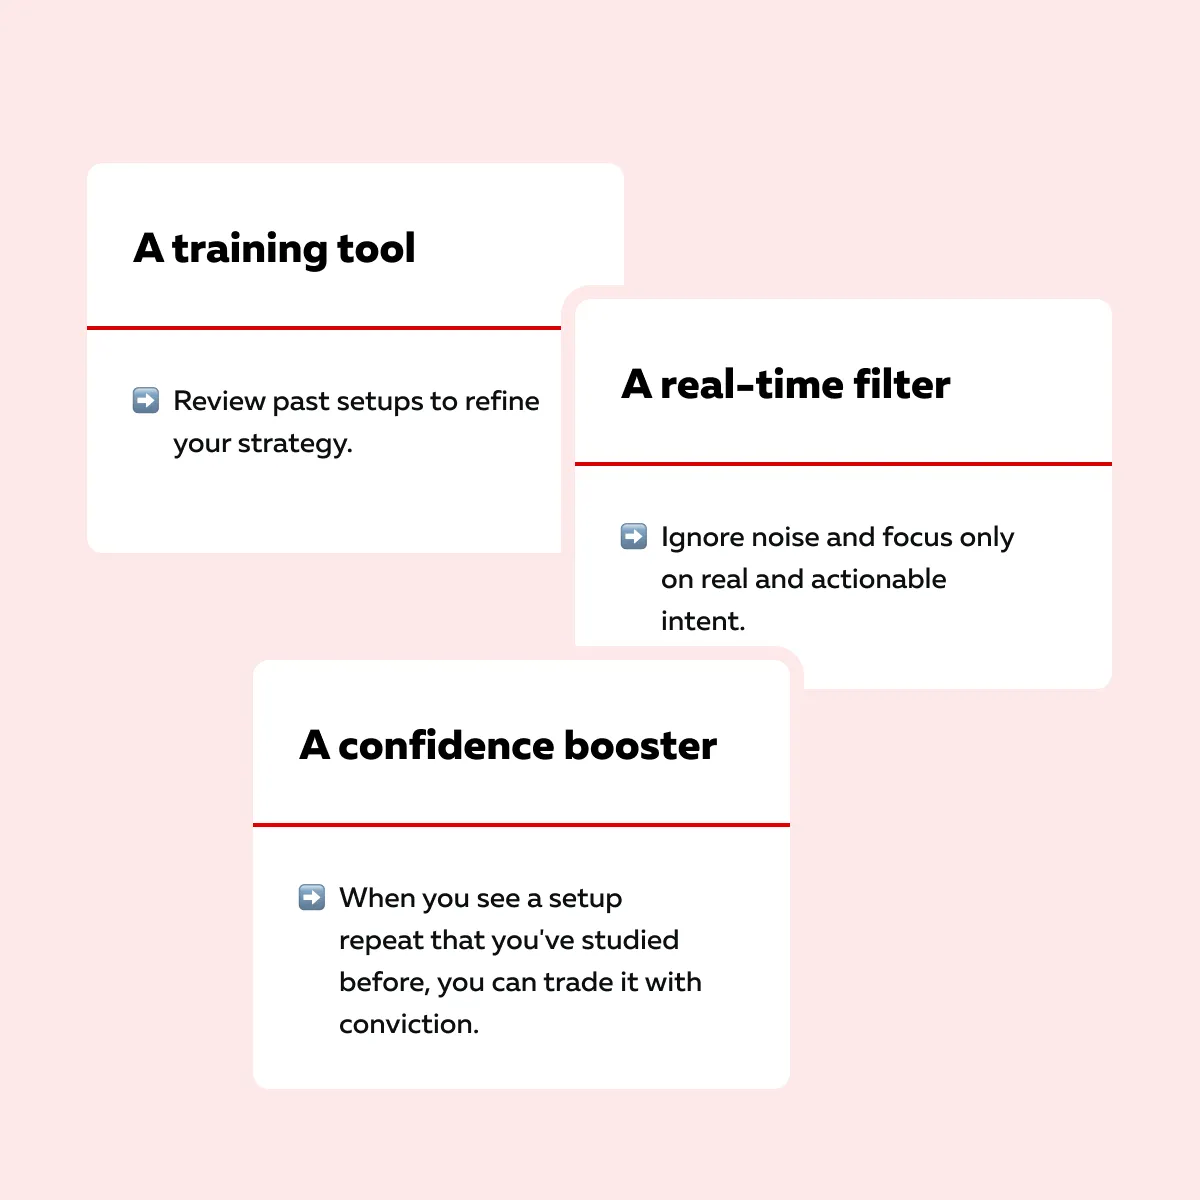
Please note that the real edge in order flow vs level 2 isn’t just more information! It’s a better context. With Bookmap, you’re not just reacting:
- You’re learning,
- You’re filtering, and
- You’re anticipating based on historical order flow behavior.
That kind of insight is what separates guessing from precision! It is what turns good traders into great ones.
Conclusion
Level II market data is a helpful starting point for traders. It shows where buyers and sellers intend to trade. However, it doesn’t show what actually happens! You can’t tell if those orders were real, filled, pulled, or just meant to deceive.
That’s where an advanced market analysis tool, like Bookmap, comes in! Bookmap takes raw order book trading data and adds real-time execution, volume, and a visual history of market behavior.
Using it, you can see if buyers really stepped in, if sellers absorbed the move, or if a wall was just spoofed. This information lets you spot traps, confirm real breakouts, and make better decisions based on structure and behavior (not just numbers flashing on a screen). Stop staring at static numbers. Bookmap shows the liquidity behind the moves.
FAQ
1. Is Level II order flow?
No, Level II only shows where orders are waiting in the market! It does not display whether they are real or get filled. Please note that it only shows intent and not action.
On the other hand, via order flow, you can see what’s actually happening, like:
- Who’s buying,
- Who’s selling, and
- How does price react to that.
2. Does Bookmap include Level II data?
Yes, Bookmap includes Level II data and shows it visually. Additionally, it also adds/ layers more information over it, such as:
- Trades that actually happen (volume dots),
- Hidden orders (icebergs), and
- A history of how the market moved.
It’s like Level II, but with a memory and more detail.
3. Why is historical context so important?
Through historical context, you can see:
- What happened before,
- Where big trades happened,
- How price reacted, and
- Where orders were placed or pulled.
This allows you to understand whether a move was real or fake. It gives you more confidence by letting you study how the market actually behaved.
4. Can I use Bookmap instead of DOM?
Yes, many traders switch from the traditional DOM to Bookmap. That’s because Bookmap shows everything DOM shows, plus extra information like:
- Trade flow,
- Real support/ resistance, and
- Hidden activity.
Everything is displayed in a clean visual format. This makes it easier to understand and get extra insight than the DOM alone.
Sign Up Now