See iceberg orders more clearly in real time.
Compare plans to access deeper market visibility for iceberg orders.
Trading Basics
October 29, 2025
SHARE
How to Read and Trade Iceberg Orders: Hidden Liquidity in Plain Sight

Not every large trade leaves a visible footprint. Some of the biggest market participants prefer to stay hidden, executing orders in small visible chunks to avoid alerting others to their true size. These are called iceberg orders, and the ability to visualize them on a chart provides traders with a powerful window into institutional behavior.
An iceberg order chart helps reveal where hidden liquidity is sitting, how it behaves under pressure, and what that means for short-term price movement. By learning how to identify and interpret these orders, traders can gain context that standard candlestick or volume charts simply can’t provide.
If you want access to tools that expose this kind of hidden market activity, compare the features available across Bookmap’s plans here.
What Is an Iceberg Order Chart
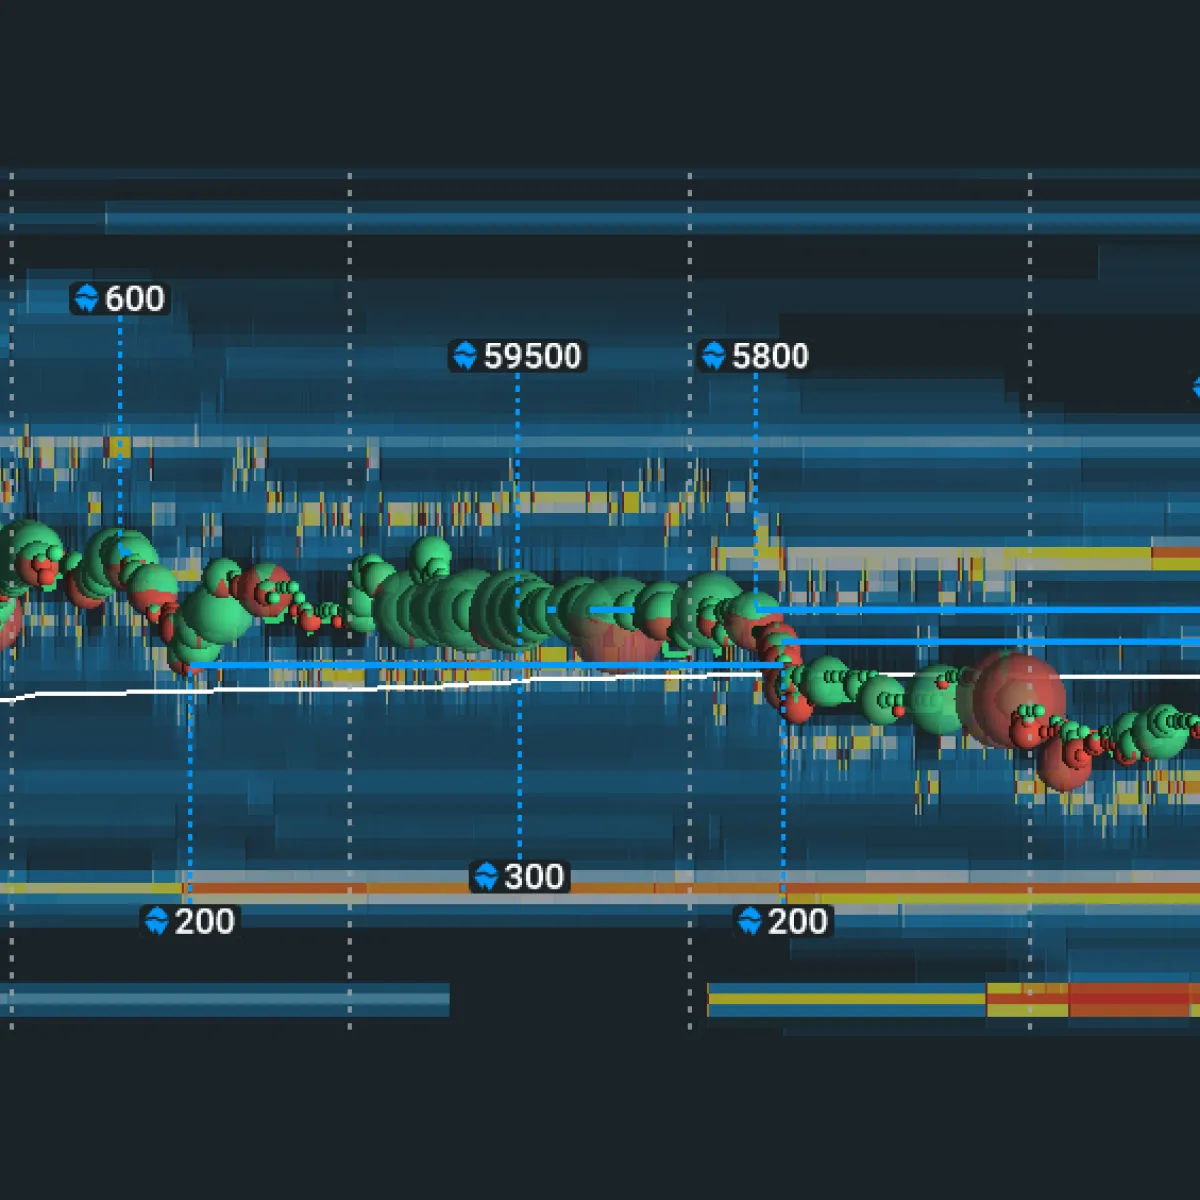
An iceberg order chart visualizes the activity of hidden orders within the market. Large players often don’t want to expose their full intent, so they break down a big position into smaller visible parts. As each visible portion fills, another piece automatically refreshes at the same price level.
This hidden behavior is almost invisible on traditional charts. However, Bookmap’s Stops & Icebergs Tracker detects the telltale pattern of repeated refills, showing exactly where and when the hidden liquidity appears. The result is a clear visual of where large participants are quietly accumulating or distributing size, often just before a market turns.
How to Identify Iceberg Orders on a Chart
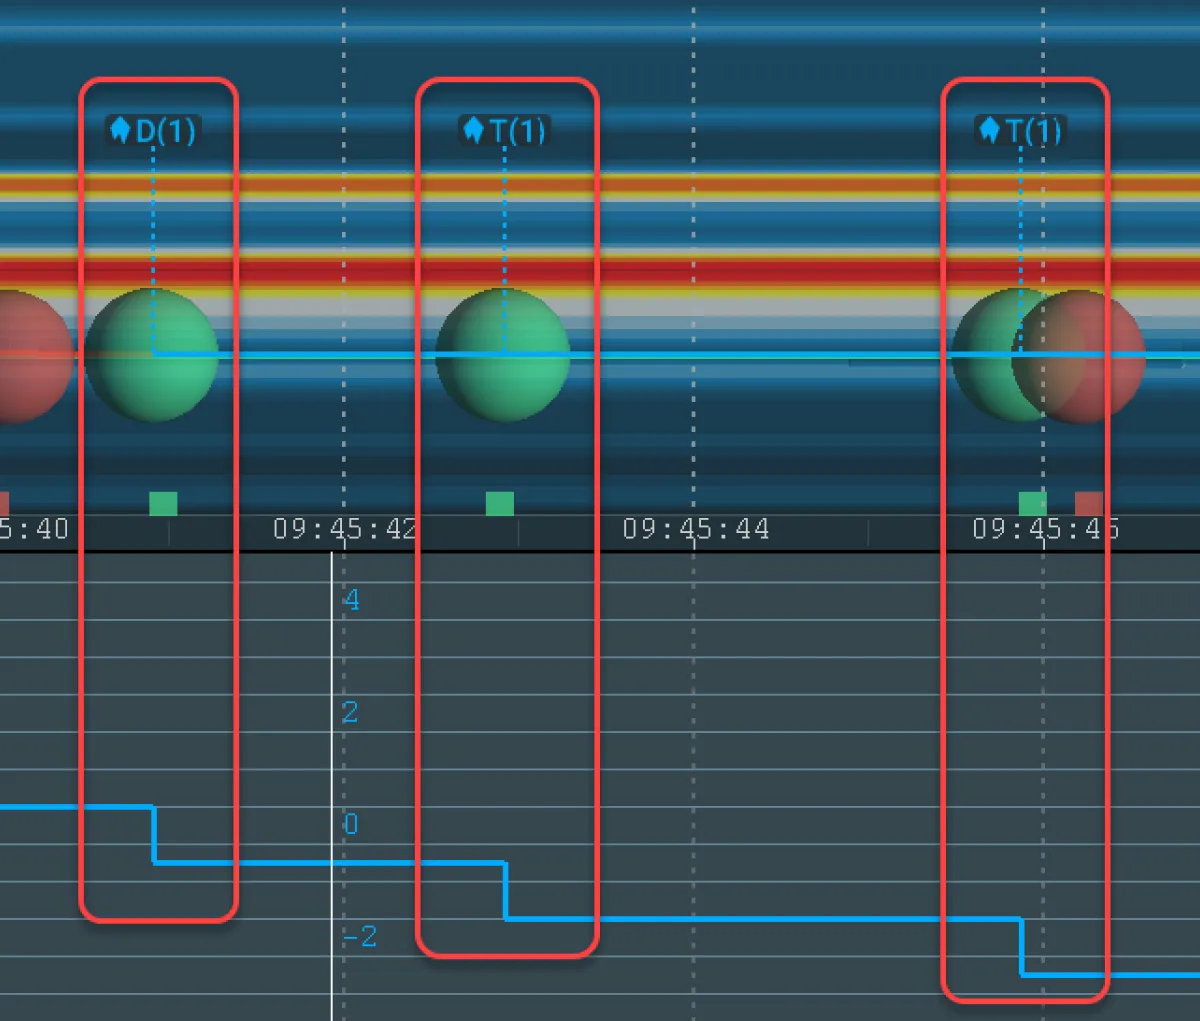
Spotting iceberg orders manually requires patience and access to order flow data. The key signs include:
- Reappearing liquidity: Visible size refreshes at the same level after partial execution.
- Repeated absorption: Aggressive buyers or sellers hit the same price but fail to push through.
- Stalled momentum: Price hesitates despite strong volume flow in one direction.
Bookmap simplifies this by visualizing iceberg detections directly on the chart. You can see hidden buy or sell activity layered over your heatmap, making it easy to spot absorption zones or large, stealthy traders protecting a level.
Why Iceberg Orders Matter
Hidden orders influence how price moves. When a large buyer is quietly absorbing selling pressure, the market may appear weak—until that hidden demand forces a reversal. Likewise, a persistent iceberg seller can cap rallies and create resistance even when buying pressure looks strong.
Recognizing iceberg orders helps traders:
- Identify true support and resistance levels.
- Anticipate potential reversals or continuation zones.
- Avoid false breakouts driven by temporary liquidity gaps.
Bookmap visualizes this interaction in real time, letting traders see how markets react to large hidden players instead of relying on post-trade analysis.
How to Trade Against Iceberg Orders

Trading against iceberg orders means understanding their intent. If an iceberg buyer keeps absorbing aggressive selling but price holds steady or begins to lift, it’s often a signal of strength. Traders can enter in the same direction, using the hidden order as confirmation.
Conversely, if an iceberg seller repeatedly absorbs buying pressure, it suggests hidden supply. In that case, short positions near that level—or exits from longs—may be justified.
To refine entries, combine iceberg detection with additional order flow context such as delta divergence, volume imbalance, or liquidity shifts. These confluences help confirm that the hidden player is actively defending their level.
See which packages include access to MBO add-ons on the Bookmap packages page.
Iceberg Orders vs Volume Profile Charts
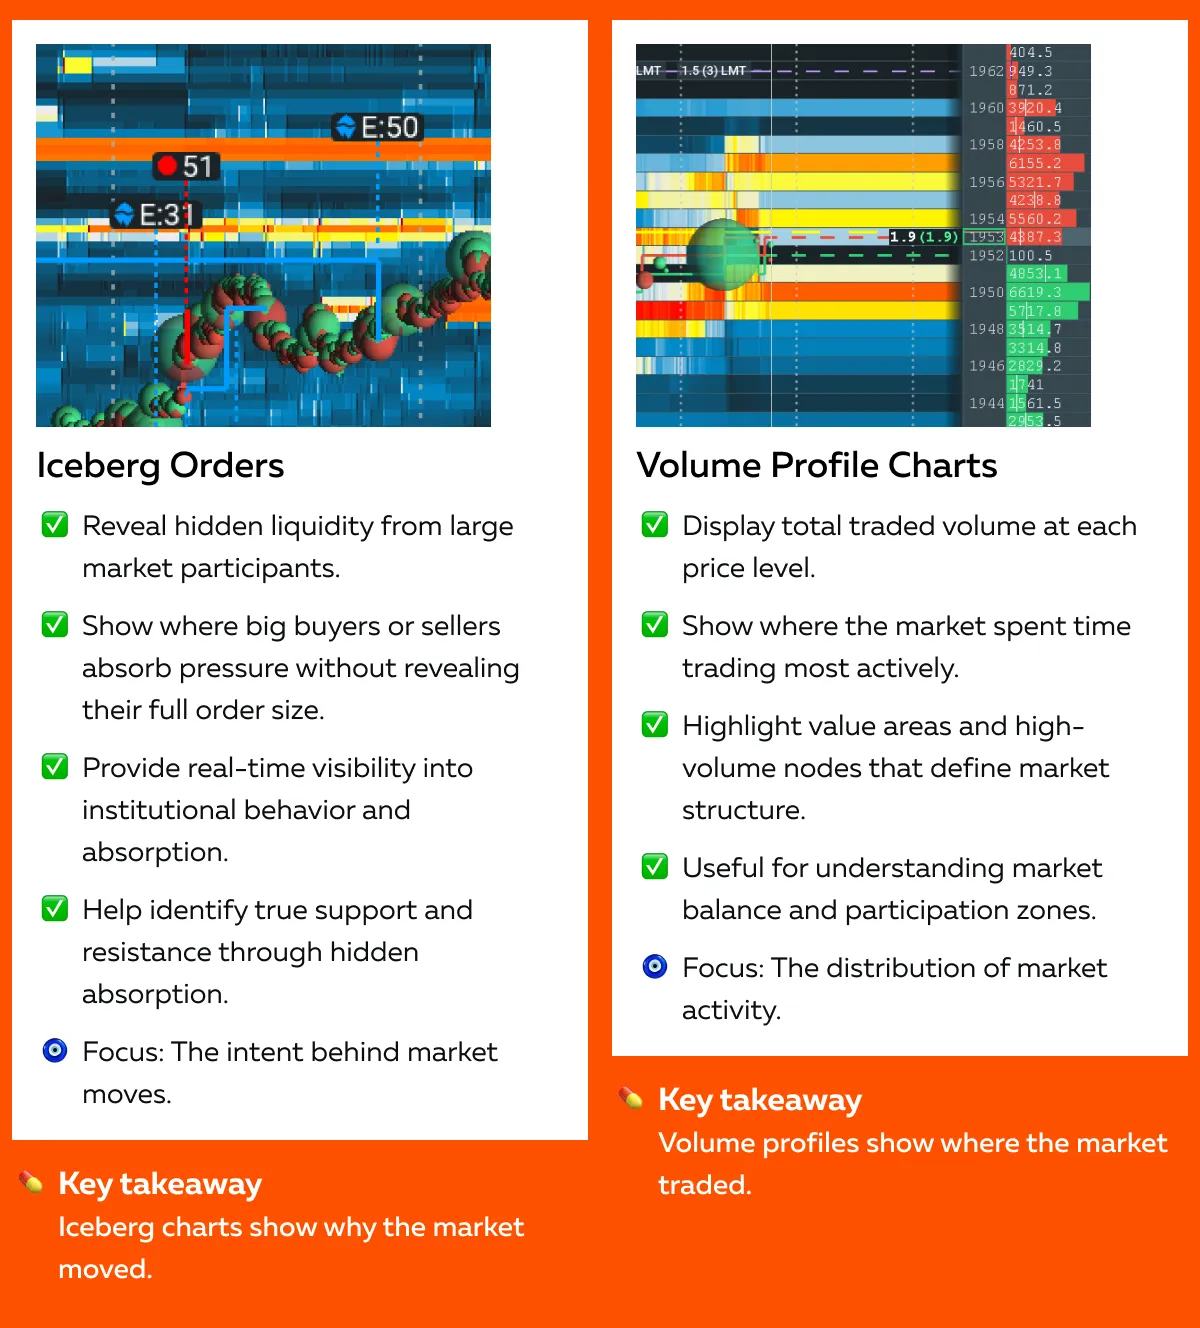
A volume profile chart displays total traded volume at each price level, showing where the market spent the most time. It helps identify high-volume nodes and value areas but doesn’t reveal who was trading or how much was hidden.
An iceberg chart, however, focuses on the intent behind the trades. It reveals where invisible size absorbed market pressure. Together, these tools give traders both macro (volume structure) and micro (hidden liquidity) perspectives on market behavior.
Using Iceberg Charts in Futures Trading
Futures markets are ideal for iceberg detection because every order passes through a centralized exchange. That means the order book reflects genuine activity, not fragmented liquidity across multiple venues.
In popular contracts such as the ES, NQ, or CL, iceberg orders often appear near key levels such as the previous day’s high or low, VWAP, or round numbers. When you spot hidden buy interest holding a level during a down move, it often precedes a short-term bounce. Likewise, repeated hidden selling at a swing high can foreshadow a pullback.
You can start exploring iceberg behavior in futures by comparing Bookmap’s available data packages here.
How to Use Iceberg Charts with Order Flow Software
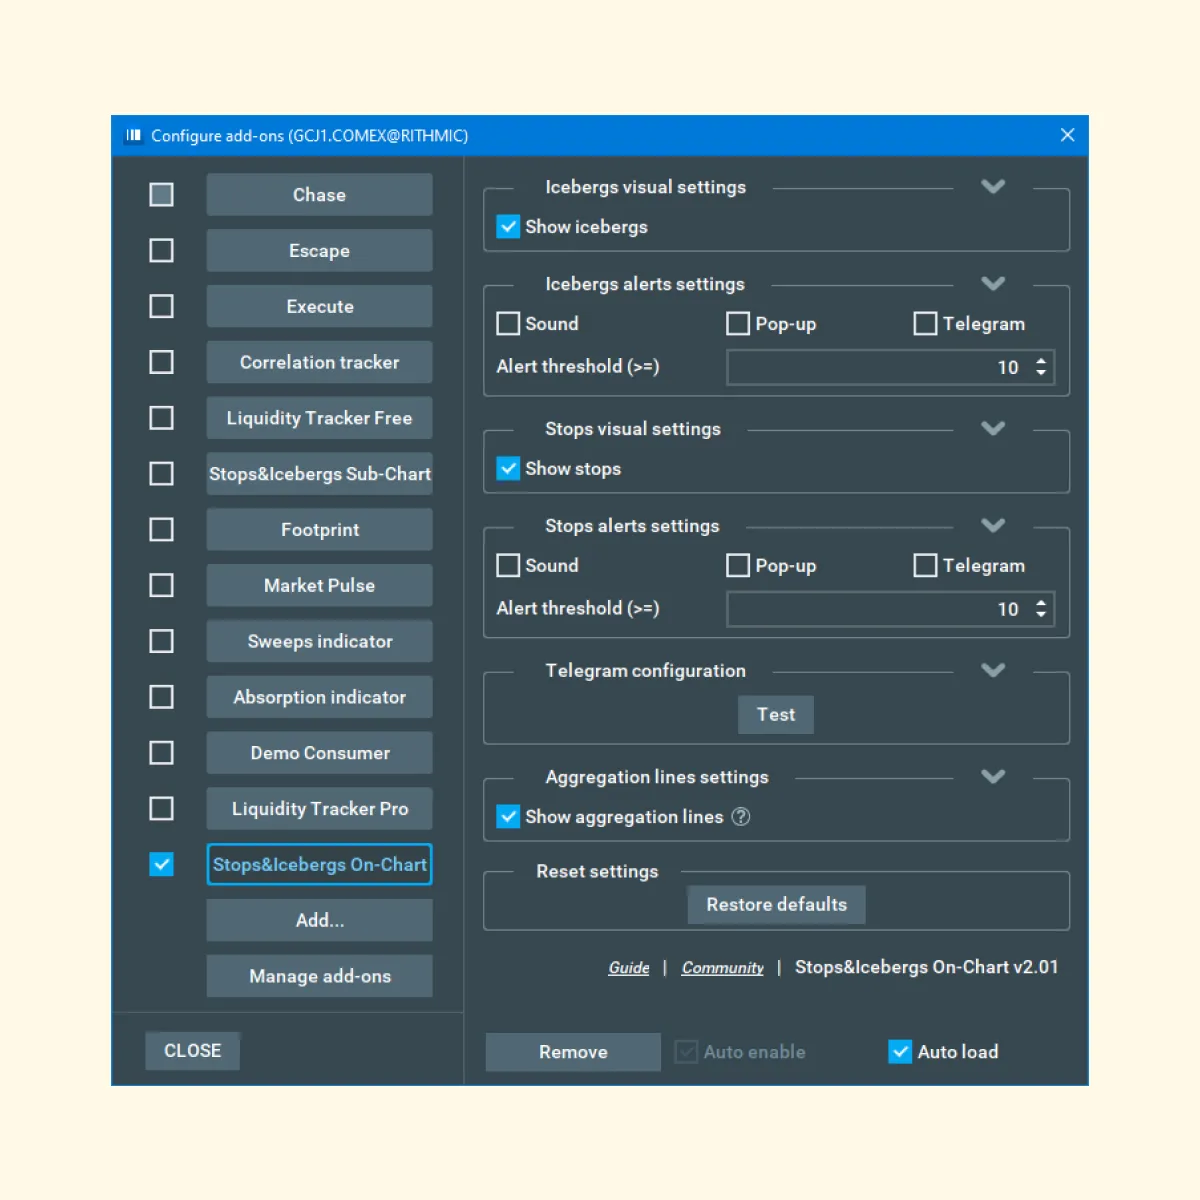
To make use of iceberg charts in Bookmap:
- Enable the Stops & Icebergs Tracker add-on.
- Observe the heatmap for zones where liquidity repeatedly reappears.
- Watch how price reacts when that level is tested.
- Confirm with volume delta or aggressive trade imbalance.
- Plan your entries or exits based on the absorption or exhaustion you see.
This process allows traders to anticipate reactions at hidden liquidity zones rather than reacting after price moves.
Reading Iceberg Charts to Predict Price Movement
Reading an iceberg chart is about context. When hidden liquidity absorbs aggressive pressure without price breaking, it signals strength. When price slices through iceberg layers quickly, it signals weakness or the completion of that hidden interest.
Over time, patterns emerge:
- Absorption leads to potential reversals.
- Exhaustion (when iceberg activity stops defending) often marks breakout continuation.
The key is to think of iceberg orders as invisible walls. Watching how price interacts with these walls provides insight into real-time market intent.
Common Misconceptions About Iceberg Orders
Many traders assume iceberg orders always cause reversals, but that’s not true. Sometimes they’re part of ongoing accumulation or distribution, and the market continues in the same direction afterward.
Others believe hidden orders are rare, yet they’re frequent in liquid markets. Institutional traders use them daily to minimize market impact. Recognizing their behavior takes practice, not guesswork, and that’s where a live, data-driven view like Bookmap’s becomes invaluable.
Conclusion
Iceberg orders reveal the hidden side of market activity. They show where large players are participating quietly and provide traders with context for why price behaves the way it does.
By combining iceberg detection with order flow visualization, traders can see where liquidity truly sits, not just where price has been. Whether trading futures, stocks, or crypto, recognizing hidden absorption and execution behavior is one of the most valuable skills in modern market analysis.
Ready to see hidden liquidity for yourself? Compare Bookmap plans and data packages here to find the right setup for your trading.
FAQ
What is an iceberg order in trading?
An iceberg order is a large order split into smaller visible parts to hide its full size. As each visible portion executes, another refreshes automatically until the total order is filled.
What is an iceberg chart?
An iceberg chart visualizes these hidden orders, showing where they repeatedly appear or absorb liquidity on the heatmap.
How can I identify iceberg orders on a chart?
Look for reappearing liquidity at the same price level, stalled momentum despite heavy trading, or repeated absorption patterns. Bookmap’s Stops & Icebergs add-on detects these automatically.
How do iceberg charts differ from volume profile charts?
Volume profiles show where volume occurred; iceberg charts show why—highlighting hidden intent behind the volume.
Are iceberg orders only used in futures trading?
No, they can exist in any centralized market with an order book, including stocks and crypto exchanges that support order-flow transparency.
What indicators work best for spotting iceberg orders?
Stops & Icebergs Tracker, Liquidity Tracker Pro, and Tradermap Pro together provide the clearest picture of hidden liquidity behavior.
How can traders use iceberg orders to improve entries?
Use iceberg zones as key reference points—buy near hidden bids showing absorption, or sell near hidden offers showing resistance. Combine these with delta or imbalance confirmation for stronger setups.
Where can I access iceberg detection tools?
Visit the Bookmap packages comparison page to see which plan is best for you includes access to the Stops & Icebergs Tracker, which can be purchased separately here: https://marketplace.bookmap.com/marketplace/product/7028.
Sign Up Now