See breakout more clearly in real time.
Compare plans to access deeper market visibility for breakout.
Education
July 8, 2025
SHARE
Breakout or Fakeout? The 3-Point Checklist for Confirmation

On a fine Monday morning, you are chasing a breakout! But, only to watch it reverse like a prank. Memories getting fresh? Remember, you’re not alone and you’re not unlucky, just uninformed! Your ideal approach should be to stop chasing noise and start reacting to what really moves the market. But how?
In this article, we will learn the art of spotting real breakouts vs fakeouts using order flow, volume, and liquidity behavior. You’ll learn how to confirm breakouts, spot trap setups, and avoid falling for moves designed to trigger stop-losses and lure in late buyers. Additionally, we will study real examples, decode aggressive intent, and show how smart money uses common breakout zones like VWAP, previous highs/lows, and round numbers to set traps.
Why Breakouts Fail: A Quick Primer
Please realize that most breakouts happen around popular price zones, such as:
- Previous highs/ lows,
- Round numbers, and
- Key indicators like VWAP.
These levels are like magnets and naturally grab attention! When the price comes close, traders start placing:
- Buy-stop orders (people wanting to buy if the price breaks higher)
and
- Stop-losses (traders closing losing short positions).
So when the price moves just above that level, it looks like a breakout. But here’s the trap! It’s not always a real breakout. Sometimes the move only happens to trigger those orders (due to the actions of breakout buyers). It does not happen because big buyers are actually entering with conviction!
Please note that these breakout buyers are usually small and late traders reacting to the move. They never put in large or committed orders. And smart traders or algorithms know this! They exploit this temporary buying and sell into it. This makes the price reverse quickly. That’s a fakeout!
The real problem?
People jump in as soon as the price breaks out. They do not check for:
- Strong volume,
- Supportive liquidity behind the move, and
- Continuation structure.
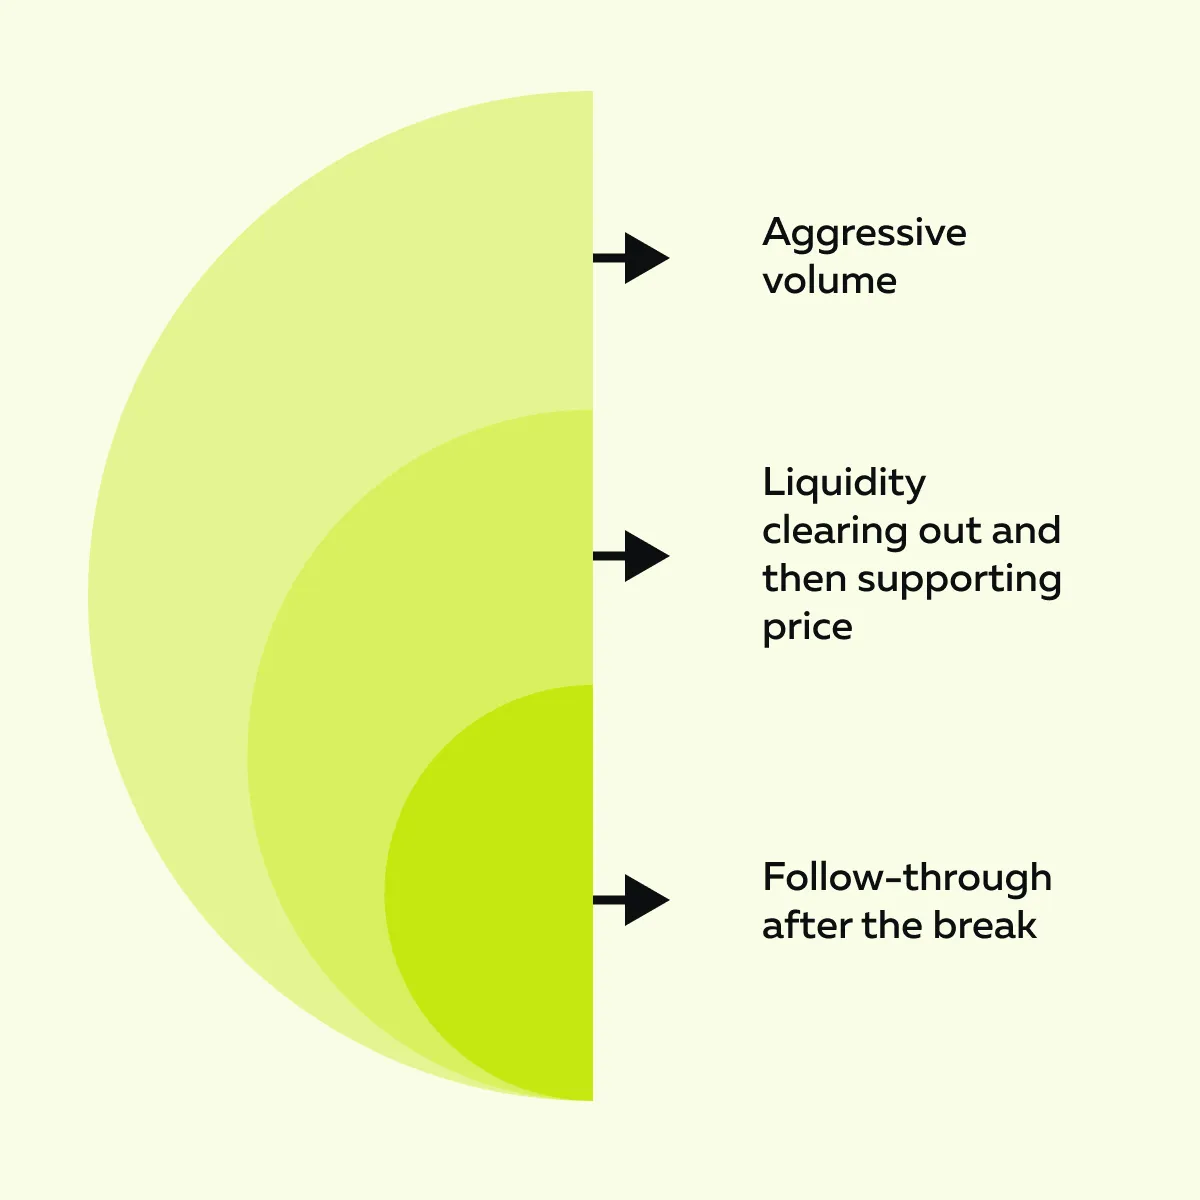
That’s why knowledge of breakout vs fakeout is highly important! Check out the graphic below to learn the characteristics of a real breakout:
As a smart trader, you can avoid false breakout traps by waiting to confirm the breakout. This can be easily done by analysing:
- Order flow
and
- Volume spikes.
Always remember, Patience = edge!
The 3-Point Checklist for Breakout Confirmation
Before jumping into any breakout trade, you must check if the move is real (or just noise). Please note that many traders get trapped in fakeouts because they skip confirmation.
This checklist will help you avoid false breakout traps and trade with more confidence:
1. Real Aggression Through the Level (Not Just Price Touch)
A true breakout isn’t just about price going:
- Above a resistance
or
- Below a support level.
Instead, it is about intent! These are the two signals that show real aggression:
| Signal I | Signal II |
or
|
|
How to catch these signals? On our advanced market analysis tool, Bookmap, you can look for big green or red dots right at the level. These dots represent high-volume trades (signs of real interest).
On Bookmap, during a breakout:
- The bid-ask spread tightens,
- This shows indecision.
- Later, it suddenly expands in the direction of the breakout,
- This shows momentum.
This is where trading breakouts with order flow gives you an edge! Order flow shows you the aggression behind the move, not just the candles on your chart.
The Red flag
If the price only tags the level or slightly moves through it with weak volume, that’s a classic fakeout! This first point allows you to confirm a breakout based on behavior (not just price).
Breakouts are easy to chase. Confirm them instead—explore how Bookmap shows the volume and liquidity behind the move.
2. Liquidity Behavior Confirms the Move
When a breakout is real, it’s not just price moving! Instead, it’s liquidity shifting to support the move. As a trader, you must learn how liquidity behaves before, during, and after the breakout. This understanding lets you:
- Confirm the breakout
and
- Avoid falling for a fakeout.
These are the three things you must look for (in an upside scenario):
| A) Before the breakout | B) During the breakout | C) After the breakout |
|
or
|
|
Where to watch these behaviors? You can observe them on our avant-garde market analysis tool, Bookmap. Learn how through the graphic below:
3. Continuation Volume and Price Structure
The final way to confirm a breakout is to watch what happens after the breakout. Does the move continue with strength, or does it fall apart? This is where price structure and volume give you your clearest signal.
In a strong, genuine breakout, you’ll often see the following:
- Consolidation above the breakout level. It is a pause that shows the market is accepting the new price, not rejecting it.
- Patterns like bull flags or tight consolidation zones form. These are healthy pauses that build energy for the next leg up.
- Volume remains strong or even increases as the price holds above the breakout level (not just during the breakout candle, but in the follow-through).
This kind of behavior shows that the breakout has support behind the move!
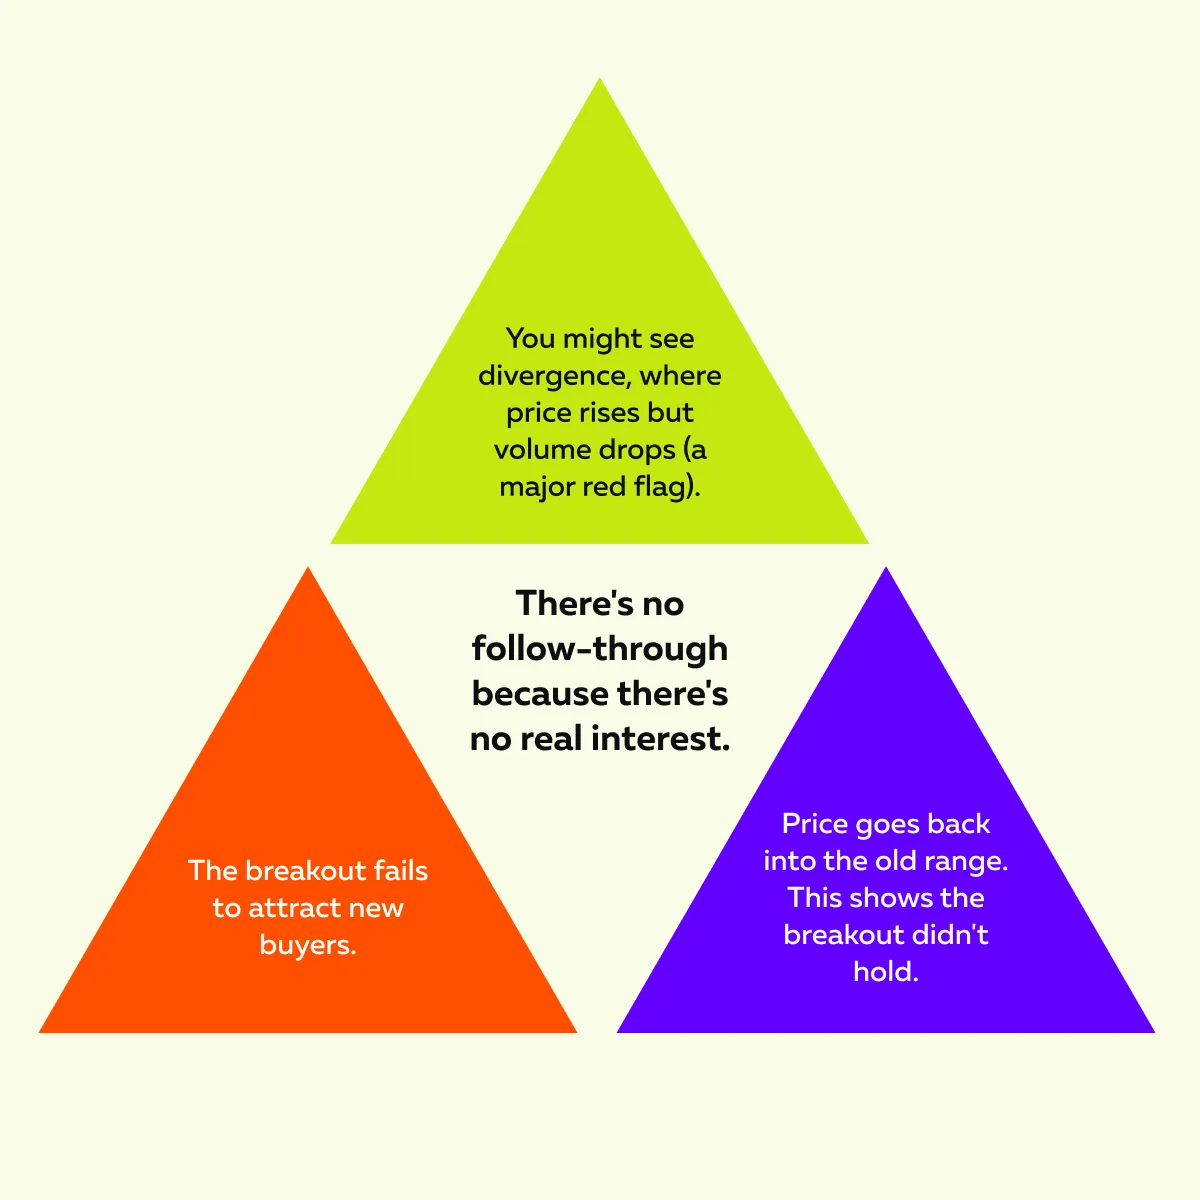
For a better understanding, let’s compare that to a fakeout:
In a fakeout, you will observe the following:
This step is your final filter when trading breakouts with order flow. If the structure looks weak and the volume fades, you should either:
- Stay out
or
- Take quick profits before the move collapses.
By doing so, you can avoid getting caught in false breakout traps and stay on the side of momentum.
Examples of Real vs. Fake Breakouts (No Hindsight Needed)
Want to evaluate breakout quality? You must use some real-time signals (not hindsight). With the right tools and checklist, you can:
- Confirm breakouts,
- Filter out the fakes, and
- Trade with more confidence and precision.
Let’s study two real trading scenarios (one real breakout and one fakeout). These scenarios will let you see the difference clearly in real-time (not just after the fact):
I) Real Breakout Example: ES Futures – Bullish Break With Confirmation

The instrument used is the E-mini S&P 500 (ES Futures).
Scenario
- Right after the market opened, the price stayed below the previous day’s high for about 20 minutes.
- This area became a key breakout level.
What happened
-
- Around 10:15 AM ET, ES began pushing up toward the previous high.
- You could see aggressive market buys (big green dots on Bookmap).
- This signals strong buyer interest.
- Later, ask-side liquidity started pulling.
- This means sellers at that level were stepping aside.
- Such a situation created a liquidity vacuum for the price to push through.
- Once the price broke the high, new stacked bids showed up just below the breakout level.
- This showed buyers were now:
-
- Supporting the move
and
- Defending the new support.
- Most importantly, no sell liquidity reloaded above the level.
- That’s because sellers weren’t stepping in to fight the breakout.
Result
- The breakout was confirmed by order flow and real liquidity behavior.
- Price rallied +10 points in just 15 minutes.
- There was smooth price action and strong follow-through (clear breakout with confirmation).
Key confirmations using Bookmap
- Aggressive volume led to the breakout.
- Liquidity stacked under the breakout level (clear support).
- No signs of hidden or iceberg sellers absorbing the move.
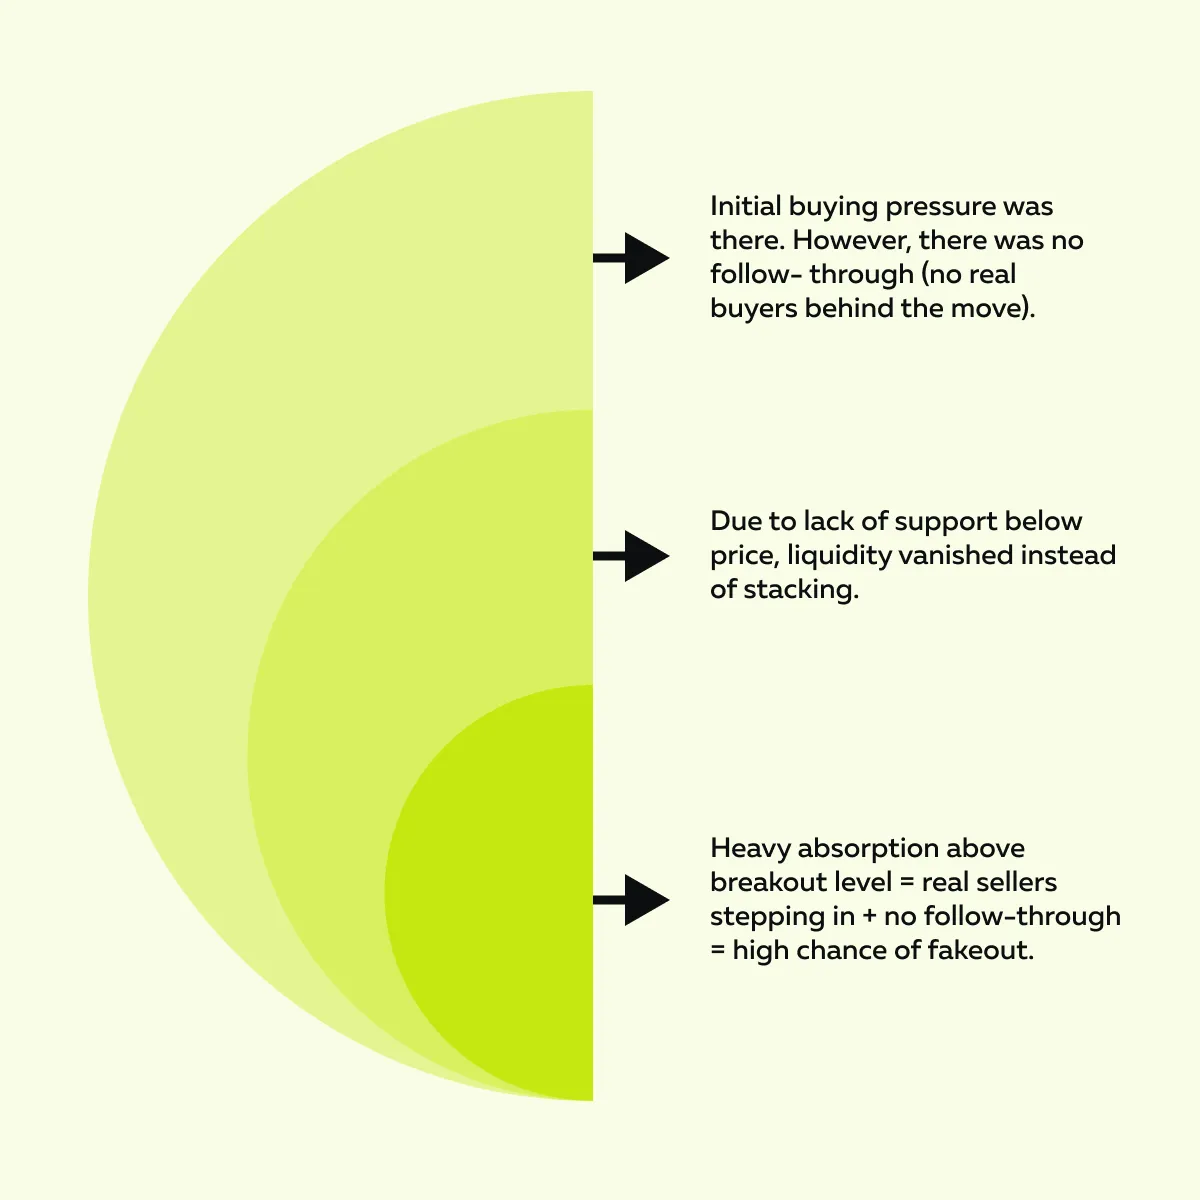
II) Fakeout Example: NVDA – Break of Premarket High With Absorption
The instrument used is NVIDIA stock (NVDA).
Scenario
- Price approached a well-defined premarket high at $884 within the first 10 minutes of the session.
What happened
- The price briefly popped above $884.
- There were a few large green dots.
- This shows initial buying aggression.
- But right after the break, there was no bid stacking.
- Liquidity below the price faded instead of supporting the move.
- Above $884, large sell orders kept reappearing (seen on Bookmap as strong red bands).
- This is a sign of absorption.
- It shows smart sellers are offloading into breakout buyers.
- However, the price couldn’t hold above $884 for more than 30 seconds.
- Then it reversed hard and dropped $6 almost instantly.
Want to be successful? These are the key failure signals you must observe:
Common Mistakes That Lead to Getting Trapped
Be aware that even experienced traders get caught in false breakout traps! Why? This does not happen because of the wrong setup, but because of their timing or execution being off.
Below are the most common mistakes that cause traders to chase fakeouts or miss signs of danger. Avoid these, and your breakout trades will improve significantly:
1. Entering on the First Tick Outside the Level
It’s tempting to buy (or short) when the price breaks a key level. But remember that the first tick is often a trap! This is where many traders fall into the breakout vs fakeout mistake.
If you jump in too early without waiting to confirm the breakout, you’re likely buying into:
- Stop hunts
or
- Weak momentum.
Instead, as a smart trader, you must wait for one of these two things:
| Check I | Check II |
|
|
This way, you’re not guessing! Instead, you’re reacting to evidence.
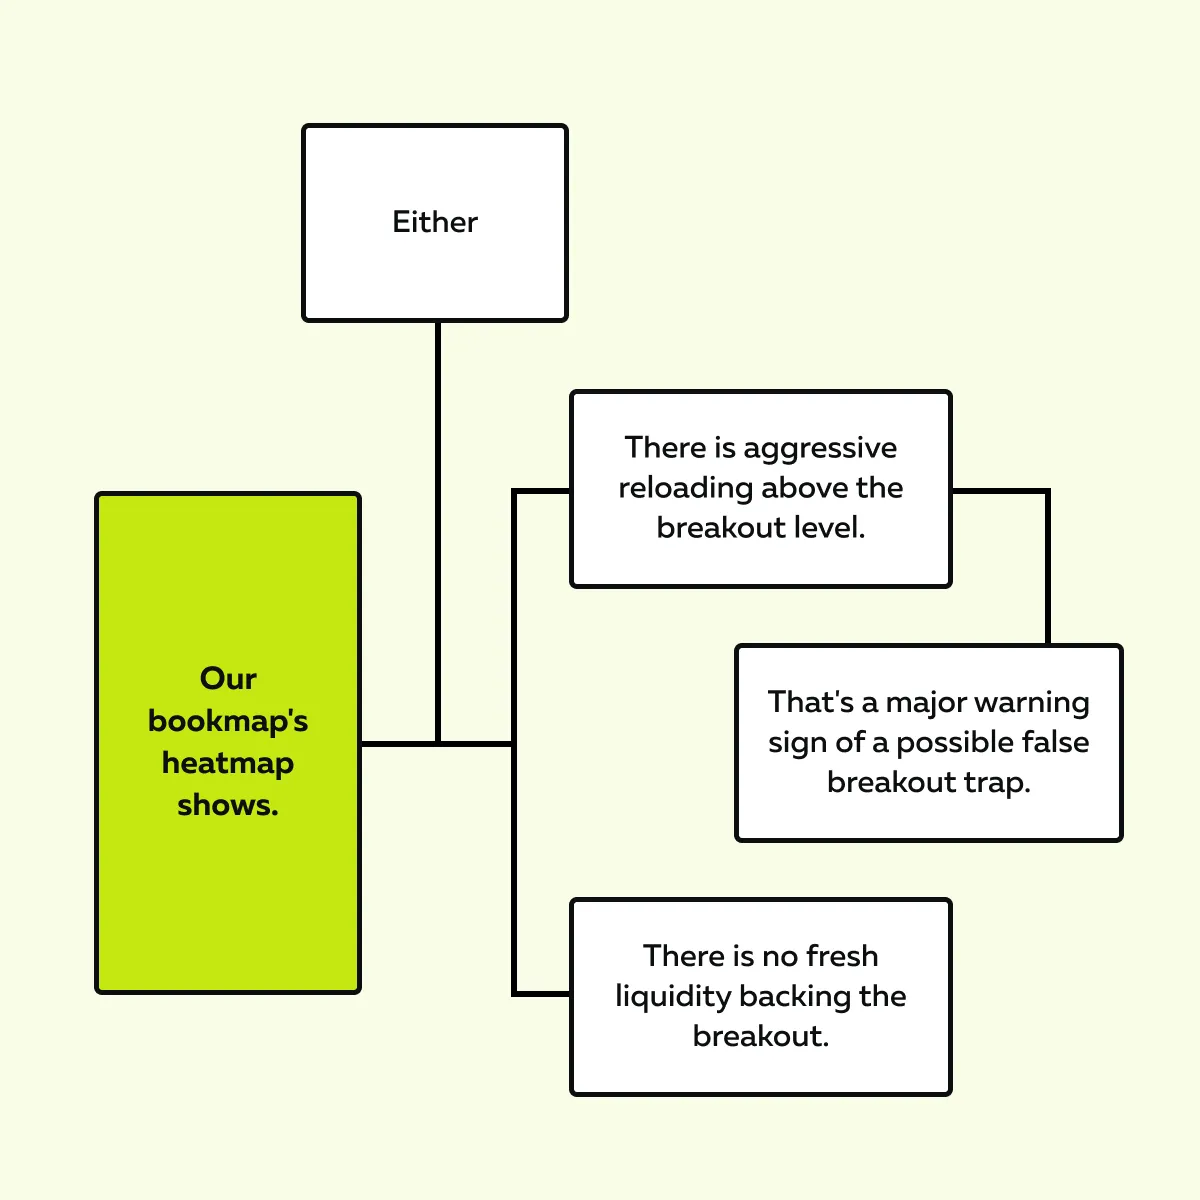
2. Ignoring Liquidity Reloading Against the Move
A huge red flag is when sell orders keep reappearing just above a breakout level (or buy orders below a breakdown). This is known as “liquidity reloading.” It usually means smart money is selling into breakout chasers (they are not letting the price get away).
You’ll often see this event on Bookmap as thick red bands. These bands:
- Don’t go away
or
- Quickly reload after being hit.
When you see this, instead of the breakout running clean, the price stalls or reverses. If you’re trading breakouts with order flow, this signal is a must-watch. It tells you that there’s still resistance, and the move might not have the strength to continue.
3. Not Scaling Out or Managing Risk
Even confirmed breakouts can fail. That’s because markets are dynamic, and unexpected reversals happen. That’s why risk management isn’t optional; it’s your safety net!
Follow this smart approach:
- Scale out of your position as the price moves in your favor.
- Use trailing stops once the structure builds (like a bull flag or higher low).
- Avoid going all-in or holding stubbornly “because it looked confirmed.”
This way, if the breakout fails, you don’t lose everything! And if it works, you’re still in the trade with profits locked in.
Conclusion
Want to spot real breakouts? Move beyond just recognizing chart patterns! Start reading the intent behind the move. That’s because price alone can trick you. But when you focus on aggression, liquidity behavior, and follow-through, you start to see the difference between genuine breakouts and fakeouts meant to trap traders.
By using our advanced market analysis tool, Bookmap, you get that edge. You’re no longer guessing! Instead, you’re reacting to what’s actually happening in the market (that too in real-time).
On Bookmap, you can watch how liquidity behaves. You can identify whether buyers or sellers are truly stepping in, and if the market supports the move after the break. Through these clues, you can confirm breakouts and avoid false breakout traps that catch so many traders.
See how to spot fakeouts before they trap you—watch a real-time example in our latest trading breakdown.
FAQ
1. What causes a breakout to fail?
A breakout usually fails when there aren’t enough real buyers or sellers to support the move. It may look strong at first, but it quickly reverses. This often happens because of:
- Stop hunts
or
- Fake moves.
Both techniques are initiated to trap traders.
2. What’s the best indicator for breakout confirmation?
The best tools to confirm a breakout are “order flow indicators,” such as:
- Volume profile,
- Market delta, and
- Bookmap’s heatmaps.
By using them, you can see if big traders are really behind the move and if the price is not just fluctuating temporarily.
3. Should I always wait for a retest?
Not always, but it’s safer! By waiting for a retest, you let the price:
- Break out,
- Come back to test the level again, and
- Then move with real support.
Additionally, through retesting, you can avoid entering during a fakeout.
4. Is this approach useful for crypto, futures, and stocks?
Yes, this works across all markets (crypto, stocks, futures) because breakouts in most markets work the same way. By watching order flow and liquidity, you can spot real moves, no matter what you’re trading!
Sign Up Now