Ready to see the market clearly?
Sign up now and make smarter trades today
Education
May 15, 2025
SHARE
How to Trade CPI-Driven Liquidity Shifts Using Order Flow
Every trader knows CPI days bring fireworks! But few truly understand what happens beneath the surface. Please realize it is not just about whether inflation is hot or cold. Instead, it is about how liquidity shifts, how institutional players reposition, and how order flow traps are set to catch unsuspecting traders.
Price may tell a story! However, order flow and liquidity behavior tell the truth during these times. Want to trade profitably during these days?
In this article, we will learn what makes CPI reaction trading so tricky and full of opportunity. You’ll also understand how to read our Bookmap’s liquidity heatmap, avoid common mistakes, and recognize the key moments when markets tip their hand. Read this article till the end to trade smartly during one of the most volatile events each month.
Why CPI Releases Matter for Order Flow Traders?
When the CPI report comes out, it’s not just about whether inflation went up or down. For order flow traders, what really matters is how liquidity behaves around that moment. Liquidity means the availability of buy and sell orders in the market. On CPI days, big players like institutions often shift their orders, which causes the liquidity to change.
Please note that big institutions like hedge funds and banks don’t just react after the CPI number comes out! Instead, they usually start repositioning aggressively before the release. Let’s learn how through the graphic below:
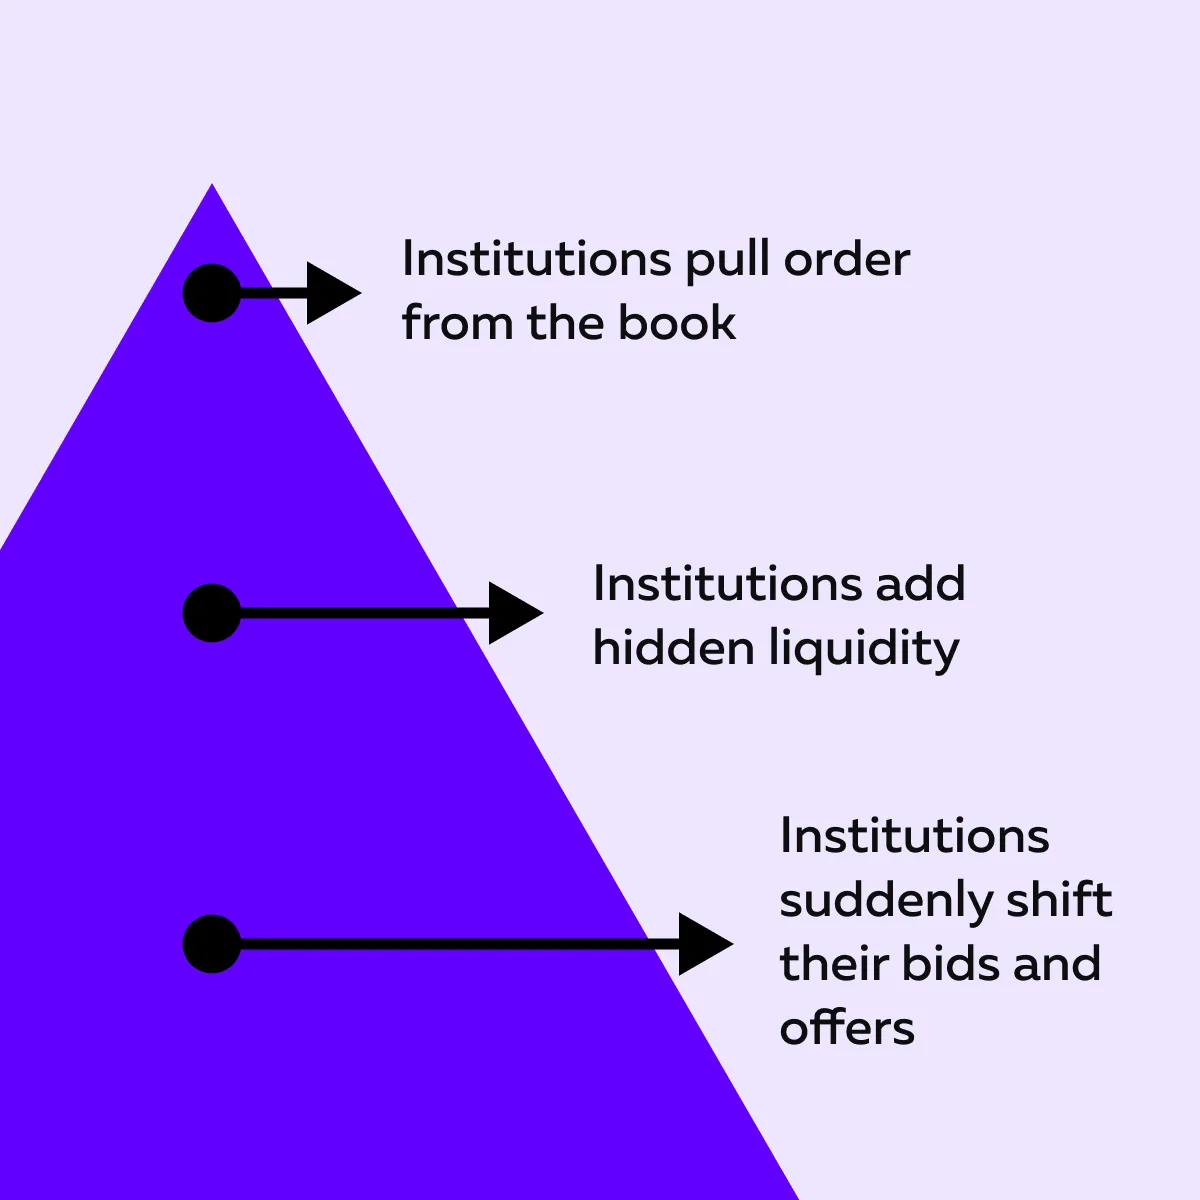
These actions cause a liquidity shift. You can clearly see this on our avant-garde real-time market analysis tool, Bookmap. You must also realize that these shifts are not random! Instead, they are signals that large players are:
- Adjusting their positions
and
- Trying to control the narrative around the price.
This type of behavior creates an “order flow trap.” Retail traders who react to the initial move (thinking it’s the “real” direction) usually get caught on the wrong side when institutions reverse the move or fade it quickly. These traps are more common when the CPI number is a surprise (either hotter or cooler than expected).
Now, such CPI surprises cause sharp price movements in futures like:
- The ES (S&P 500)
and
- NQ (Nasdaq-100).
Additionally, you will see volatility spikes in stocks of these sectors:
- Technology,
- Banking,
- Financials,
- Crypto markets, and
- Others that are sensitive to risk sentiment.
Learn to trade major economic events like a pro—visit the Bookmap Learning Center.
Why CPI Releases Cause Major Market Shifts?
Please understand that CPI data has a strong influence on how the market expects the Federal Reserve (Fed) to act. Let’s see how:
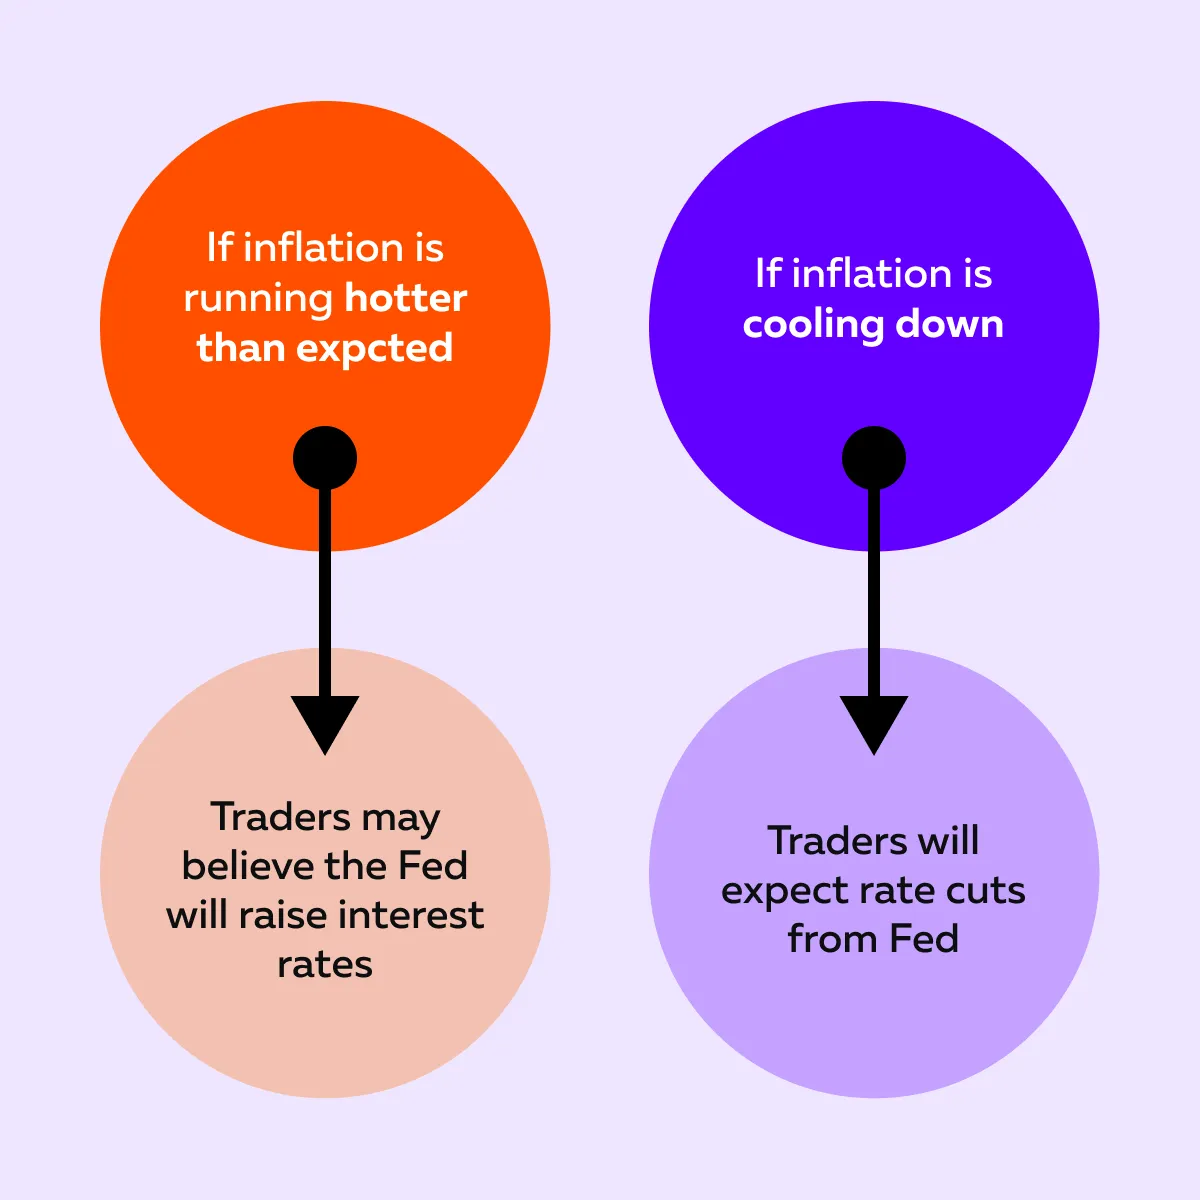
These changes in the expectations of traders are vital because they directly affect risk assets like:
- Stocks,
- Futures (especially ES and NQ), and
- Crypto.
Once the CPI numbers are released, market participants swiftly adjust their expectations. This causes sharp moves in price almost immediately. For example:
- Suppose CPI turns out higher than anticipated.
- Now, you might see a rapid sell-off in tech stocks or crypto.
- This happens because traders adjust to the idea of tighter monetary policy.
- If it comes in lower, there could be a rally.
The Impact on Liquidity
Now, please understand that these fast reactions also impact how liquidity behaves. Often, there is a sudden withdrawal of liquidity just before and after the release. That’s because big players pull their orders to avoid risk. Then, after the initial volatility settles, they start adding orders again. This creates a Bookmap liquidity shift. The visible order book changes quickly and dramatically.
Stay ahead of CPI volatility—track liquidity shifts instantly with Bookmap.
You Can Get Trapped
During these moments, order flow traps are common. For example:
- As a retail trader, you might chase a breakout right after the CPI drop.
- Consequently, you get stopped when the market reverses.
- This happens because institutional players re-enter at better prices.
These traps pose a significant risk for individuals who fail to monitor the deeper layers of liquidity and order flow.
Typical Liquidity Behavior Around CPI Releases
On CPI days, price moves are only part of the story! As an order flow trader, you must understand the behavior of liquidity. You must know how and where orders appear or disappear. This lets you see what’s really happening in the market.
Be aware that liquidity follows a predictable sequence around major CPI events. Using it, you can spot both risk and opportunity. Let’s understand this sequence in detail:
Liquidity Withdrawal Before the Release
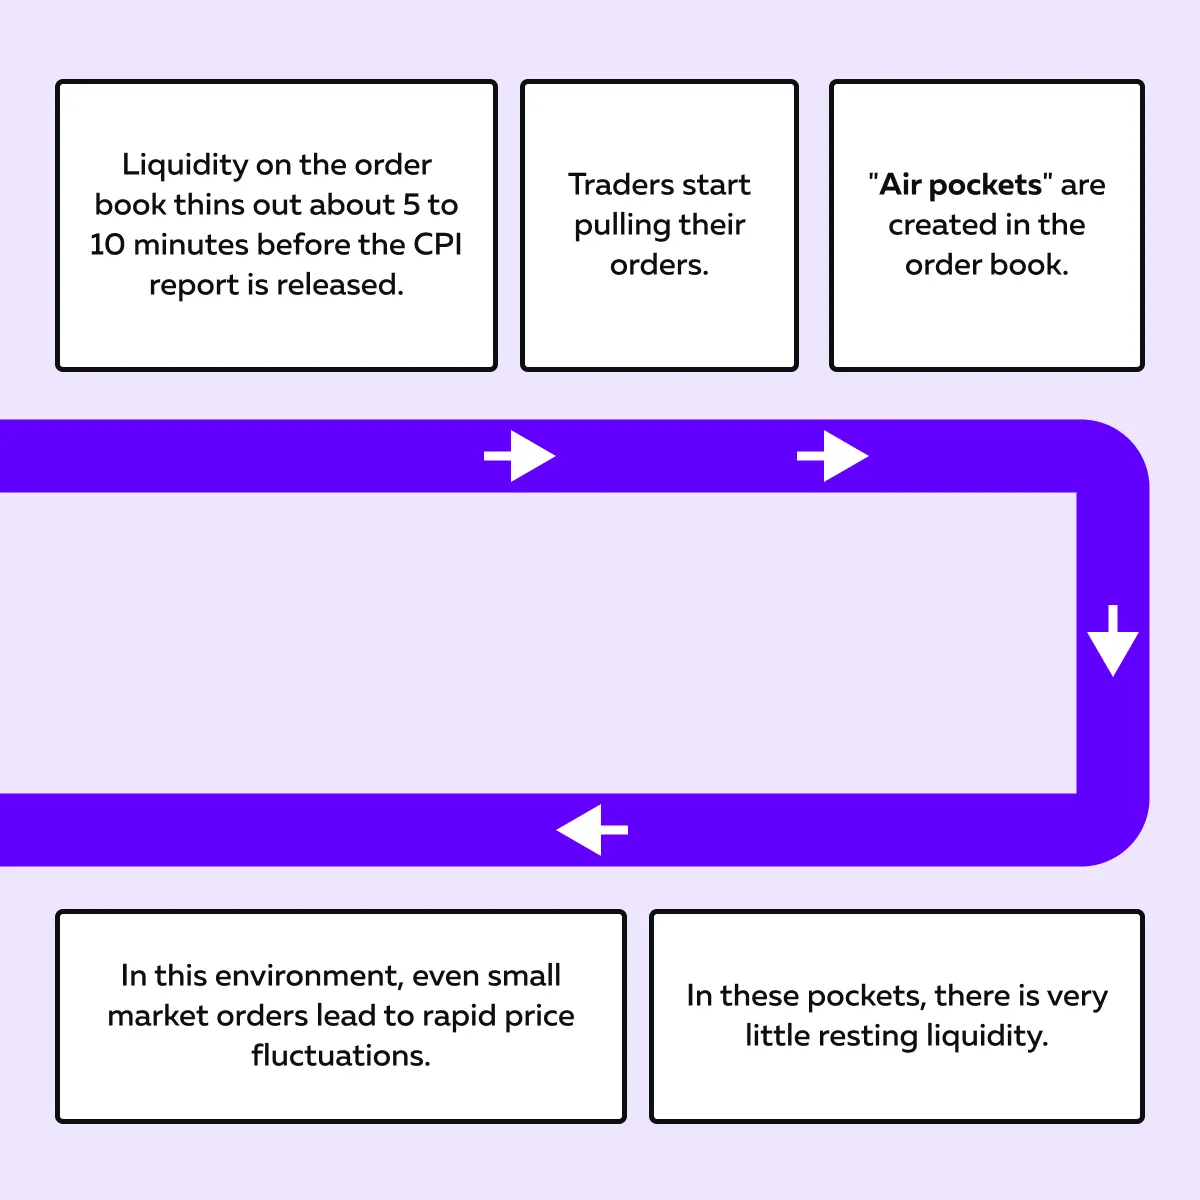
About 5 to 10 minutes before the CPI report, liquidity on the order book often thins out. Traders (particularly institutions) don’t want to get caught on the wrong side of a surprise move, so they start pulling their orders.
This creates “air pockets” in the book. In these pockets, there is very little resting liquidity. As a result, in this setting, even minor market orders can significantly affect prices. This happens because there is nothing to absorb the trade.
For more clarity, let’s visualize this through the graphic below:
Our avant-garde real-time market analysis tool, Bookmap, allows you to clearly observe the thinning out of heatmaps in real time.
Initial Whipsaw and False Breaks
Now, right after the CPI release, the price makes a quick and sharp move! However, this move is often a fakeout. This happens because many traders react instantly to the headline number. They do so just to get ahead of the market.
But, you must realize that the real liquidity is controlled by institutional players who are waiting to trap these early movers. At the right time, they set up an order flow trap. In this trap, retail traders get caught chasing the wrong direction.
This initial whipsaw makes CPI reaction trading highly challenging. If you do not watch where liquidity is actually sitting, you might get in too early or in the wrong direction.
Liquidity Reappearance and True Direction
After the first 1 to 5 minutes of chaos, liquidity starts coming back. Large participants re-enter the market. They either:
- Place bids below the price
or
- Set offers above it.
This reappearance gives clues about who is gaining control. Let’s learn how through the graphic below:
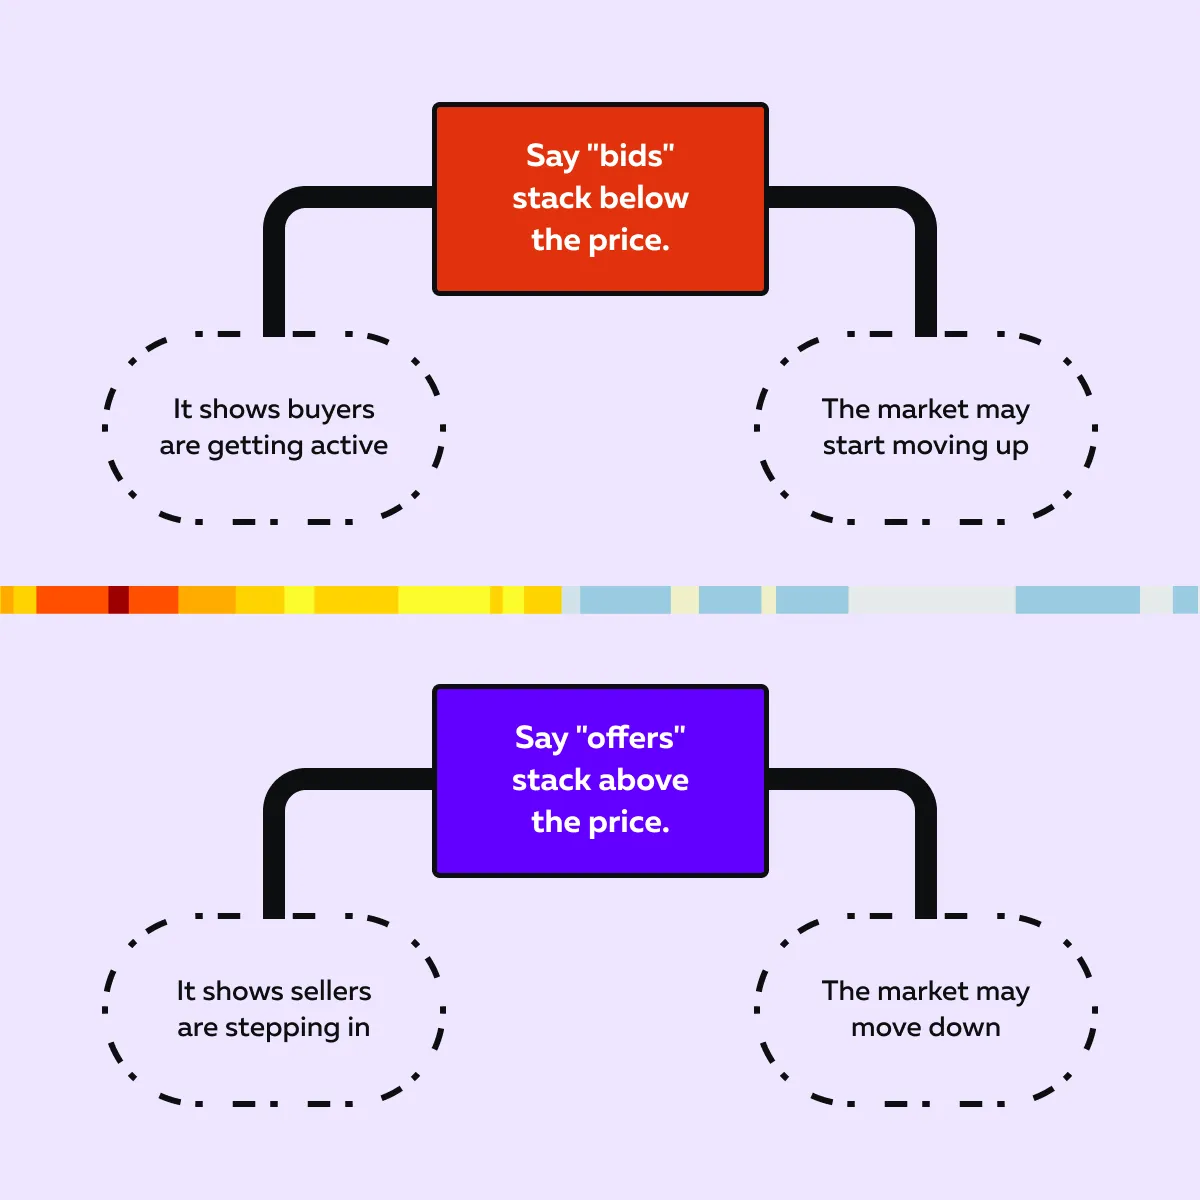
Please note that this is often the point where the real direction of the market begins after the CPI release. Thus, as a trader, you must track order flow using our advanced market analysis tool, Bookmap. This lets you avoid false moves and position for the real trend.
How to Trade CPI-Driven Liquidity Shifts Using Order Flow?
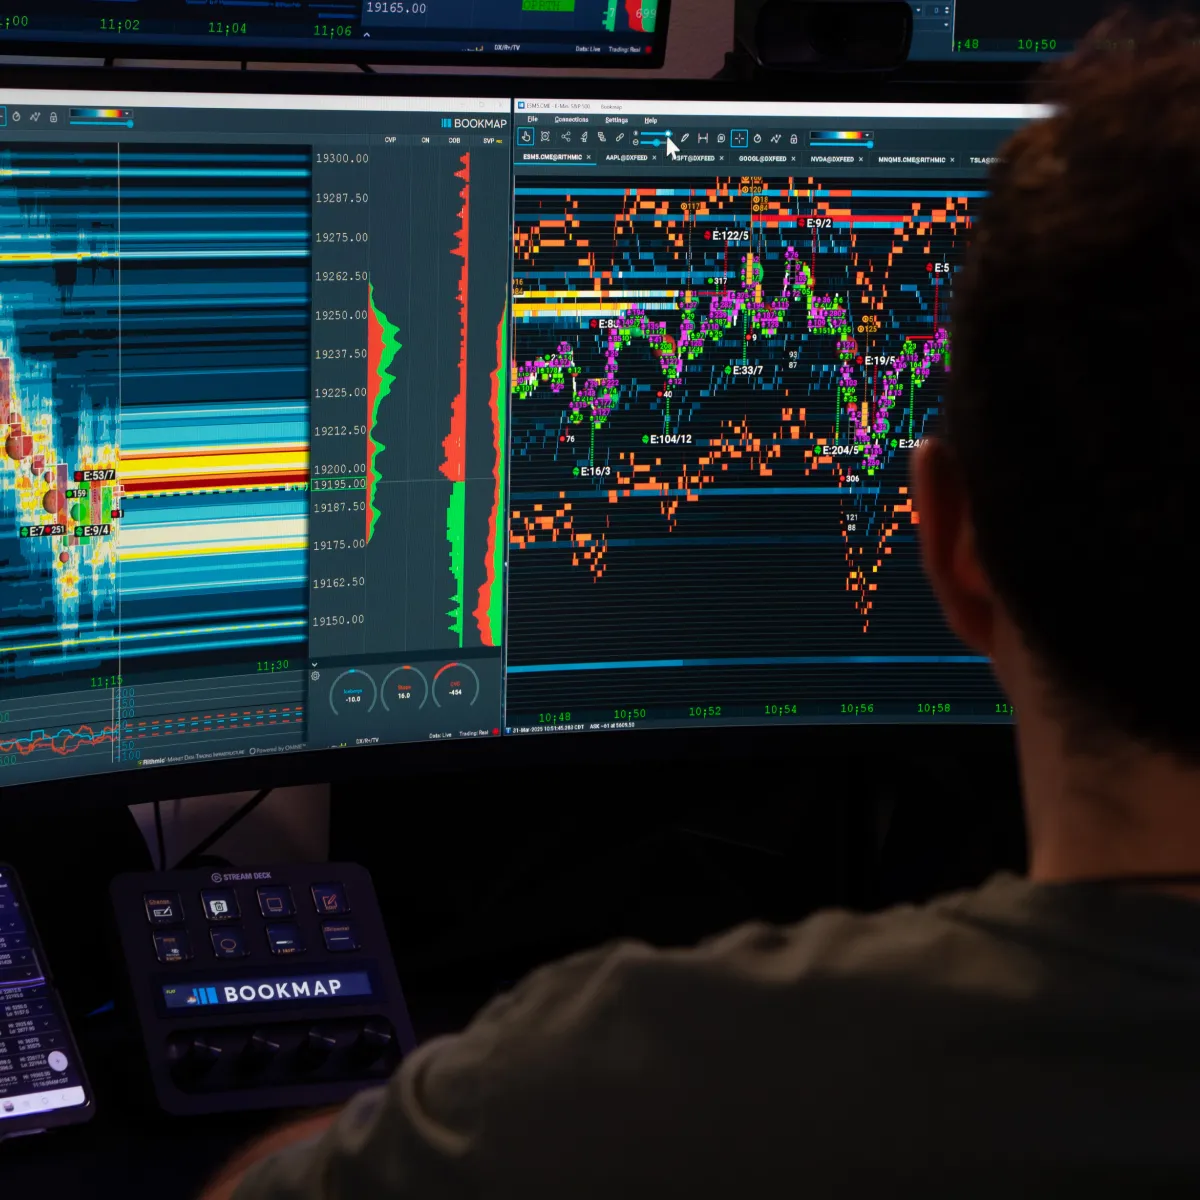
CPI days create unique market conditions. During these times:
- There are rapid price fluctuations
and
- Liquidity behaves differently.
Thus, as an order flow trader, you must be extra cautious and follow a clear process. Let’s learn in simple steps how you can watch liquidity shifts, avoid traps, and find better trade entries:
Step 1: Expect Thin Liquidity Pre-Release
Liquidity often disappears a few minutes before the CPI report is released. Many traders pull their orders from the book to avoid getting caught in sudden price swings.
If you try to enter a position during this time, you could face major slippage. Your order may fill at a much worse price than expected. Thus, try to stay flat before the release!
Step 2: Wait Out the First Reaction
Right after the CPI number hits the news, the market makes a sharp spike up or down. But this first move can be misleading. Many times, it’s an order flow trap. Let’s see what happens in this trap:
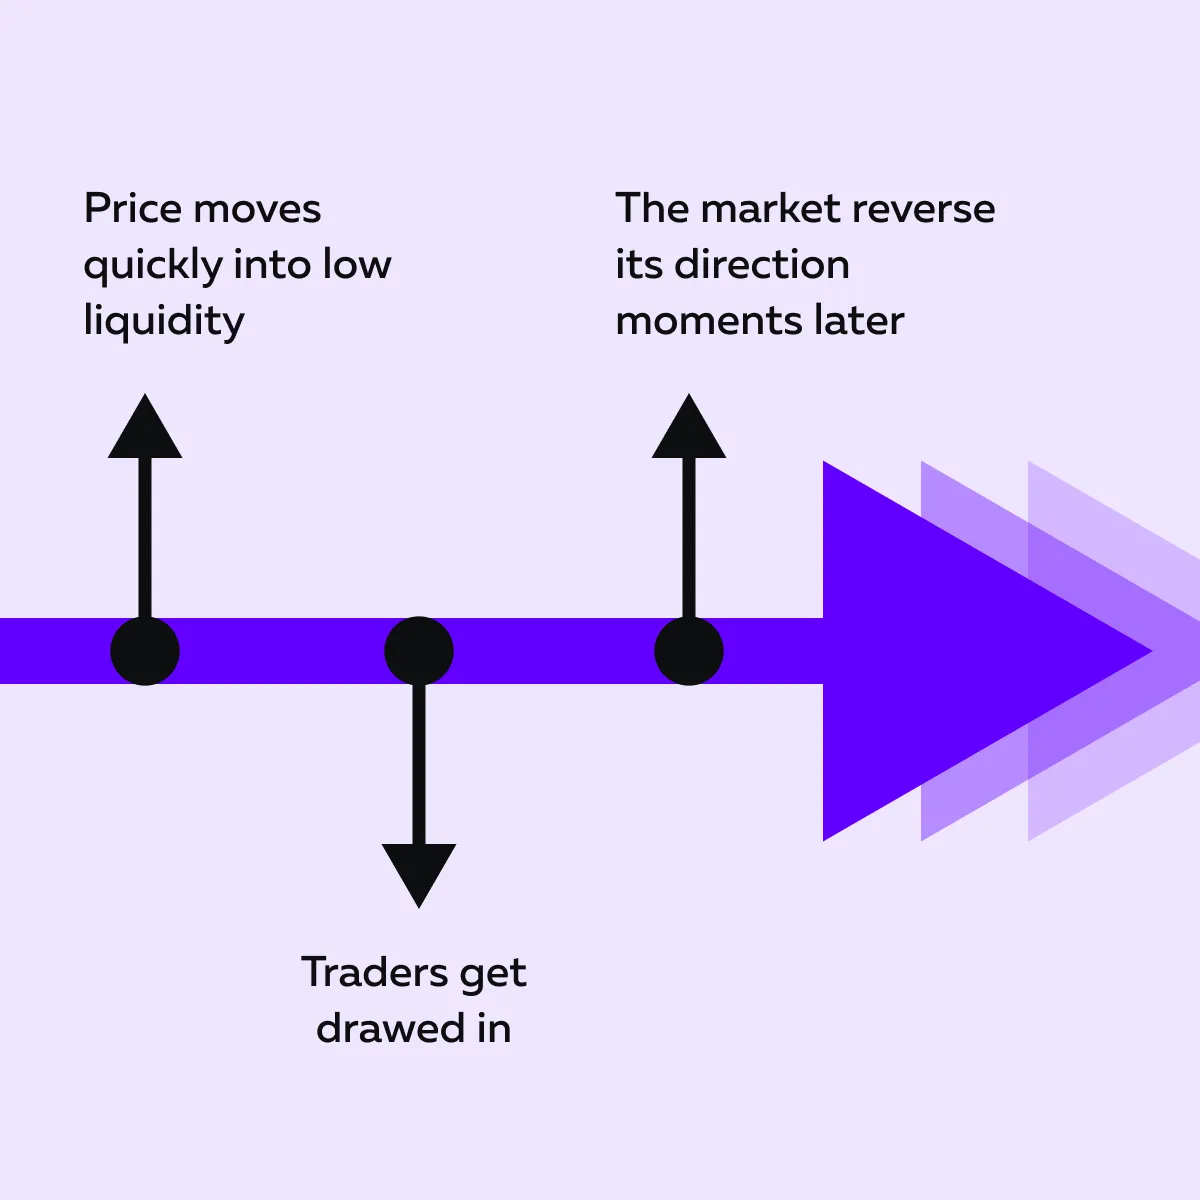
Be aware that institutions often use this move to force weak hands out of the market. If you jump in too fast, you risk being one of those trapped traders! Thus, it is always better to wait and let the initial reaction play out.
Step 3: Watch for Where Real Liquidity Rebuilds
Liquidity starts coming back in the first 1 to 5 minutes after the initial move, and this is where things get more reliable. In this phase, use our advanced market analysis tool, Bookmap, to watch where large orders (liquidity walls) start showing up.
- If you see bids stacking underneath the price, it suggests:
- Buyers are stepping in
and
- Bullish control is building.
- If you see offers stacking above, it suggests a bearish control.
This Bookmap liquidity shift is your clue to where real support or resistance may form.
Step 4: Enter After Confirmation
Now, once you’ve seen which side is controlling liquidity, wait for clear confirmation before entering a trade. You want to see how the price responds well to that liquidity:
- Holding support if the bids are strong
or
- Rejecting resistance if the offers are stacking.
Again, our Bookmap’s heatmap is useful here. It shows where large buy or sell orders are sitting and whether the price respects those levels.
Please note that patience is critical in this phase. Don’t rush in! Check out the graphic below to learn when the best time to enter is:
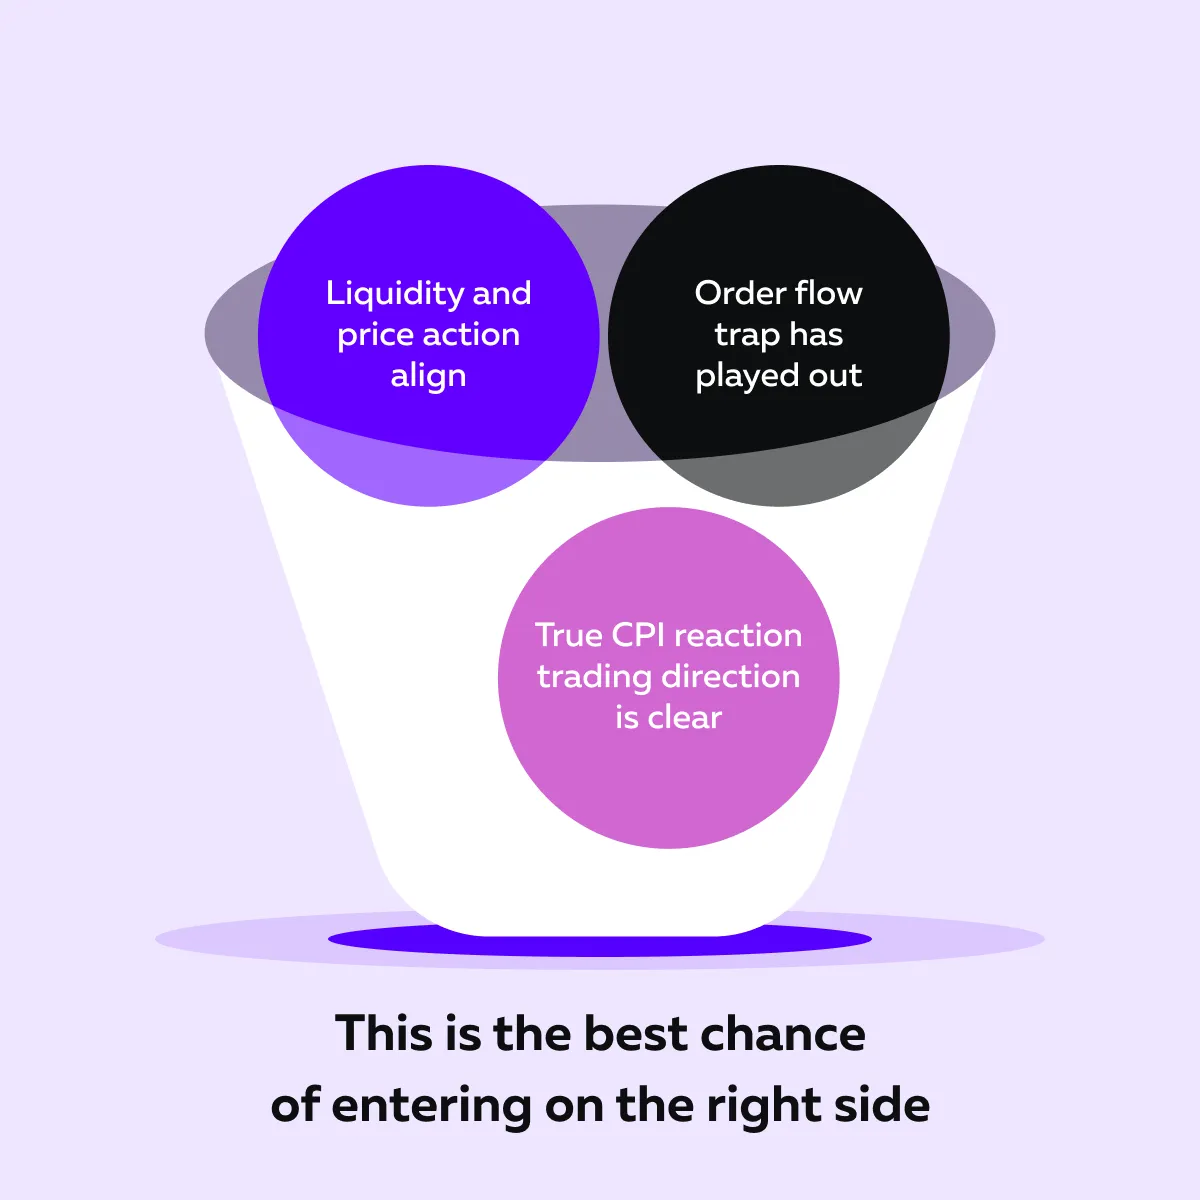
How Bookmap Helps Traders Navigate CPI Volatility?
On CPI days, price alone doesn’t tell the full story! What matters is who is behind the move and how liquidity behaves around key moments. This is where our avant-garde real-time market analysis tool, Bookmap, becomes a powerful tool for order flow traders.
Bookmap’s real-time heatmap shows:
- Where liquidity is positioned in the order book.
- Where buyers and sellers are actively placing their orders.
- Where are they pulling those orders?
Let’s see in detail how our advanced market analysis tool, Bookmap, can help you:
A) Use Our Bookmap’s Heatmap
When liquidity zones thin out just before the CPI release, you can see it clearly on the heatmap. These thinning zones are areas of risk. In these zones, prices can move quickly due to the lack of opposing orders.
B) Spot Absorption Points
More importantly, using our advanced market analysis tool, Bookmap, you can easily identify “absorption points.” These are levels where large orders absorb aggressive buying or selling (without letting the price move through). These are often hidden actions of institutional players.
If you’re watching Bookmap during a CPI event, you can see whether the price is:
- Truly breaking out
or
- Just being absorbed and likely to reverse.
C) Check Out Order Flow Traps Live
You can also see order flow traps happening live. For example:
- Say the price spikes upward after the release.
- Now, this triggers retail buying.
- However, assume that there is a strong wall of sell orders above.
- Also, volume fails to push through.
- Now, on our Bookmap, you can see that real sellers are stepping in.
- This is a likely trap, not a breakout.
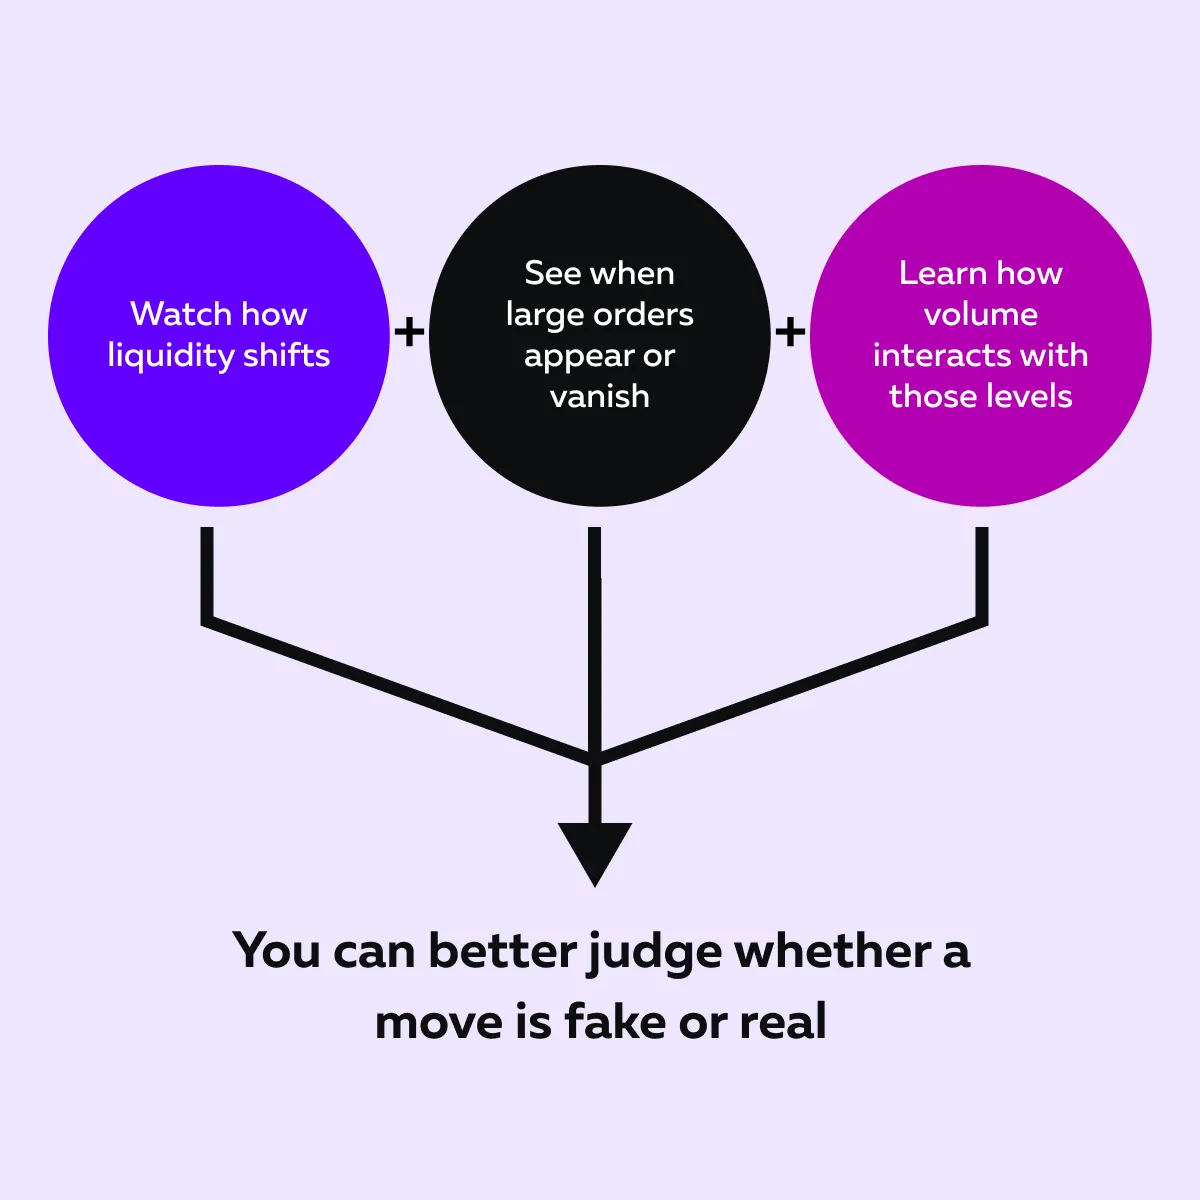
Please note that candlestick charts won’t show this detail. On them, you can only see where the price was, not why it moved. Check out the graphic below to learn how you can judge whether a move is fake or real:
This makes Bookmap especially valuable during CPI reaction trading.
Conclusion
When you trade around CPI releases, you can exploit several lucrative opportunities! However, it also comes with a high risk. Many traders get caught in sudden moves because they focus only on the price and not on what’s happening behind it.
Please realize that the key to successfully trading CPI events is understanding how liquidity and order flow behave before, during, and after the news. These shifts often lead to order flow traps that catch impatient traders off guard.
To avoid such traps, you can start using our modern real-time market analysis tool, Bookmap. It lets you see the whole picture! Using it, you can spot where liquidity is thinning, where big players are entering or exiting, and whether a move is real or likely to reverse.
By watching these details in real-time, you can also avoid fakeouts. Avoid getting trapped during CPI reactions—see real-time order flow with Bookmap.
FAQ
1. What is CPI reaction trading?
CPI reaction trading means trading right after the Consumer Price Index (CPI) report is released. This report often causes rapid price fluctuations. That’s because it affects how traders feel about inflation and interest rates.
Also, during such times, most traders look for shifts in liquidity right after the news to find short-term trading chances.
2. How does CPI affect order flow?
CPI releases cause sudden changes in the market! Usually, traders quickly adjust their positions. They do so by removing many orders from the book. This leads to:
- Low liquidity,
- Fast price changes, and
- Sharp jumps in trading volume.
Please note that these reactions are part of how the market adjusts to new inflation data.
3. What is an order flow trap during CPI events?
An order flow trap happens when the market strongly moves in one direction after CPI news. This makes traders think that’s the real move. However, big players often absorb that move and reverse the price. As a result, traders who chased the first move get stuck on the wrong side!
4. How can Bookmap help during CPI trading?
Our advanced real-time market analysis tool, Bookmap, shows where large buy or sell orders are placed or pulled during the CPI release. By using Bookmap’s heatmap and volume tools, you can clearly see when a move is strong or fake. This lets you avoid getting tricked by false breakouts.
