See market profile more clearly in real time.
Compare plans to access deeper market visibility for market profile.
Education
January 21, 2026
Updated
SHARE
Market Profile Trading: Understanding its Power and Impact

Table of Contents
- What is Market Profile Trading?
- The Three Building Blocks of Market Profile Trading
- Volume Profile vs. Market Profile
- Market Profile Trading Strategies
- How to Read a Market Profile Chart
- Auction Market Theory Trading Strategies
- Combining Market Profile with Order Flow
- Practical Applications of Market Profile Trading
- FAQ
Market Profile Trading is more than just another tool in financial analysis; it’s a game-changer. From a unique approach to understanding markets, it’s now a must-know for top traders.
In this guide, we’ll break down the essentials of Market Profile, explore how traders use it in real-world situations, and even see its power in action in the Blue Jacket competition. Ready to dive deep and level up your trading? Let’s get started.
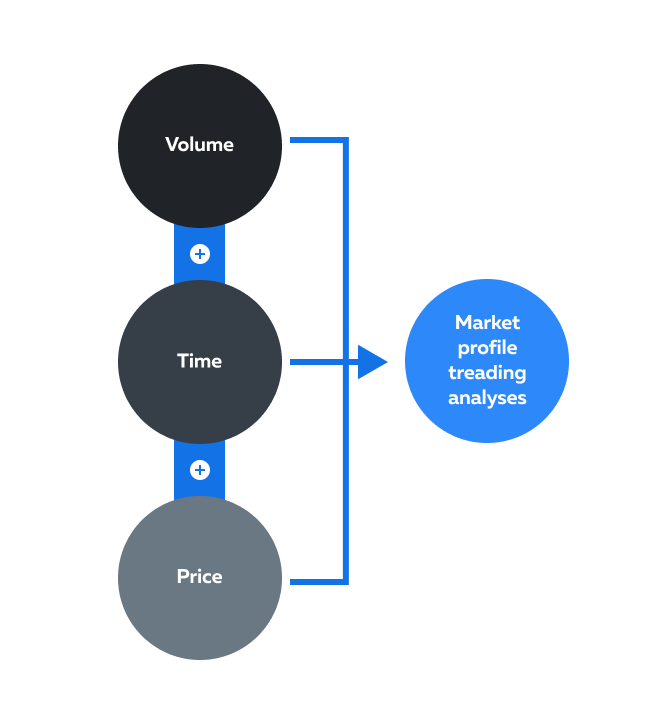
What is Market Profile Trading?
Market profile trading examines financial markets by offering a unique perspective on market behavior. It focuses on the relationship between price, volume, and time.
It provides traders and investors with insights into the market’s:
-
Structure
-
Price distribution, and
-
Trading activity happening over a specific period.
Developed by J. Peter Steidlmayer in the 1980s, Market profile trading has since gained popularity among both institutional and retail traders for its ability to offer a deeper understanding of market dynamics.
Market profile trading organizes price and volume data in a graphical format called a “market profile chart,” which displays the market’s price distribution over time. This chart helps traders identify areas of strong and weak demand, as well as potential price levels where significant trading activity is concentrated.
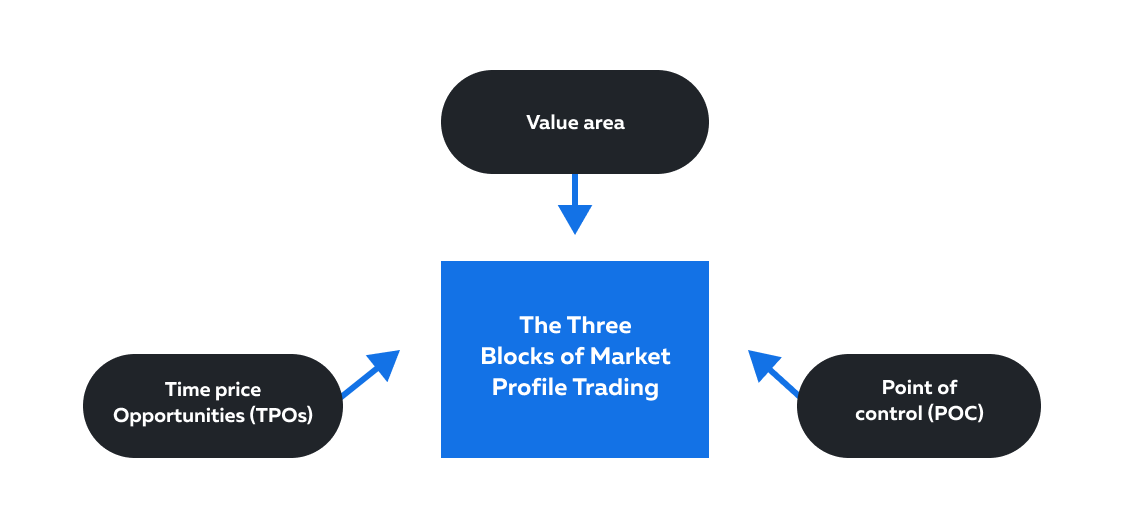
The Three Building Blocks of Market Profile Trading
Market profile trading is a methodology that focuses on three fundamental building blocks or elements, which are:
| The Element: | What does it represent? | Practical Use: | What insights do traders gain? |
| Time Price Opportunities (TPOs) | TPOs are vertical bars, or “brackets” that represent a specific price range traded during a given period. | A cluster of TPOs around a particular price level indicates that traders are actively participating and transacting at that level. | This information helps traders identify:
a) Potential support and resistance levels, b) Entry and exit points, and c) Areas of price consolidation
|
| Value Area | It represents the price range within which approximately 70% of the trading volume occurred during a specified period. | If the current price moves outside the Value Area, it signals a potential trend continuation or reversal. | This information helps traders to spot emerging trends. |
| Point of Control (POC) | The point of control refers to the price level at which the highest volume of trading activity occurred during a specific period. | Case 1: If the POC is located near a support or resistance level, it can serve as a confirmation of the level’s significance.
Case 2: If the market moves away from the POC, traders might anticipate a potential trend in the direction of the movement. |
Traders use the point of control trading to identify levels of equilibrium between buyers and sellers. |
Must Read: Traders often merge data from TPOs, Value Area, and POC for comprehensive insights. For instance, if TPOs highlight accumulation near a pivotal support level inside the Value Area, and the POC corroborates high activity at the same level, traders might see this as a robust support zone, favoring long trades.
TPO Chart Trading Methodology
Time Price Opportunity (TPO) charting is one of the core foundations of Market Profile Trading. Instead of focusing only on price movement, TPO methodology tracks how much time the market spends at different price levels throughout a session.
The idea behind this approach is that markets continuously search for fair value. When price spends more time at a level, it may indicate acceptance. When price quickly rejects a level, it may indicate imbalance or rejection.
Traders use TPO structures to better understand:
- market balance vs imbalance
- accepted value areas
- failed auctions
- trend continuation
- rotational market conditions
Time Price Opportunity Charting Guide
A Time Price Opportunity chart is typically built using session-based letters or blocks that represent specific time intervals. As the session develops, traders can see whether the market is building value in one area or exploring new prices.
Many traders focus on:
- Point of Control (POC)
- Value Area High (VAH)
- Value Area Low (VAL)
- opening range behavior
- single prints and excess areas
These references help traders structure directional and rotational trade ideas.
Market Profile Charting Tools and Indicators
Market Profile is a framework, but traders typically apply it through a charting tool or indicator that builds a Market Profile chart from session data. Depending on the platform, you may see it labeled as a Market Profile charting tool, a TPO profile indicator, or a Time Price Opportunity study.
The goal is the same: visualize where the market spent time (TPOs), where trading activity clustered (Value Area), and where the session found balance (Point of Control). When traders talk about the “best market profile indicator tool,” they’re usually looking for a solution that can:
- Build clean session profiles with consistent session definitions
- Display Value Area High/Low and POC clearly
- Show developing (in-progress) levels during the session
- Make it easy to compare multiple sessions without clutter
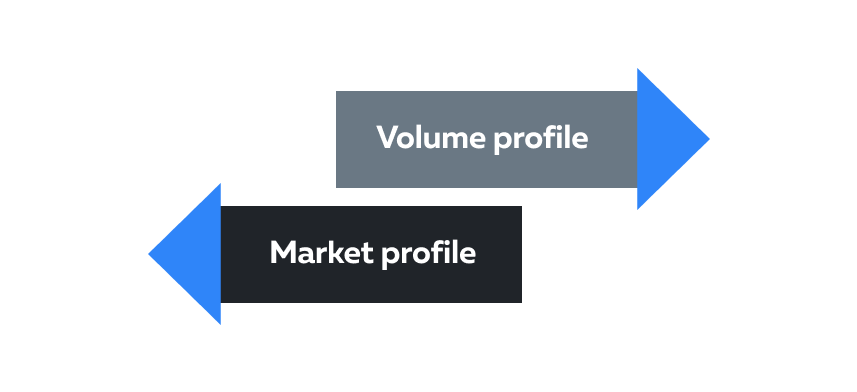
Volume Profile vs. Market Profile: Distinguishing the Two
Volume Profile and Market Profile, though often used interchangeably, have distinct methodologies in market analysis. Here’s a breakdown of both profiles:
-
Volume Profile:
- This approach focuses primarily on the vertical representation of trading volume at various price levels.
- It provides insights into areas of high and low trading activity and helps identify support and resistance levels.
- Volume Profile does not place as much emphasis on time-based analysis as Market Profile does.
-
Market Profile:
- Integrates both price and time, constructing TPOs to represent traded price ranges over specific intervals.
- Delivers a holistic understanding of market dynamics by mapping the relationship between price levels, volume, and time.
- Distinguishes itself through its time-centric approach, providing traders with a deeper insight into market structure.
For a clearer distinction, refer to the comparative table below:
|
Parameters |
Volume Profile |
Market Profile |
|
Focus |
Primarily on trading volume |
Focuses on price, time, and volume |
|
Representation |
Vertical histogram |
TPOs (vertical bars) |
|
Information |
Shows volume at specific price levels |
Depicts price ranges and time spent trading within those ranges |
|
Time Consideration |
Less emphasis on time |
Emphasizes time-based analysis |
|
Key Components |
Volume at price levels (PVP, VAH, VAL) |
TPOs, Value Area, Point of Control |
|
Interpretation |
Identifies areas of high/low trading activity |
Detects support/resistance levels, trend shifts, and gauges market sentiment |
|
Application |
Effective for spotting support/ resistance levels and potential breakout zones |
A comprehensive view of market dynamics, trend confirmation, and strategic trade setups |
Market Profile Trading Strategies
Market Profile Trading offers various strategies that cater to different market conditions, helping traders refine their decisions and improve outcomes. Here are some common strategies used by traders:
1. Value Area Trading
- Traders use the Value Area (where 70% of the trading volume occurs) to determine potential trading opportunities.
- Strategy: When the price re-enters the Value Area after breaking out, it often signals a potential reversal. Traders can use this information to plan long or short trades.
2. Support and Resistance Plays
- Identifying support and resistance levels from the Value Area boundaries or the Point of Control (POC) is a common strategy.
- Strategy: Traders might look for rejection at these levels, which could signal potential entry points with tight stop-losses.
3. Trend Following
- By observing the Value Area shifting higher or lower over time, traders can identify and confirm trends.
- Strategy: Enter trades in the direction of the trend, using the POC and TPO clusters for confirmation.
4. Breakout Trading
- Market Profile charts often reveal periods of consolidation followed by breakouts.
- Strategy: Traders monitor price action near the Value Area extremes. If the price breaks out and sustains above or below the extremes, it may signal a new trend.
By combining these strategies with other technical indicators, traders can increase their odds of success and better manage risks in dynamic market environments.
Auction Market Theory Trading Strategies
Auction Market Theory is the framework behind Market Profile Trading. The core idea is that markets constantly auction between buyers and sellers while searching for fair value.
From this perspective, price movement is not random. Instead, the market continuously tests higher and lower prices to determine where participation increases or decreases.
Traders apply auction market theory trading strategies to:
- identify acceptance vs rejection
- anticipate trend continuation
- recognize failed auctions
- detect imbalances in participation
- frame intraday market conditions
This framework is commonly used in futures markets, especially by intraday traders following ES and NQ session structure.
How to Trade Poor Highs and Lows in Market Profile
Poor highs and poor lows often signal unfinished auction activity. These formations occur when the market reaches an extreme but fails to reject it cleanly.
Many traders monitor poor highs and lows because:
- price may later revisit the level
- weak-handed participants may become trapped
- continuation or rejection setups can form around these areas
However, traders usually wait for confirmation rather than assuming immediate reversals. The market still needs to show acceptance or rejection behavior around the extreme.
Identifying Day Types in Market Profile Analysis
Day type analysis helps traders classify session behavior.
Common day types include:
- balanced rotational days
- trend days
- double distribution days
- neutral days
- normal variation days
Understanding day structure can help traders decide whether to favor breakout strategies, rotational trades, or fade setups near Value Area extremes.
How Does Market Profile Trading Guide Trading Decisions?
Market profile trading guides trading decisions by providing traders with valuable insights into market trends, risk management, and market sentiment. Here’s how traders use market profile to make informed choices:

-
-
Identifying Market Trends:
- Market Profile helps traders identify market trends by visually representing the distribution of trading activity and price levels.
- By observing the shape of the market profile chart, traders can interpret whether the market is in a trending phase, a consolidation phase, or a reversal.
-
- For example,
- In an up-trending market, the Value Area might be shifting higher, indicating higher demand and potential upward momentum.
- Conversely, a market profile with a wider range and more balanced distribution may indicate a consolidation phase.
-
-
-
Managing Risk:
- Market Profile aids in risk management by highlighting key support and resistance levels, as well as areas of high trading activity.
- Traders can use the value area and point of control to identify levels where the price is likely to find support or encounter resistance.
-
- This information can be crucial for setting stop-loss orders and profit targets.
-
-
-
Spot Market Sentiment:
- Market Profile provides insights into market sentiment by showing where most of the trading activity is concentrated.
-
- For example,
- If the point of control is positioned near the upper end of the Value Area, it suggests bullish sentiment.
- On the other hand, if the point of control is closer to the lower end of the Value Area, it may indicate bearish sentiment.
-
Additionally, observing the shape of the TPOs can also indicate whether the majority of traders are buying or selling at specific price levels, helping traders fine-tune their strategies based on prevailing market sentiments.
Trading Chart Layouts and Visualization Techniques
Market Profile is easiest to use when chart layouts are kept simple: price, the profile, and the key levels (POC/VAH/VAL). Many traders reduce indicator overload and use Market Profile as a market structure overlay rather than stacking multiple technical analysis indicators.
Because Market Profile is rooted in auction market theory, the goal is to visualize where the market accepted value and where it rejected price, then use those references for scenario planning and risk placement.
Market Profile Charts
A Market Profile Chart is the cornerstone of Market Profile Trading, visually representing the distribution of trading activity across price and time. Understanding its components is essential for leveraging its full potential.
Key Features of Market Profile Charts:
- Time Price Opportunities (TPOs):
- Represented by letters or brackets, TPOs display price levels traded during specific time intervals.
- A dense cluster of TPOs indicates significant market activity at that price.
- Value Area:
- The Value Area highlights the price range where most of the trading volume occurred.
- It serves as a benchmark for identifying support, resistance, and potential breakout zones.
- Point of Control (POC):
- The POC is the price level with the highest trading activity.
- It acts as a balance point, often indicating equilibrium between buyers and sellers.
How to Interpret Market Profile Charts:
- Trending Markets: A progressive shift in the Value Area and POC indicates a trending market.
- Consolidation Phases: A balanced profile with TPOs concentrated in the middle signals consolidation.
- Breakouts: Price movement away from the Value Area extremes often leads to breakouts, creating trading opportunities.
Benefits of Market Profile Charts:
- Enhanced Market Understanding: Gain insights into market structure and dynamics.
- Precision in Trade Entries and Exits: Use key levels such as the Value Area and POC to refine decisions.
- Improved Risk Management: Set more accurate stop-loss and profit targets by analyzing trading volume and price distribution.
Market Profile Charts provide a structured and intuitive way for traders to interpret complex market data, offering a significant edge in both day-to-day trading and competitive environments.
How to Read a Market Profile Chart
Reading a Market Profile chart starts with identifying whether the session is showing balance or imbalance.
- In balanced conditions, the profile tends to look more centered, with the Value Area containing most activity and the market rotating around the POC.
- In imbalanced conditions, the Value Area and POC often shift over time, showing acceptance moving higher or lower as participation follows price.
A practical way to interpret the profile is to treat the Value Area as a reference zone:
- When price is accepted inside the Value Area, rotation and mean reversion behaviors become more likely.
- When price spends time outside the Value Area and continues building activity there, it can signal that the market is accepting a new area of value.
Understanding Market Profile Structures
Market Profile structures help traders interpret whether the market is balanced, trending, or transitioning between conditions. The shape of the profile itself often provides insight into participant behavior.
For example:
- Balanced profiles may suggest rotation and mean reversion.
- Elongated profiles can suggest directional conviction.
- Double distribution profiles may show a transition between two accepted value areas.
- Poor highs and lows may indicate unfinished auction activity.
Rather than relying only on indicators, traders use these structures to understand how the auction process develops throughout the session.
Analyzing Market Value Areas and POC
The Value Area and Point of Control are some of the most important references in Market Profile Trading.
The Value Area represents where the market accepted value during the session, while the POC identifies the price with the highest trading activity.
Traders monitor these levels to:
- identify support and resistance
- frame intraday bias
- locate potential breakout zones
- manage risk placement
- evaluate whether price is accepting or rejecting value
When price remains accepted inside value, rotational behavior often dominates. When price leaves value and builds acceptance elsewhere, trending conditions may develop.
Best Market Profile Settings for Day Trading
Most day traders use Market Profile on a session basis so the profile reflects a consistent auction window (for example, a regular trading session). The “best settings for Market Profile day trading” usually come down to two choices:
- Session definition
Use a consistent session template so each day is comparable. The point is not the exact session choice, but consistency. - Profile type and levels
Traders commonly plot:
- Point of Control (POC)
- Value Area High (VAH)
- Value Area Low (VAL)
When traders ask about identifying value areas in Market Profile or how to identify value areas on a chart, they’re referring to the region where most activity occurred (often described as ~70% of activity for that session). VAH/VAL act as practical boundaries for describing where the market accepted value versus where it rejected price.
Practical Applications of Market Profile Trading
Traders use market profile trading to identify strategic trade setups like:
- Poor Highs/Lows,
- Determine support and Resistance levels
- Differentiate between consolidation and breakout periods, and
- Confirm trends
Reading Poor Highs and Lows in Market Profile
Poor highs and poor lows are often discussed as signs that an auction may not have finished cleanly at the extreme. Traders watch these areas because revisiting an unfinished extreme can lead to continued exploration (extension) or a sharper rejection, depending on whether participation returns with strength.
In practice, traders don’t treat poor highs/lows as automatic reversals. They look for confirmation that the market is rejecting the extreme (failure to accept above/below) or that the market is building acceptance beyond it (continuation).
Combining Market Profile with Footprint Charts and Order Flow
Some traders combine Market Profile with footprint charts to validate participation at key profile levels (VAH/VAL/POC). Market Profile provides structure (where value formed), while order flow tools can help confirm whether aggressive activity is supporting acceptance or rejecting price at those levels. This combination is often used for timing entries and managing risk more precisely around profile references.
By incorporating these insights into their trading decisions, traders aim to enhance decision-making and increase their probabilities of success. Here are some practical applications of market profile trading:
1. Strategic Trade Setups:
- Traders use Market Profiles to devise strategic trade setups based on the insights gained from the distribution of trading activity.
- For example,
- A trader might identify a “Poor High” or “Poor Low” formation on the market profile chart.
- This occurs when the market makes a brief excursion beyond the previous day’s high or low but fails to sustain that level and returns within the Value Area.
- This setup could signal a potential reversal, prompting the trader to enter a trade with the expectation that the market will reverse its direction.
2. Support and Resistance Levels:
- Market Profile helps traders identify support and resistance levels with greater precision.
- Additionally, the upper and lower boundaries of the value area serve as potential areas where prices might reverse.
- By aligning these levels with other technical indicators, traders can make more informed decisions about placing stop-loss and take-profit orders.
3. Periods of Consolidation and Breakout:
Market profile assists traders in distinguishing between periods of consolidation and potential breakout scenarios in the following manner:
|
Aspects |
Consolidation |
Breakout Opportunities |
|
Indicator |
During consolidation, the Value Area narrows, reflecting a lack of directional movement. | If the market profile shows a wide Value Area with price acceptance at the extremes, it suggests potential breakout opportunities.
|
|
Trader’s Action |
Traders consider range-bound strategies, such as mean reversion techniques, within these periods. | Traders can prepare for breakout trades by monitoring the price’s reaction as it approaches the Value Area boundaries. |
4. Trend Identification and Confirmation:
- Traders utilize market profiles to confirm or identify emerging trends.
- If the market profile consistently shows a one-sided distribution of TPOs and the point of control shifts in the direction of the trend, it suggests a strong and sustained trend.
Combining Market Profile with Order Flow Footprints
Many traders combine Market Profile with order flow tools because the two approaches complement each other well.
Market Profile provides structure:
- where value developed
- where the market accepted price
- where balance or imbalance exists
Order flow tools provide execution detail:
- aggressive buying and selling
- absorption
- liquidity shifts
- trapped traders
- delta imbalances
This combination helps traders avoid relying on structure alone while improving timing around important Market Profile references like POC, VAH, and VAL.
Market Microstructure and Liquidity Analysis
Modern traders increasingly combine Market Profile concepts with liquidity analysis and market microstructure tools.
Instead of only asking where volume traded, traders now also ask:
- Was liquidity holding or pulling?
- Was aggressive buying absorbed?
- Did the market accept value above resistance?
- Was the breakout supported by participation?
This creates a more complete understanding of market behavior than static profile levels alone.
Market Profile Trading for S&P 500 E-mini Futures
Market Profile is especially popular among S&P 500 E-mini futures traders because futures markets provide centralized volume and session-based structure.
Many ES traders use Market Profile to:
- identify overnight inventory conditions
- frame opening scenarios
- track Value Area shifts
- locate responsive buying or selling
- identify breakout and rotational environments
Because ES futures trade with high liquidity and strong institutional participation, Market Profile references often become important decision points during the trading session.
Trading Crypto Volatility Using TPO Value Areas
Some traders also apply Market Profile concepts to crypto markets. In volatile digital asset environments, TPO value areas can help identify where the market previously accepted price before expanding into higher or lower volatility.
Since crypto trades continuously, traders often define custom session windows when building Market Profile structures for Bitcoin and other major assets.
The Competitive Advantage: Market Profile in Trading Competitions
In the world of trading competitions, having a deep understanding of tools like the Market Profile can provide participants with an unparalleled edge. For instance, in one of the Blue Jacket competitions, a participant showcased their proficiency with Market Profile by analyzing the intricate relationship between price, time, and volume. View insights into market profile here.

They then presented a meticulous trading strategy backed by insightful screenshots and videos, explaining their moves every step of the way. This strategy not only highlighted the importance of recognizing key support and resistance levels but also how to capitalize on trend shifts and potential breakout points.
The Blue Jacket Competition:
The Blue Jacket competition is an ideal platform for traders to apply their Market Profile knowledge. Traders who integrate Market Profile analysis into their strategies can effectively identify trend shifts, anticipate breakouts, and manage risk.
The examples on the Bookmap Insights page dated June 19, June 11, and April 17 showcase how traders have used Market Profile to gain an edge in the competition.
Understanding market profile trading empowers participants in trading competitions with a distinctive advantage. The Blue Jacket competition exemplifies how market profile proficiency can elevate both individual traders and the broader trading community.
Ready to showcase your understanding of Market Profile Trading? Use your unique trading insights and strategies to inspire the Bookmap community. Your journey to becoming a trading leader starts here. Step into the Blue Jacket competition today.
Professional Day Trading Frameworks
Many professional intraday traders use Market Profile as part of a broader trading framework rather than a standalone signal system.
A structured workflow may include:
- session context analysis
- overnight inventory review
- Value Area references
- liquidity and order flow confirmation
- execution planning around key levels
This helps traders move away from random indicator stacking and toward a more organized approach to market behavior and risk management.
Behavioral Finance in Price Discovery
Market Profile is closely tied to behavioral finance because it studies how participants collectively accept or reject price over time.
As traders react to news, volatility, positioning, and liquidity, the auction process reflects crowd behavior through profile development. This makes Market Profile useful not only for technical analysis, but also for understanding market psychology and participation shifts.
Conclusion on Market Profile Trading
In conclusion, Market Profile is a powerful tool for dissecting market behavior, centering on the relationship between price, volume, and time. Its primary components are Time Price Opportunities (TPOs), which highlight specific price ranges over periods; the Value Area, denoting the commonly accepted price range; and the Point of Control (POC), marking a balance between buyers and sellers. This method equips traders with the skills to spot trends, manage risks, and understand market sentiment.
When applied to trading competitions, especially ones like the Blue Jacket competition, knowledge of Market Profile offers participants a significant advantage, enabling them to craft well-informed trading strategies.
Optimize your market profile trading with Bookmap. Sign up now for FREE.
FAQ
What is Market Profile Trading and how does it work?
Market Profile Trading organizes price, time, and volume into a structured view, helping traders see where the market spent the most time and volume. It highlights important areas like the Value Area, Point of Control (POC), and Time Price Opportunities (TPOs) to better understand market behavior.
What is the difference between Market Profile and Volume Profile?
Market Profile uses both time and volume to display where trading activity occurred, while Volume Profile focuses only on volume at each price level. Market Profile offers a time-based view of market structure, making it useful for identifying trends, consolidations, and key trading zones.
How do traders use the Value Area and Point of Control in Market Profile Trading?
The Value Area represents the range where about 70% of trading volume occurred, often acting as a support or resistance zone. The Point of Control is the price level with the highest trading activity. Traders watch these levels closely to plan entries, exits, and manage risk.
What strategies are commonly used with Market Profile?
Common strategies include trading Value Area re-entries, identifying support and resistance at the edges of the Value Area or near the POC, trend following when the Value Area shifts over time, and breakout trading when price moves beyond Value Area extremes.
What is the best Market Profile indicator tool?
The best tool is one that clearly plots session-based Market Profile levels (POC, VAH, VAL), supports consistent session templates, and allows you to track developing levels during the session. Most traders prioritize clarity, stable session definitions, and readable profiles over extra features.
Do you prefer Time Price Opportunity (TPO) or Volume Profile?
TPO-based Market Profile emphasizes time spent at price and can help interpret acceptance and balance. Volume Profile emphasizes volume at price and is often used to locate high- and low-volume areas. Many traders use both, depending on whether they want time-based structure or volume-based liquidity context.
Are you looking for a free or paid Market Profile indicator?
Free indicators can work for basic profile plotting, but paid tools often provide cleaner session controls, developing levels, and better customization. The right choice depends on how heavily Market Profile is used in your process and whether you need precision around session structure.
Do you need help with installation or interpretation?
If you’re trying to set up a Market Profile charting tool, it helps to confirm what platform you’re using and whether you want session-based profiles, developing levels, or both. If you’re focused on interpretation, start with reading Value Area behavior and how price interacts with VAH, VAL, and POC.
Are you looking for a specific trading platform?
Market Profile is available across many charting environments. The key is using consistent session settings and focusing on the profile levels that matter most for your trading decisions.
What is auction market theory in trading?
Auction Market Theory explains how markets continuously search for fair value through the interaction of buyers and sellers. Market Profile is one of the most common ways traders visualize this process.
How do traders identify Value Areas in Market Profile?
The Value Area represents the range where most trading activity occurred during a session. Traders typically monitor Value Area High (VAH), Value Area Low (VAL), and the Point of Control (POC).
Can Market Profile be combined with order flow analysis?
Yes. Many traders combine Market Profile with order flow tools to confirm participation, absorption, liquidity shifts, and aggressive buying or selling around key profile levels.
What are poor highs and poor lows in Market Profile?
Poor highs and lows are unfinished auction extremes where the market failed to reject price cleanly. Traders often revisit these areas later in the session or future sessions.
Is Market Profile useful for futures trading?
Yes. Market Profile is widely used in futures markets because centralized exchange volume and session structure make profile analysis more consistent and reliable.
Sign Up Now