See trading depth interview more clearly in real time.
Compare plans to access deeper market visibility for trading depth interview.
Education
March 3, 2026
SHARE
How to Trade With Bookmap: a Detailed Step-By-Step Guide
In addition to its core features and innovative ways of visualizing the market, Bookmap offers a range of tools that make trading more transparent and efficient.
This is the guide that explains the fundamentals of Bookmap – a trading platform which provides you with the most transparent way to view the market.
1. What Is Bookmap and How Does It Work?
Bookmap is a real-time market visualization and trading software that allows traders to see the evolution of the order book, every individual order in the market, and algorithmic trading activity. Unlike traditional charts, Bookmap presents market data in a heatmap format, helping traders make more informed decisions based on liquidity and order flow.
What Can You Do With Bookmap?
With Bookmap, you can:
- Debrief and analyze your trades using Replay Mode to improve your strategy.
- Trade futures, stocks, and cryptocurrencies with real-time data visualization.
- Use proprietary indicators such as Iceberg & Large Lot Tracker and Order Book Imbalance.
- Access in-depth educational resources on order flow trading.
- Learn from professional traders by connecting with Bookmap’s educator partners.
2. Getting Started: Setting Up Bookmap
Note: Skip this section if you have already installed Bookmap.
Choosing the Right Bookmap Package
- If you’re just exploring, start with the free Digital package.
- For crypto trading, choose Digital or Digital Plus.
- For futures and US stocks, subscribe to Global or Global Plus.
- Recommended data providers:
- Futures data: Rithmic, dxFeed (for full-depth market data).
- US equities: dxFeed.
Step-by-Step Installation Guide
- Download and install Bookmap from this link.
- Copy your license key from the “Get Started” tab in your user portal.
- Launch Bookmap and enter your license key.
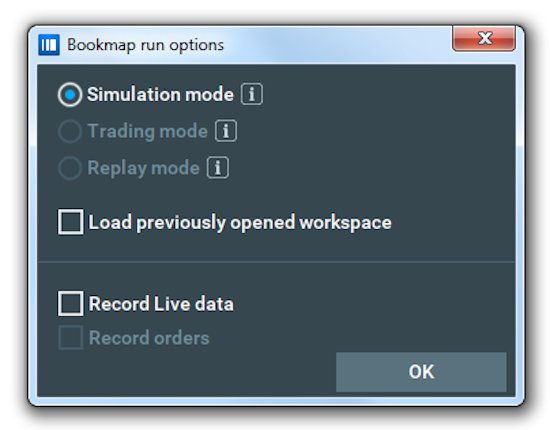
- Choose a run mode (explained below).
Understanding Bookmap’s Run Modes
- Simulation Mode: Trade using a simulator while viewing real-time data.
- Trading Mode: Execute trades through your broker or exchange.
- Replay Mode: Replay recorded market depth data for backtesting.
Connecting to a Data Provider
- Open Bookmap and navigate to Connections → Configure.
- Select your data provider, enter your credentials, and click OK.
- Return to Connections, select the provider, and click Add Symbol.
After launching Bookmap, click on “Connections⟶Configure” in the upper menu bar. Add all the connections you need, enter your data provider credentials, click “OK.” Click “Connections” again and choose the data providers you want to connect. After that, click on “Add Button” and pick a symbol you want to subscribe to. That’s all, you are ready to work with Bookmap. If you need a more detailed explanation of how to connect to data feeds, watch the video below.
3. Bookmap’s Core Features Explained
The Heatmap: Visualizing Market Liquidity
Bookmap’s Heatmap provides a real-time visualization of liquidity, displaying passive orders at all price levels. Key benefits include:
✔️ Spotting hidden liquidity zones and algorithmic activity.
✔️ Identifying support and resistance levels in a dynamic way.
Volume Bubbles: Tracking Buying and Selling Pressure
The Volume Bubbles feature highlights where significant trading activity occurs:
✔️ Larger bubbles indicate higher volume.
✔️ Red bubbles signal aggressive selling, while blue bubbles indicate aggressive buying.
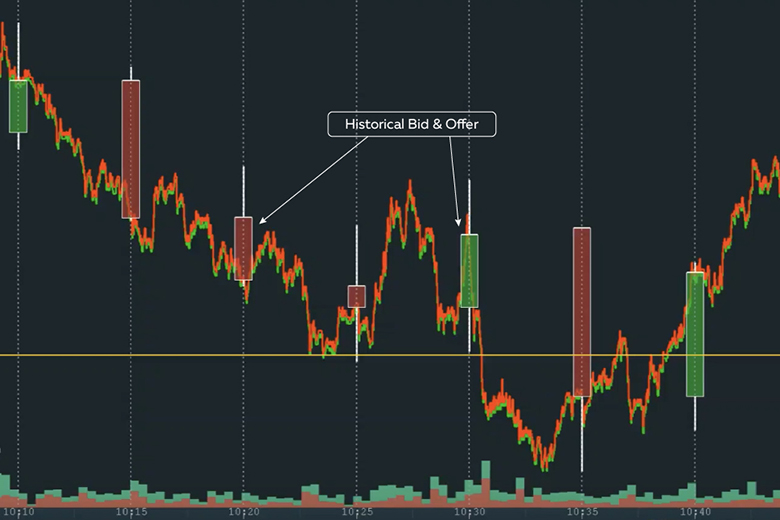
Historical Best Bid/Ask: Seeing the True Price Action
Unlike traditional candlestick charts, Bookmap lets you view the historical best bid and ask at every moment, giving a more granular look into market movements.
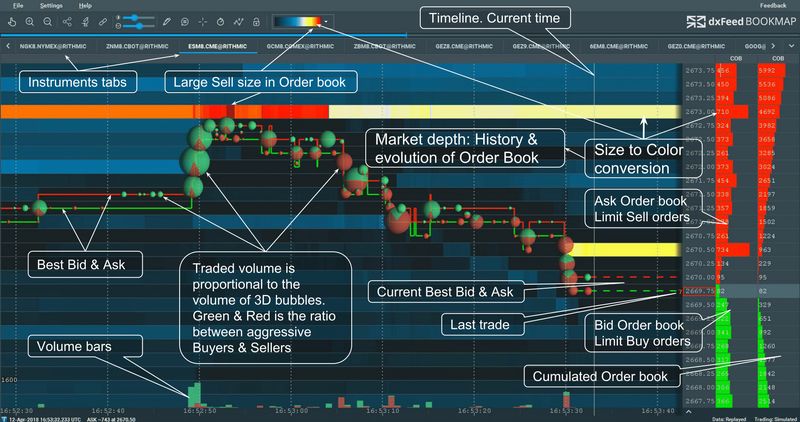
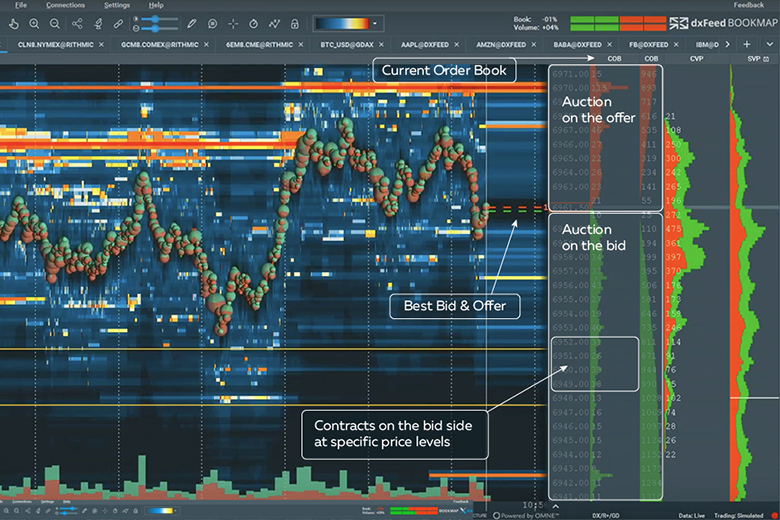
The Depth of Market (DOM) and COB
The DOM (Depth of Market) shows order book liquidity levels, while the Current Order Book (COB) lets you track contract volumes and market intent in real time.
If we turn these elements off, we will see only a candlestick chart. The problem? It is aggregated data for a certain period. We can’t see what’s going on inside a candle. It’s a black box inside which could be anything.
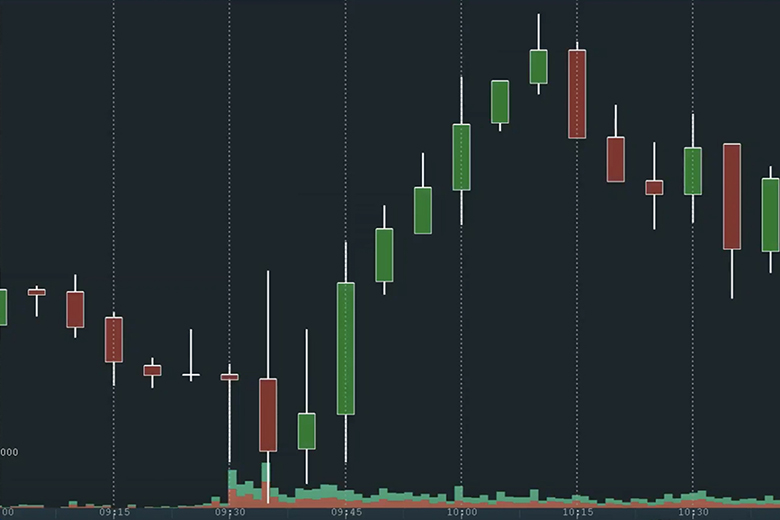
However, if we turn on historical best bid & offer, you could notice a difference. You see what really occurred with the price between two candles. This info is crucial for you as a trader because it helps you make better-informed decisions.
Still, a lot of data is missing. Why? Because we don’t have the volume in a candlestick chart. If we turn on the volume bubbles, we can see where that volume is transacting. Also, we can feel the buying and selling pressure on this market.
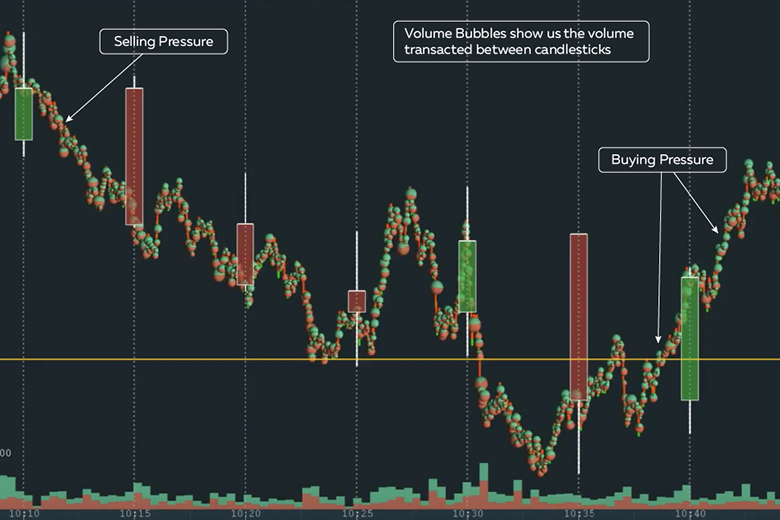
We see how bulls show interest and change the direction of the market. These are important areas to understand, and the candlestick chart is completely lacking in it. It’s better to leave candles where they should be – in the XIX century.
Watch the following video, to see how Bookmap displays the data. We can zoom in on this little cluster, so we can look at micro-second levels. We can see the market events that happened in millions and billions of seconds.
Now you know how historical best & offer and Volume Bubbles work, so we can move on to the third key Bookmap element – Heatmap. It visualizes DOM, adding a third dimension to trading charts.
A Depth of Market (DOM) is the auction where traders put orders on different price levels. In Bookmap, you can see it on the right menu – COB (Current Order Book). The numbers on the COB column are contracts. In the «green» zone there’s the auction on the bid, and in the «red» zone — auction on the offer.
Actually, the DOM is great. You can see and understand where larger levels of liquidity or lack of liquidity is present. The problem with a DOM is that these numbers are constantly changing. You have to memorize it and ask yourself a lot of questions. How well was their behavior? Did they add liquidity? Did they pull liquidity? How much? What about the areas around it? Did they add higher liquidity? Or did they step back and provide liquidity at lower levels?
You will have to answer all of these questions. It’s pretty tedious to answer all that in the DOM, and then remember it over a long period of time. It’s probably better to assign this job to the machine and then skim the margins.
Bookmap is made right for that. We turned DOM data into the Heatmap. If you look at the Heatmap, found to the left of COB, you will note painted areas of high liquidity. When the numbers change, the Heatmap changes, and you can understand the behavior of traders.
Take a look at the striations in 6966 level. You can see the adding and pooling of liquidity. Also, you can understand the level, looking at the color scale of Heatmap. When it’s darkly colored, there’s very little liquidity. When it’s blue or white, there’s more of it. Orange is a level of high liquidity.
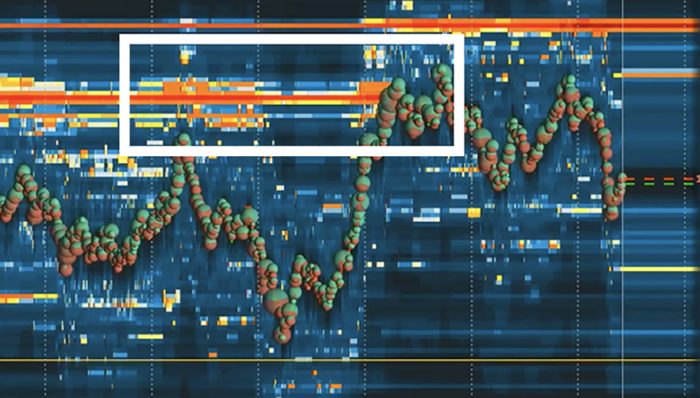
If you zoom out, you can see longer-term liquidity. So you don’t have to memorize it. Simply note it, and see if they stay in the book later on. You then see everything right in front of you.
We can also start determining the intent of traders in that auction. Did they stay in the book? Did they pool? Did they actually trade? This offers tremendous insight into understanding the intent of larger players providing liquidity. Observing Market Makers is an underrated free lunch, and now you can have it too.
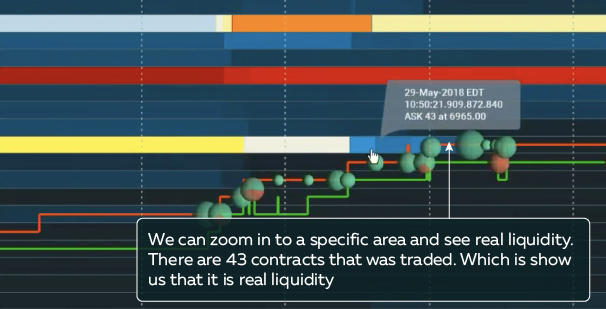
A lot of traders say that they don’t look at liquidity, because there’s a lot of fake liquidity. Actually, there are. But in the picture below, you can see a good example of it not being fake. This, for example, is real liquidity. There are 743 contracts here, and they stayed in the book and traded. This is a fact.
Understanding the Heatmap is not really so hard. By watching the next video, in just 8 minutes you will get information on how Heatmap helps to differentiate between real and fake liquidity.
The Heatmap opens up a whole new world of opportunities in trading. You can watch the dynamics of market liquidity, spot patterns of exhaustion/absorption, track icebergs and algo, detect order book flipping, and many more. You could learn how to do it with the help of the educational materials we listed in the last section.
Conclusion: if Bookmap was a bit smarter, it could have found life on Mars. However, we decided to leave that job to Elon Musk. Instead, we concentrated on creating the most advanced and convenient trading software. Have we succeeded or not? Download the trading platform to check it.
Advanced Order Flow Insights
Detecting Real vs. Fake Liquidity
Not all liquidity is genuine. Using Heatmap analysis, traders can differentiate between real orders that execute and spoofing activity that disappears before execution.
Tracking Algorithmic Trading Activity
By analyzing liquidity shifts and order book movements, traders can detect hidden algorithmic strategies and leverage them for better positioning.
Understanding Market Maker Behavior
Market makers adjust liquidity based on market conditions. Using Bookmap’s tools, traders can:
✔️ Identify large liquidity zones.
✔️ Recognize order book flipping.
✔️ Track absorption and exhaustion patterns.
4. Where to Learn More: Bookmap Educational Resources
Install Bookmap if you haven’t done so already. If you want to try it out first, there’s a free version with free data for crypto from 20 data providers and dxFeed delayed data for stocks. However, we recommend using Bookmap Global Plus to fully experience Bookmap’s advantages.
When you are ready to start trading with Bookmap, we encourage educating yourself in parallel. We have divided educational materials into stages to ease the onboarding process.
For beginners:
1) Watch the first part of the Bookmap educational course.
In this video, you will learn the basics of reading and using market microstructure in trading.
2) Study an article written by our CTO, which meticulously explains how to use the Heatmap in trading. Must read: http://bit.ly/2HPT8mT
3) Read the interview with our CEO, where he talks about Bookmap’s story and explains its key features: http://bit.ly/2rtRkX9
For those who have already learned the basics of Bookmap:
4) How Bookmap helps traders answer five “WHY?” questions they often ask themselves. Read the article: http://bit.ly/2Fjog8U
5) Why visualization is important in trading, and how the Heatmap helps with it: http://bit.ly/2IoI7cx
6) Take a crash course in risk-management trading. Read: http://bit.ly/2wJJfCR
7) Explore the list of recommended books on trading: http://bit.ly/2vslzSJ
8) We have held a joint webinar with one of the most renowned futures traders in the world – FT71. It is a must-watch one!
Go through a series of webinars held by experienced traders.
See the complete list of webinars here.
For advanced Bookmap Users:
9) There are advanced live sessions every day. To see who’s streaming, go to the Bookmap Live Education & Events Calendar. or subscribe to our YouTube channel.
.
Where to follow:
Our Twitter and YouTube accounts. There, we publish educational materials, info about Bookmap updates, and interesting market phenomena. If you prefer Facebook, or Instagram you can follow us there
Trading Depth project – interviews with traders to read:
#1 Trading Depth Interview: Walter Lesicar, the Trade-To-Win Trader
#2 Trading Depth Interview: Luis Recabarren, a Fighter, a Ballet Dancer, and a Private Equity Manager
#3 Trading Depth Interview: Bret Bossenberry, Futures, Options, and Stock Trader
#4 Trading Depth Interview: Jason Ramus, Futures, Stocks, and Options Trader & Analyst
#5 Trading Depth Interview: BitScalp Takes Us on a Journey of Trading Bitcoin, Since the Darknet
#6 Trading Depth Interview: Jason from the OTG Giving a Number 1 Advice for Traders
#7 Trading Depth Interview: Del the Trader Talks Day Trading Stocks and Active Traders Community
#8 Trading Depth Interview: Riding the Order Flow in Indian Markets
#9 Trading Depth Interview: Koning Karel Applies Mixed Strategy to Digital Currencies
#10 Trading Depth Interview: FuturesTrader71 — A Tale of A Calm Mastermind (FT71)
#11 Trading Depth Interview: Ryan Mallory — Watching Stocks Fly Like SpaceX
#12 Trading Depth Interview: Carlos Martinez and Deep Diving in Futures
#13 Trading Depth Interview: Joseph Gasperoni, Small Cap Stocks, and a Family Business
#14 Trading Depth Interview: Matt Davio — Hitting Moneyball Before It Was Cool
#15 Trading Depth Interview: Madaz Money — Off The Charts!
#16 Trading Depth Interview: Andre Nastasi – From Real Estate to Day Trading
#17 Trading Depth Interview: Yagub Rahimov, Working Hard toward Miracle
#18 Trading Depth Interview: Longshortorflat: Decoding the Markets
#19 Trading Depth Interview: Peter Becker Demystifies Trading Stereotypes
#20 Trading Depth Interview: How Frank Pollack Came for Lessons and Stayed with Bookmap
Selected playlists to watch:
***
You’ve now explored the essential features of Bookmap and its educational resources. To maximize your trading success:
✔️ Practice using Bookmap’s features daily.
✔️ Watch educational content and join live sessions.
✔️ Share your experience and feedback on Trustpilot.
Happy trading!
FAQ
What markets can I trade using Bookmap?
You can trade futures, stocks, and cryptocurrencies using Bookmap. The platform provides real-time data visualization and advanced tools for analyzing order flow, liquidity, and market activity across these markets.
Do I need a paid subscription to use Bookmap?
Bookmap offers a free Digital plan ideal for exploring and crypto trading. However, to access advanced features like Stops & Icebergs or trade futures and US equities with full-depth data, you’ll need a paid subscription such as Global or Global Plus.
How can Bookmap help me spot real liquidity vs. fake liquidity?
Bookmap’s Heatmap visualizes liquidity clearly, enabling traders to distinguish genuine liquidity from spoofing. Real liquidity remains in the order book and executes, whereas fake liquidity appears temporarily and is removed before execution.
Can I replay and analyze my trades in Bookmap?
Yes, Bookmap includes a Replay Mode. This feature allows traders to replay recorded market depth data, analyze past trades, refine strategies, and better understand market dynamics without real-time pressure.
What are Bookmap’s unique indicators for trading?
Bookmap includes unique proprietary indicators such as:
-
Iceberg & Large Lot Tracker: Detects hidden large-volume orders (icebergs).
-
Order Book Imbalance: Shows imbalances between bid and ask orders, providing insight into market momentum and potential directional moves.
Does Bookmap support simulated trading?
Yes, Bookmap supports a Simulation Mode, allowing traders to execute simulated trades using live data without risking real capital. This is particularly useful for practicing and improving trading strategies safely.
Which data providers does Bookmap recommend for futures and equities trading?
For futures trading, Bookmap recommends Rithmic or dxFeed for full-depth market data. For US equities trading, dxFeed is the preferred data provider.
How do I set up my data connection in Bookmap?
To connect Bookmap to your data provider:
-
Open Bookmap and click Connections → Configure.
-
Select your data provider and enter your login credentials.
-
Click OK, return to Connections, select your provider, and then click Add Symbol.
Sign Up Now