4th of July Sale
50% Off Bookmap Global+, Data & Add-Ons
Save on Global+, market data, and add-ons from July 3–13.
Education
July 18, 2024
SHARE
Multi-Time Frame Analysis: A Guide for Traders

The financial markets have evolved, and so have the analysis aspects and strategies. Multi-time frame analysis is a powerful trading technique that checks several time frames to draw conclusions. Used by several successful traders, it tremendously helps enhance trading outcomes.
We will start by defining multi-time frame analysis and explain its role in providing a comprehensive market view. You’ll learn about typical time frames—long-term, medium-term, and short-term—and how they interrelate for a holistic perspective.
Also, we’ll discuss how to choose time frames based on your trading style, coordinate signals across these frames, and use indicators like moving averages for effective analysis. Lastly, we’ll study how to combine multi-time frame analysis with methods like Elliott Wave Theory and Fibonacci retracements. Let’s begin.
The Fundamentals of Multi-Time Frame Analysis
Multi-time frame analysis (MTFA) is a technique used in trading and technical analysis. In this technique, multiple time frames are examined to gain a comprehensive understanding of the market’s behavior. By analyzing the same asset over different time scales, traders can more accurately identify:
- Trends,
- Patterns, and
- Potential reversal points.
One of the most important roles of MFTA is to provide a comprehensive and layered market view. This enhances a trader’s ability to see the big picture while also focusing on finer details. Using this view, traders can:
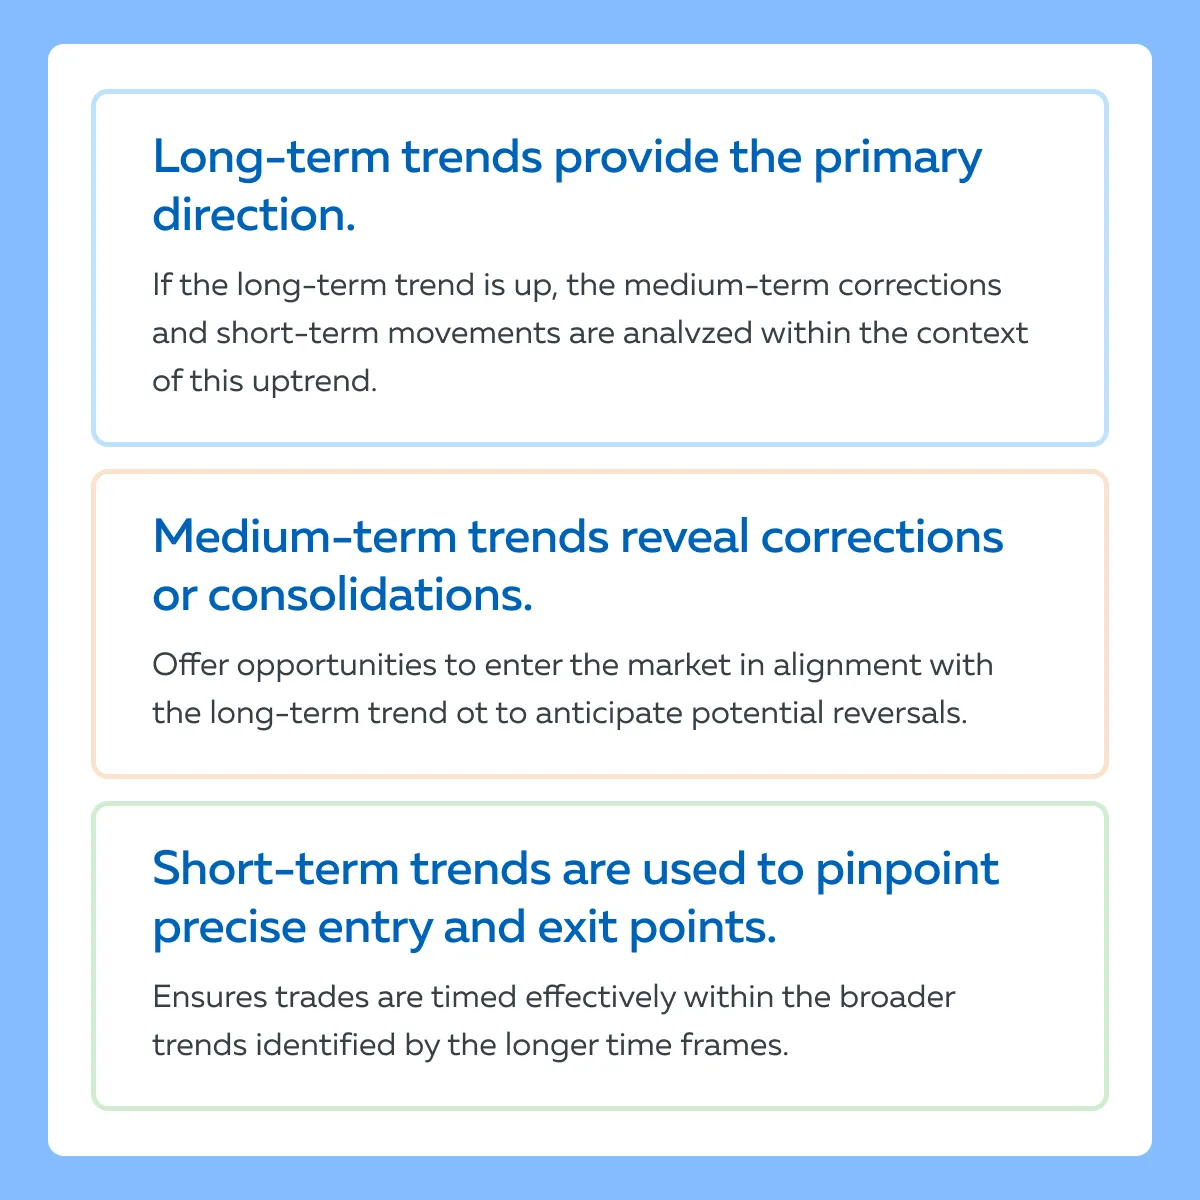
- Identify long-term trends,
- Spot medium-term trend corrections or consolidations, and
- Gain a better understanding of short-term market movements.
By synthesizing information across these various time frames, traders can better anticipate future price actions and align their strategies accordingly.
Now, let’s observe the typical time frames used in MTFA.
| Time Frame | Purpose | Usage |
| Long-Term Time Frame (e.g., Weekly, Monthly) | Identifies the overarching trend and market direction | Investors and long-term traders use this to determine the primary trend. |
| Medium-Term Time Frame (e.g., Daily) | Tracks the intermediate trend. Also, it captures corrections or consolidations within the primary trend. | Swing traders often rely on this time frame to exploit medium-term price movements within the larger trend. |
| Short-Term Time Frame (e.g., Hourly, 15-Minute) | Provides detailed insights into day-to-day price actions and volatility. | Day traders and scalpers focus on this time frame to fine-tune entry and exit points for their trades. |
How do these different time frames inter-relate and offer a holistic market view?
Traders must note that the interrelation of these time frames forms the foundation of MTFA. See the graphic below to understand this inter-relationship:
What are the advantages of multi-time frame analysis?
- Enhanced Trend Confirmation
-
- MTFA allows traders to confirm trends across different time frames.
- This confirmation increases the reliability of their trend assessments.
- For example,
- Say both the long-term and medium-term trends are bullish.
- Now, a trader can have greater confidence in a bullish position.
- More Precise Entry and Exit Points
-
-
- By zooming into shorter time frames, traders can identify optimal points to enter or exit trades.
- This identification ensures better timing and more potential gains.
-
- Also, this precision reduces the risk of entering trades based on incomplete information.
- Better Risk Management
-
- MTFA helps traders manage risk more effectively.
- Understanding the context provided by longer time frames allows for setting more:
- Strategic stop-loss
and
- Take-profit levels.
- This multi-layered approach helps traders avoid whipsaw effects common in single-time frame analysis.
Essential Component of Multi-Time Frame Analysis
To enhance trading decisions and improve accuracy in trend identification, traders need to choose an appropriate time frame based on their trading style. Let’s see how swing traders and scalpers can do so:
Swing Traders
Mostly, swing traders hold positions for several days to weeks. They aim to capture medium-term price movements. See the ideal chart selection for swing traders:
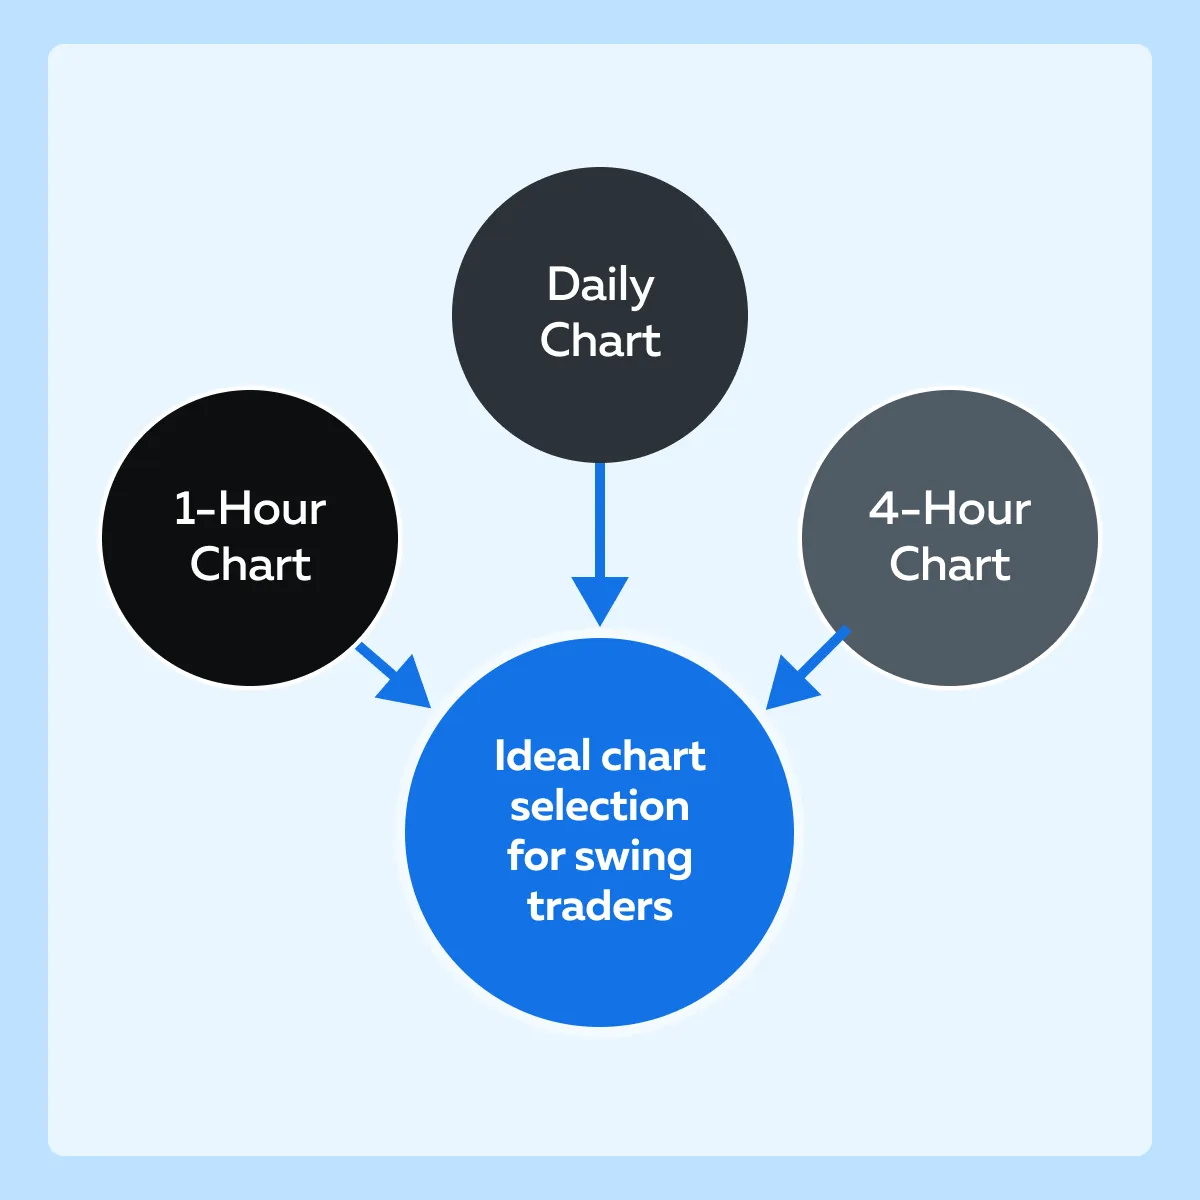
| Daily chart | 4-hour chart | 1-hour chart |
|
and
|
|
Scalpers
Scalpers focus on very short-term trades. They often enter and exit positions within minutes to hours.
| 4-hour chart | 1-hour chart | 15-minute chart |
and
|
|
|
How to coordinate and interpret signals across time frames?
Let’s understand how you can coordinate different time frames through a step-by-step process:
Step I: Identify the Primary Trend (Longer Time Frame)
- Start with the longest time frame in your chosen set (daily for swing traders, 4-hour time frame for scalpers).
- Identify the primary trend direction (uptrend, downtrend, or sideways).
- Look for the following:
- Major support and resistance levels,
- Trend lines,
- Significant patterns (e.g., head and shoulders, double tops/bottoms).
Step II: Analyze Intermediate Movements (Medium Time Frame)
- Move to the medium time frame (4-hour time frame for swing traders, 1-hour time frame for scalpers).
- Examine how the price behaves within the context of the primary trend.
- Identify medium-term trends, corrections, and consolidations.
- Look for these signals:
- Moving average crossovers,
- RSI divergences, and
- MACD signals.
Step III: Fine-Tune Entries and Exits (Shorter Time Frame)
- Finally, analyze the shortest time frame (1-hour time frame for swing traders, 15-minute time frame for scalpers).
- Utilize the following to identify the precise entry and exit points:
- Candlestick patterns,
- Short-term trend lines, and
- Immediate support/resistance levels.
- Confirm the signals seen in the medium time frame. For example,
- Say a 4-hour chart shows a bullish signal.
- Now, look for a corresponding bullish setup on the 1-hour or 15-minute chart to enter the trade.
How can you perform a coherent analysis?
To avoid conflicts and gain a clear understanding, ensure that signals across all time frames align with each other. For example,
- Say the daily chart shows an uptrend.
- Ideally, the 4-hour chart should confirm this with an:
- Upward movement
or
- Bullish patterns.
- Also, the 1-hour chart should provide a precise entry point within this context.
Do avoid taking trades based solely on the shorter time frame without confirmation from the longer time frames to prevent acting on false signals.
Furthermore, wait for the synchronization of signals before taking a trade. For example,
- Say the 4-hour chart shows a bullish reversal pattern.
- Now, wait for the 1-hour chart to show a breakout above a resistance level to confirm the entry point.
How to Implement Multi-Time Frame Analysis
Multi-time frame analysis involves using various technical indicators to validate trends and signals across different time frames. Let’s learn how to use common indicators like:
- Moving averages,
- RSI (Relative Strength Index), and
- MACD (Moving Average Convergence Divergence).
- A) Moving Averages (MA)
- Daily Chart (Long-Term)
-
-
- Use a 50-day and 200-day moving average to identify the overall trend.
- A bullish crossover (50-day MA crossing above 200-day MA) indicates a long-term uptrend.
-
- 4-Hour Chart (Medium-Term)
-
- Use a 20-period and 50-period moving average to spot medium-term trends.
- A crossover here indicates a shorter-term trend change within the context of the long-term trend.
- 1-Hour Chart (Short-Term)
-
-
- Use a 10-period and 20-period moving average to pinpoint entry and exit points.
- Short-term crossovers provide precise timing for trades.
-
- Example
-
- Assume that the 50-day MA is above the 200-day MA (bullish long-term).
- The 4-hour chart shows a 20-period MA crossing above the 50-period MA (bullish medium-term).
- Now, wait for the 1-hour chart to show a 10-period MA crossing above the 20-period MA to confirm a strong entry point.
- B) Relative Strength Index (RSI)
- Daily Chart
-
-
- An RSI above 70 indicates overbought conditions, while below 30 indicates oversold.
-
- 4-Hour Chart
-
-
- An RSI divergence (price making new highs while RSI doesn’t) signals potential trend reversals.
-
- 1-Hour Chart
-
-
- Use short-term RSI signals to fine-tune entries and exits.
-
- Example,
-
- Say the daily RSI is bullish.
- Now, look for a short-term dip (RSI below 30) on the 1-hour chart to buy.
- C) MACD
- Daily Chart
-
-
- A bullish crossover (MACD line crossing above the signal line) indicates a long-term buy signal.
-
- 4-Hour Chart
-
-
- Use MACD to confirm the trend strength within the context of the daily trend.
-
- 1-Hour Chart
-
-
- Look for MACD crossovers to time precise entries and exits.
- For example, if the daily and 4-hour MACD are bullish, a 1-hour MACD crossover can signal the ideal entry point.
-
- Example
-
- Assume that the daily MACD is positive
- The 4-hour MACD shows a bullish crossover.
- Now, wait for the 1-hour MACD to confirm with another bullish crossover to enter the trade.
How Can You Apply Multi-Time Frame Analysis in Various Market Conditions?
Read the table below to understand what indicators you can use and how you can strategize under different market conditions:
| Market Type | Indicators | Strategy |
| Trending Markets |
|
|
| Range-Bound Markets |
|
|
| Volatile Markets |
|
|
Examples of Successful Trades Using Multi-Time Frame Analysis

Example I: Bullish Trade in a Trending Market
The Setup
- The daily chart shows a strong uptrend with the 50-day MA above the 200-day MA.
- The 4-hour chart shows a pullback to the 50-period MA.
The Thought Process
- The long-term trend is bullish.
- The pullback to the 50-period MA on the 4-hour chart provides an entry point aligned with the primary trend.
The Execution
- On the 1-hour chart, a bullish crossover in the MACD confirms the entry point.
The Outcome
- A trader entered the trade at the 4-hour pullback.
- The trader then exited at a new high confirmed by the 1-hour chart’s MACD and RSI.
Example II: Bearish Trade in a Range-Bound Market
The Setup
- The daily chart shows a range-bound market between $100 and $120.
- The price approaches $120 resistance.
Thought Process
- The range-bound market suggests selling at resistance.
- The 4-hour chart indicates a downward trend in momentum as evidenced by a bearish divergence in the Relative Strength Index (RSI).
The Execution
- The 1-hour chart shows a bearish MACD crossover.
- This signal confirms the entry for a short trade.
The Outcome
- A trader entered short at $119 and
- Exited at $105 support.
Some Common Mistakes and Lessons Learned
By applying multi-timeframe analysis thoughtfully and systematically, traders can significantly enhance their decision-making process. However, while doing so, traders make several mistakes. Let’s observe the common ones and see how you can avoid it:
Mistake I: Ignoring Long-Term Trends
| What does it mean? | How to avoid it? |
|
|
Mistake II: Overtrading in Volatile Markets
| What does it mean? | How to avoid it? |
| Entering trades too frequently based on short-term volatility without considering the medium and long-term context can lead to significant losses. |
|
Mistake III: Failing to Confirm Signals
| What does it mean? | How to avoid it? |
| Acting on a single time frame’s indicator without cross-verifying with other time frames can result in false signals. |
|
Advanced Strategies and Techniques for Multi-Time Frame Analysis

When significant news or economic events occur, they cause substantial and rapid market movements. This requires the traders to adjust their multi-timeframe analysis strategies to manage these situations effectively.
Let’s understand better through a hypothetical scenario related to “Interest Rate Announcement”
- To monitor a specific stock, a trader uses a multi-timeframe setup with:
- Daily chart,
- 4-hour chart, and
- 1-hour chart.
- An unexpected interest rate announcement causes a spike in the stock’s price volatility.
How did the trader adjust?
- The trader monitored immediate reactions
-
-
- After the announcement, the trader quickly switched focus to the 1-hour chart.
- Through this switch, they can now observe immediate price reactions and volatility spikes.
-
- The trader adjusted stop-loss levels
-
-
- The trader tightened stop-loss levels to manage risk and protect against sudden adverse price movements.
- For example,
- Assume that the stock was trading at $100 before the announcement.
- It jumps to $105.
- The trader adjusted the stop-loss to $103.
- This way, they locked in some gains while allowing for minor pullbacks
-
- The trader identified key levels
-
- The trader uses the 1-hour chart to identify new support and resistance levels formed in response to the announcement.
How did the trader interpret the 4-hour chart?
- Assess Intermediate Trends
-
- While closely monitoring the 1-hour chart, the trader kept an eye on the 4-hour chart.
- This way, they understood how the intermediate trend is evolving.
- The trader used this understanding to determine whether:
- The initial reaction is part of a larger trend shift,
or
- Just short-term noise.
- Confirm Signals
-
- The trader looked for confirmations of trend changes or continuations on the 4-hour chart.
- A more sustained move is indicated if the price:
- Continues to hold above a key moving average (e.g., 50-period MA),
or
- Breaks through significant resistance on the 4-hour chart.
Now, let’s understand how a trader makes a “strategic adjustment” after interest rate announcements.
The Trader Temporarily Emphasizes Lower Time Frames
- In the immediate aftermath of the interest rate announcement, the trader places a greater emphasis on the:
- 1-hour charts
and
- 4-hour charts.
- This focus allows for capturing quick movements and making rapid adjustments to trades.
- Also, the trader increases the frequency of monitoring and analysis on the 1-hour chart.
- They set tighter stop-loss and take-profit levels to manage the heightened volatility effectively.
The Transition Back to Longer Time Frames
- Once the market reaction to the announcement begins to stabilize, the trader gradually shifts the focus back to the longer time frames.
- This transition helps in:
- Avoiding overtrading
and
- Reducing the impact of short-term market noise.
- Also, the trader uses the daily chart to re-evaluate existing positions and potential new trades.
How Can You Combine Multi-Time Frame Analysis with Other Analytical Methods?
Traders can enhance their trading strategies by combining multi-timeframe analysis with other analytical methods, such as:
- Elliott Wave Theory
and
- Fibonacci retracements.
By integrating these approaches, traders can:
- Improve accuracy in predicting price movements
and
- Refine their entry and exit points for better trading outcomes.
Let’s see how you can integrate both theories:
Elliott Wave Theory
Elliott Wave Theory is a form of technical analysis. Traders perform it to analyze market cycles and forecast future price movements by identifying waves within the market structure. This is how you can integrate this theory with multi-timeframe analysis:
| Long-Term (Daily Chart) | Medium-Term (4-Hour Chart) | Short-Term (1-Hour Chart) |
or
|
|
|
Example:
- Assume that the daily chart shows the beginning of Wave 3 (impulsive wave).
- Now, use the 4-hour chart to identify the smaller waves within Wave 3.
- Also, use the 1-hour chart to time entries during corrections within this impulsive wave.
Fibonacci Retracements
Fibonacci Retracements are used to identify potential support and resistance levels based on the Fibonacci sequence. This is how you can integrate it:
| Long-Term (Daily Chart) | Medium-Term (4-Hour Chart) | Short-Term (1-Hour Chart) |
| Apply Fibonacci retracement levels to the primary trend to identify key support and resistance zones. | Look for confluence between Fibonacci levels and medium-term support/resistance levels or trend lines. |
|
Example:
- Say the daily chart shows a bullish trend.
- Use Fibonacci retracement levels to find potential pullback areas (38.2%, 50%, 61.8%).
- Confirm these levels on the 4-hour chart.
- Look for precise entry points on the 1-hour chart when price action aligns with these retracement levels.
Conclusion
Multi-time frame analysis is an essential tool for traders. By examining multiple time frames, they can gain a comprehensive view of the market, and identify long-term trends while also pinpointing optimal entry and exit points on shorter time frames. This method helps confirm trends, spot potential reversals, and manage risk more effectively.
By aligning signals across different time frames, traders can increase the likelihood of successful trades. This approach is especially useful in volatile markets, where quick adjustments are necessary, and in range-bound markets, where understanding the broader context is key to making profitable decisions.
Incorporating other analytical methods, such as Elliott Wave Theory and Fibonacci retracements, further enhances the power of multi-time frame analysis. These combined techniques provide deeper insights and lead to the development of more robust trading strategies.
To know more about the usage of multi-timeframe analysis in trading, read this comprehensive guide: Trading Fractals: The Power of Multi-Time Frame Analysis.
Sign Up Now