


Ready to see the market clearly?
Sign up now and make smarter trades today
Futures
July 27, 2026
SHARE
Real-Time Stock Futures Trading Guide
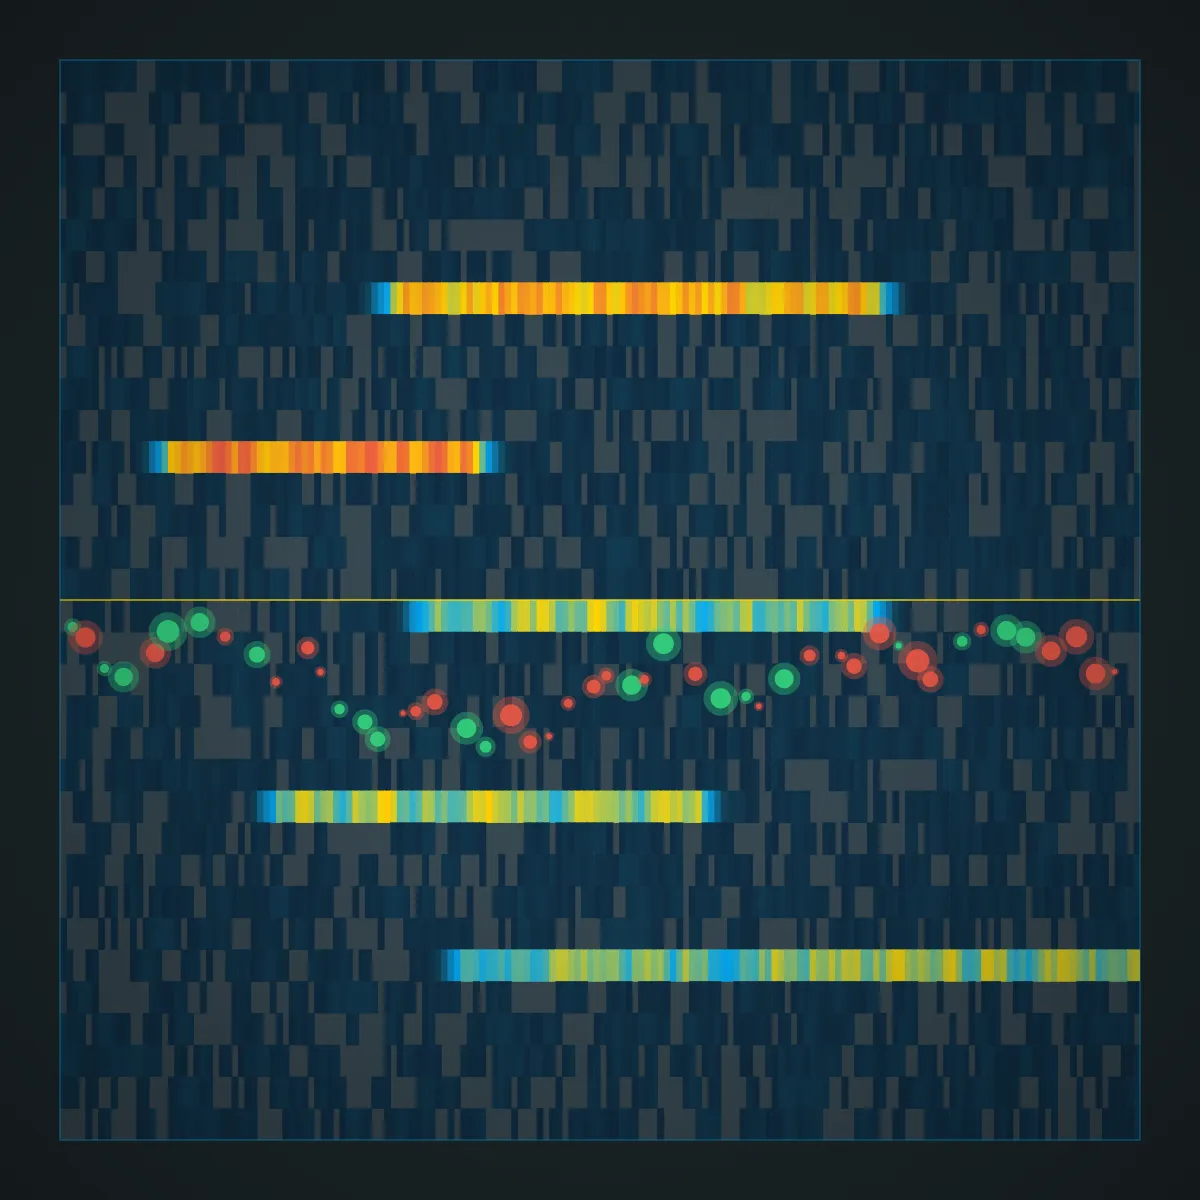 Access live streaming stock futures charts and real-time market data for major equity index futures—including the E-mini S&P 500 (/ES), Nasdaq-100 (/NQ), and Dow Jones (/YM)—through electronic futures exchanges operating nearly 24 hours a day. Professional traders use these live feeds to monitor overnight market sentiment, liquidity, and price discovery before the regular stock market opens. While price alone provides valuable context, combining live futures data with order book depth and order flow analysis provides a more complete understanding of how markets are likely to behave.
Table of Contents
- What Are Real-Time Stock Futures?
- Why Futures Trade Before the Stock Market Opens
- Real-Time Stock Futures Charts and Streaming Market Data
- Live Index Futures Quotes Explained
- Level 1 vs. Level 2 Futures Market Data
- How to Read Live Order Book Depth
- Choosing a Real-Time Futures Data Feed
- Common Mistakes When Using Live Futures Data
- How Order Flow Improves Futures Analysis
- Conclusion
- FAQ
What Are Real-Time Stock Futures?
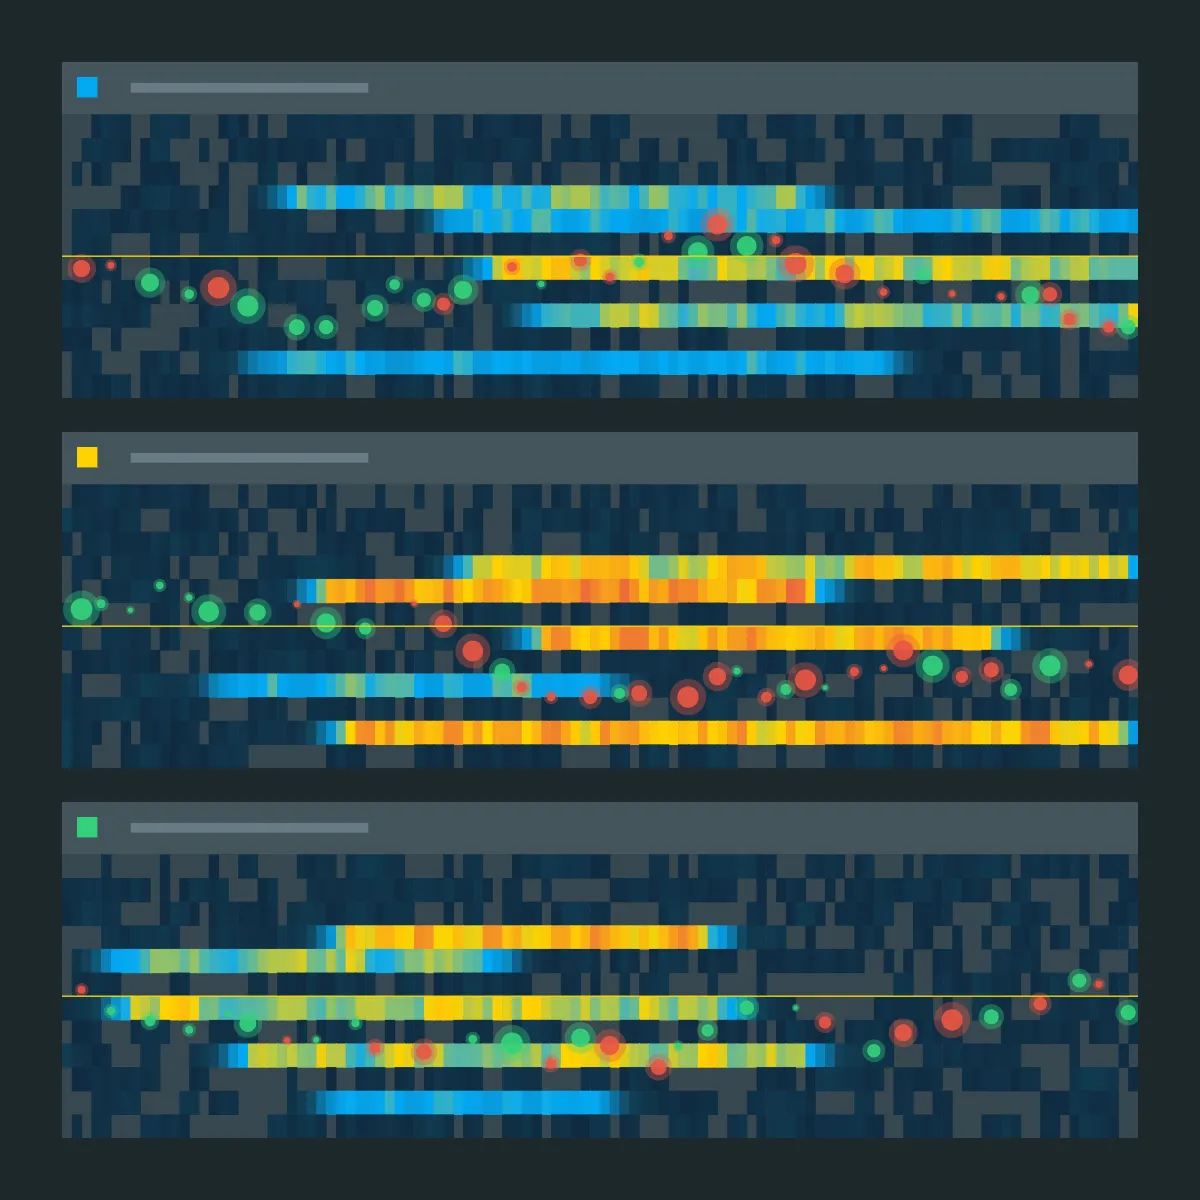
Stock index futures are standardized derivative contracts that allow traders to speculate on—or hedge against—the future value of major stock market indices such as the S&P 500, Nasdaq-100, Dow Jones Industrial Average, and Russell 2000.
Unlike stocks, futures contracts trade on centralized futures exchanges and operate for nearly 24 hours a day during the trading week. This extended schedule allows traders worldwide to react immediately to breaking news, economic releases, corporate earnings, geopolitical events, and changes in market sentiment long before traditional stock exchanges open.
For many professional traders, real-time equity futures prices provide one of the earliest indicators of how the broader market may behave during the upcoming cash session.
For example, if a significant economic report is released overnight and E-mini S&P 500 futures immediately decline by 1%, traders know that the market is already reacting—even though the New York Stock Exchange has not yet opened.
This ability to monitor current futures market data gives traders valuable context before making trading decisions.
Rather than waiting for the opening bell, they can begin evaluating:
- overnight market sentiment
- developing support and resistance
- changing volatility
- liquidity conditions
- institutional positioning
Many investors also monitor stock market futures simply to understand whether markets appear stronger or weaker before the regular trading session begins.
While futures never guarantee how the cash market will open, they provide valuable information about how participants around the world are currently pricing risk.
Why Futures Trade Before the Stock Market Opens
One of the biggest differences between futures and stocks is trading hours.
Most equity exchanges operate during regular business hours, while futures markets continue trading throughout much of the day and night through electronic exchanges such as CME Globex.
This extended schedule exists because financial markets have become increasingly global.
Important events rarely occur only during U.S. market hours.
Central banks announce monetary policy.
Governments release economic statistics.
Companies publish earnings.
Geopolitical events unfold.
International markets react.
By allowing futures to trade almost continuously, market participants can adjust positions immediately rather than waiting until the following morning.
Overnight Globex Trading
The overnight Globex session often begins shortly after the regular U.S. session closes and continues until the following trading day.
During this period, traders monitor:
- developments in Asian markets
- European equity performance
- commodity price movements
- currency fluctuations
- interest rate expectations
- macroeconomic releases
This is why many traders actively follow overnight Globex stock futures live tracking even if they have no intention of placing trades overnight.
Understanding how futures evolve while the stock market is closed provides valuable context for the next day’s opening session.
Example
Imagine the S&P 500 cash market closes at 4:00 PM ET.
Several hours later, Japan reports significantly stronger-than-expected GDP growth.
Asian equity markets rally.
European indices follow higher.
Throughout the night, E-mini S&P 500 futures continue climbing.
By the time New York opens the following morning, traders already have a strong indication that global sentiment has improved.
Rather than being surprised by a gap higher, they have already observed the market’s overnight reaction.
Why Do Index Futures Move Before Market Open?
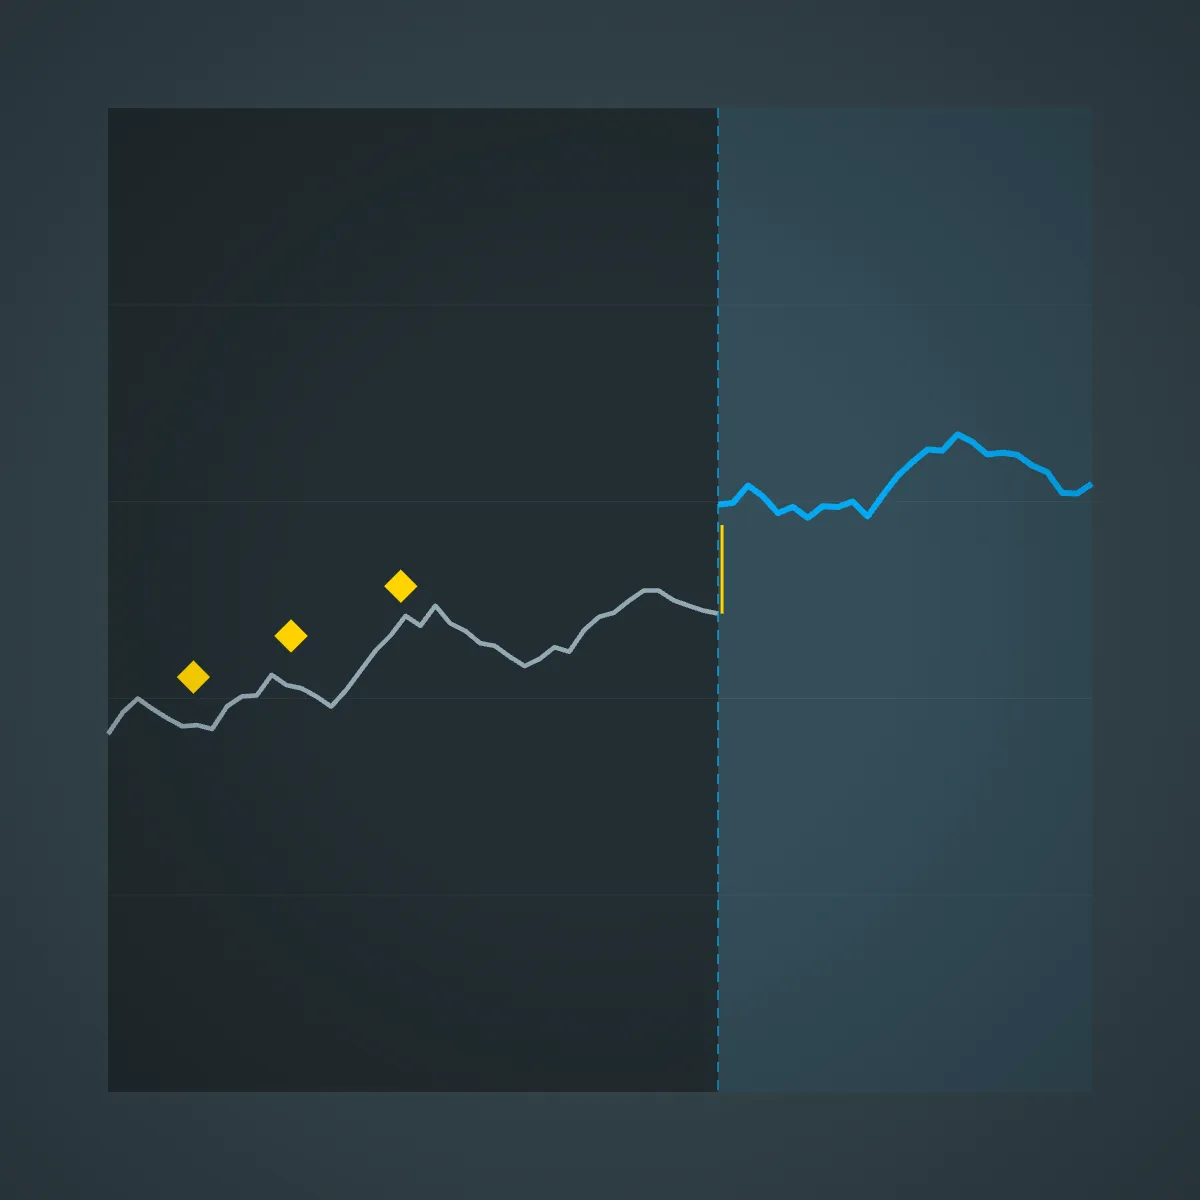
Many new traders wonder why futures continue moving while stocks appear “closed.”
The answer is simple.
Information never stops flowing.
Markets constantly incorporate new information into prices.
Common catalysts include:
- inflation reports
- employment data
- Federal Reserve announcements
- geopolitical developments
- corporate earnings
- commodity price shocks
- international market performance
Because futures markets remain open, they immediately reflect these developments.
This makes futures one of the most widely followed indicators of overnight market sentiment.
However, it’s important to remember that futures indicate probabilities—not certainties.
Conditions can change rapidly before the opening bell as additional news becomes available or liquidity increases during regular trading hours.
Real-Time Stock Futures Charts and Streaming Market Data
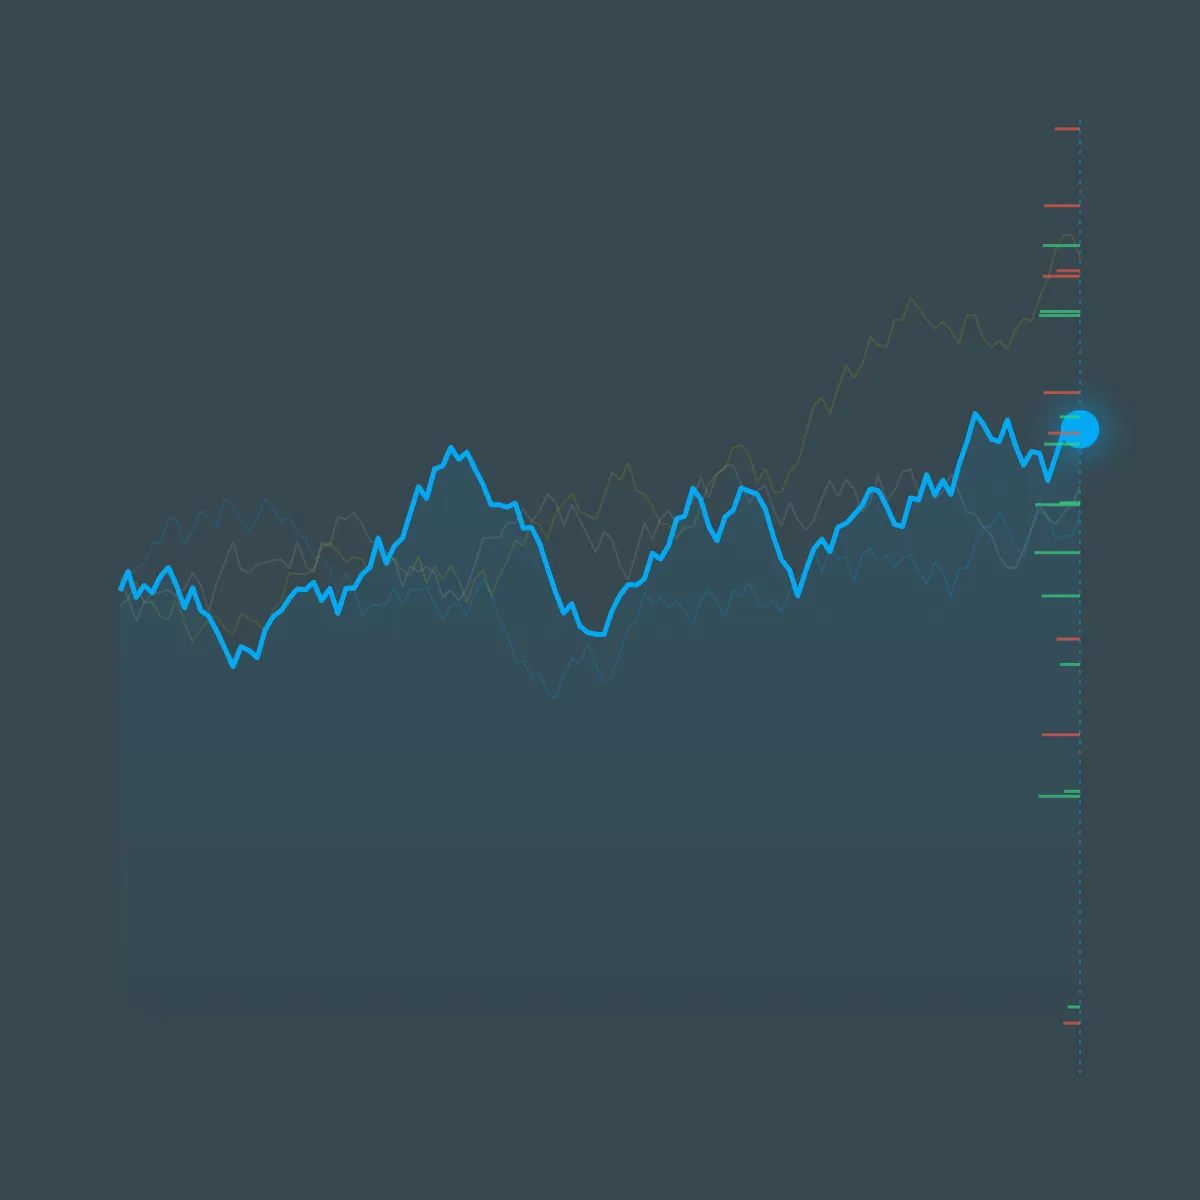
Access to streaming stock market futures has transformed how traders analyze financial markets.
Years ago, many retail investors relied on delayed quotes that updated every fifteen or twenty minutes.
Today, active traders increasingly depend on live streaming market data that updates continuously as orders enter the market.
This difference is far more significant than many beginners realize.
Imagine two traders watching the same futures contract.
One receives delayed pricing.
The other receives real-time updates.
During periods of high volatility, dozens—or even hundreds—of transactions may occur before the delayed chart refreshes.
The trader viewing live data sees every development as it unfolds.
The delayed trader only sees the final result.
For active strategies, that difference can be substantial.
Professional traders therefore prioritize:
- low-latency data
- reliable exchange connectivity
- continuous updates
- accurate timestamps
- stable market feeds
This is especially important for traders who make decisions based on very short-term price movement.
Whether monitoring live index futures quotes or following instant stock index futures, the quality of incoming market data directly affects the quality of trading decisions.
What Makes Streaming Market Data Valuable?
Price alone only tells part of the story.
Streaming market data allows traders to observe how prices evolve rather than simply where they finish.
For example, suppose futures rise twenty points overnight.
That movement becomes much more informative when traders can also observe:
- how quickly prices moved
- whether buying accelerated or slowed
- how volatility changed
- where liquidity entered
- where resistance developed
Rather than seeing only the destination, traders observe the journey.
This additional context often helps explain market behavior more effectively than static end-of-session charts.
Professional trading firms therefore invest heavily in reliable derivative market price feeds capable of delivering continuous updates throughout the trading day.
These feeds become part of a much broader collection of global financial indicators streaming into analytical workstations.
Combined together, they allow traders to evaluate market conditions from multiple perspectives simultaneously.
Live Index Futures Quotes Explained
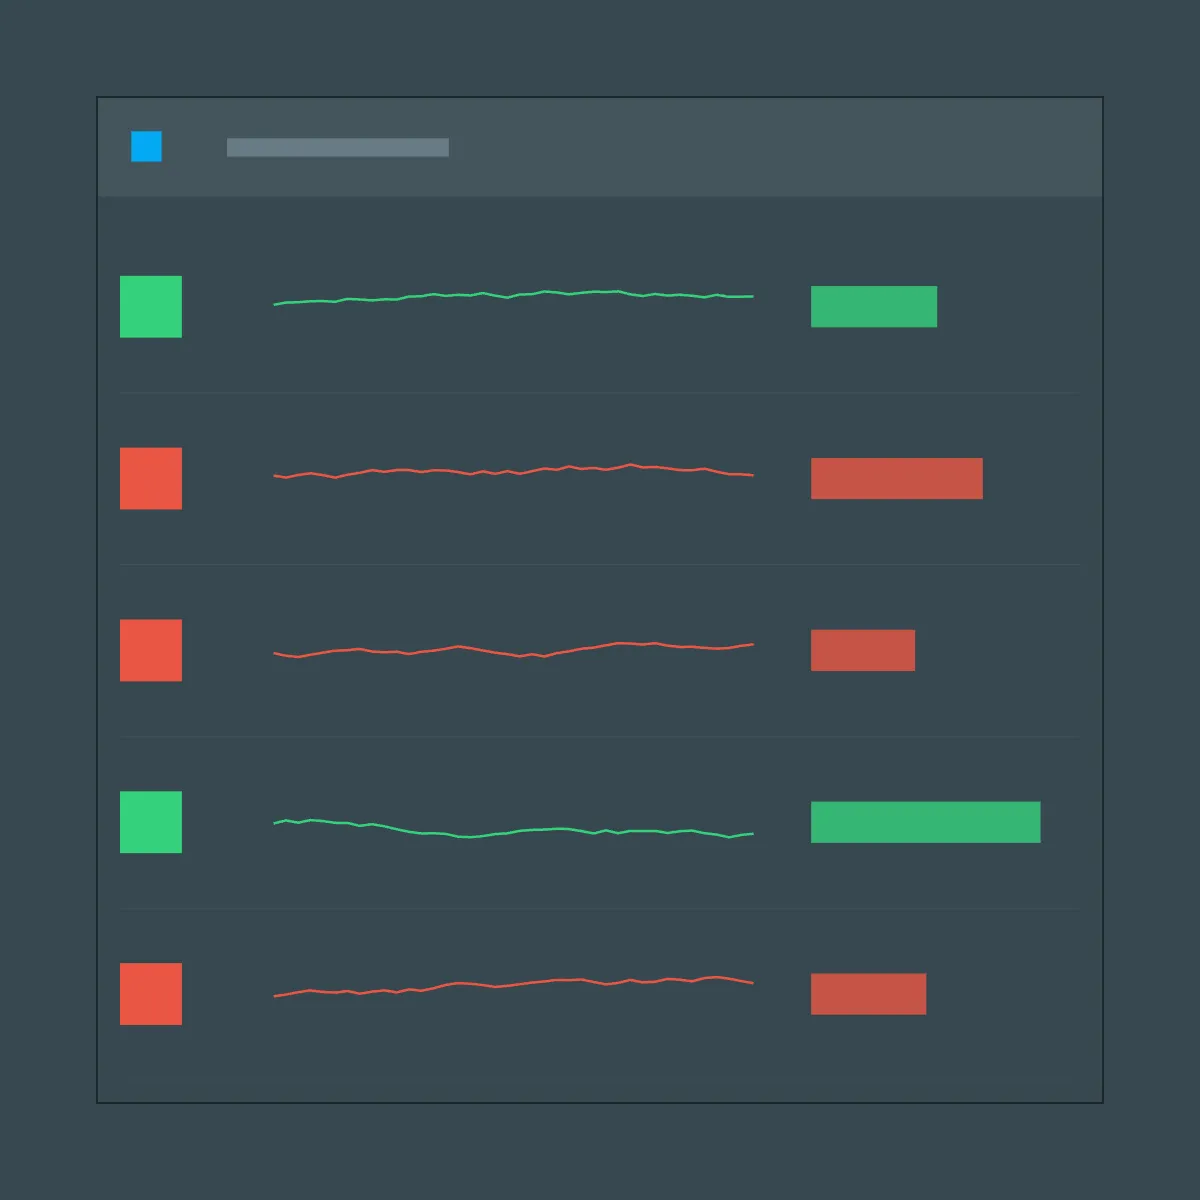
Most financial news outlets publish live index futures quotes before markets open.
These quotes typically display:
- current contract price
- daily change
- percentage change
- session high
- session low
- trading volume
Although useful, these headline numbers only scratch the surface.
Professional traders usually examine much more than the latest price.
They want to understand:
- how the market reached that price
- whether buyers or sellers are becoming more aggressive
- where liquidity is accumulating
- whether volatility is increasing
- whether institutional participation appears to be growing
This deeper level of analysis often separates active trading from simply monitoring market headlines.
A futures contract trading 0.8% higher before the opening bell may initially appear bullish.
However, if buying pressure is fading and liquidity is pulling away from higher prices, that apparent strength may not continue once the regular session begins.
Likewise, a futures market trading modestly lower overnight could quickly recover if buyers begin absorbing selling pressure at important support levels.
This illustrates why experienced traders rarely rely on price alone.
Instead, they combine price movement with market context, liquidity behavior, and execution data before drawing conclusions.
Level 1 vs. Level 2 Futures Market Data
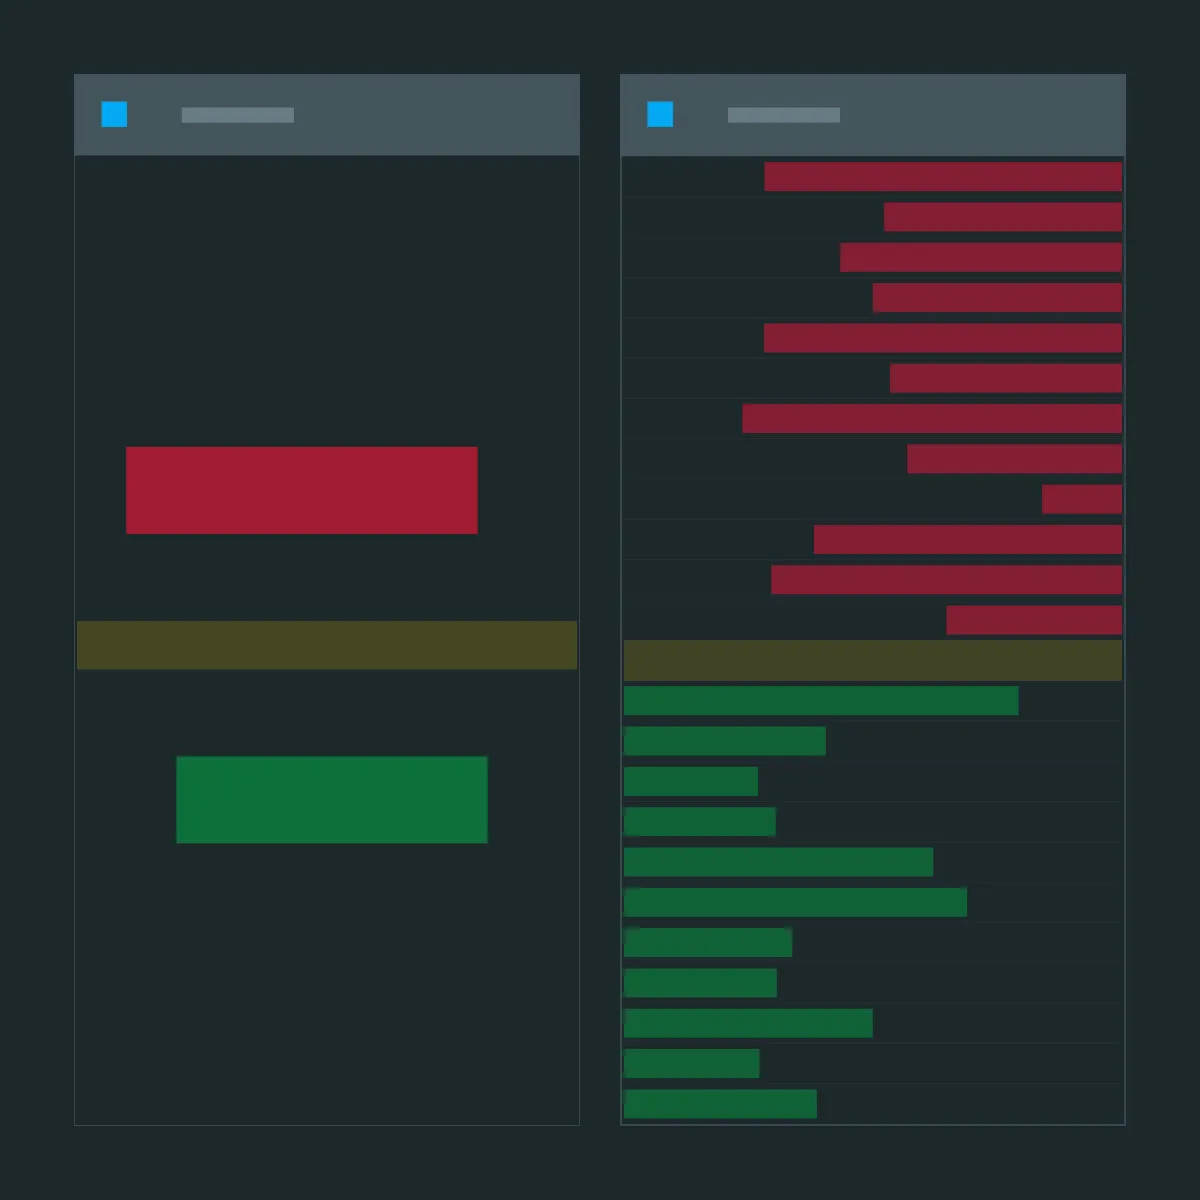
Not all market data provides the same amount of information.
Most trading platforms offer one of two primary data types:
Level 1 Market Data
Level 1 provides the essential information required to monitor market prices.
Typically this includes:
- last traded price
- current best bid
- current best ask
- daily high and low
- trading volume
For many investors, this information is sufficient.
Longer-term traders often make decisions using daily or weekly charts and therefore do not require continuous visibility into the entire order book.
However, active traders frequently need more detail.
Level 2 Market Data
Level 2 expands upon basic pricing by displaying multiple layers of the order book.
Instead of showing only the highest bid and lowest ask, Level 2 reveals:
- additional bid prices
- additional ask prices
- available liquidity
- market depth
- changing order sizes
This deeper view helps traders understand how supply and demand evolve in real time.
Many traders refer to this as the Depth of Market (DOM).
Watching the DOM allows traders to observe liquidity entering and leaving the market before price fully reacts.
For example, suppose buyers repeatedly place large resting bids just below current price.
That behavior may indicate increasing support.
Conversely, if those bids suddenly disappear, traders immediately recognize that market conditions have changed—even before price begins falling.
This additional transparency is one reason many active futures traders subscribe to CME Group Level 2 market data feeds rather than relying solely on basic pricing information.
Ultimately, whether you require Level 1 or Level 2 depends on your trading style.
Long-term investors may only need basic prices.
Scalpers, order flow traders, and active futures traders generally benefit from the richer information provided by market depth.
How to Read Live Order Book Depth
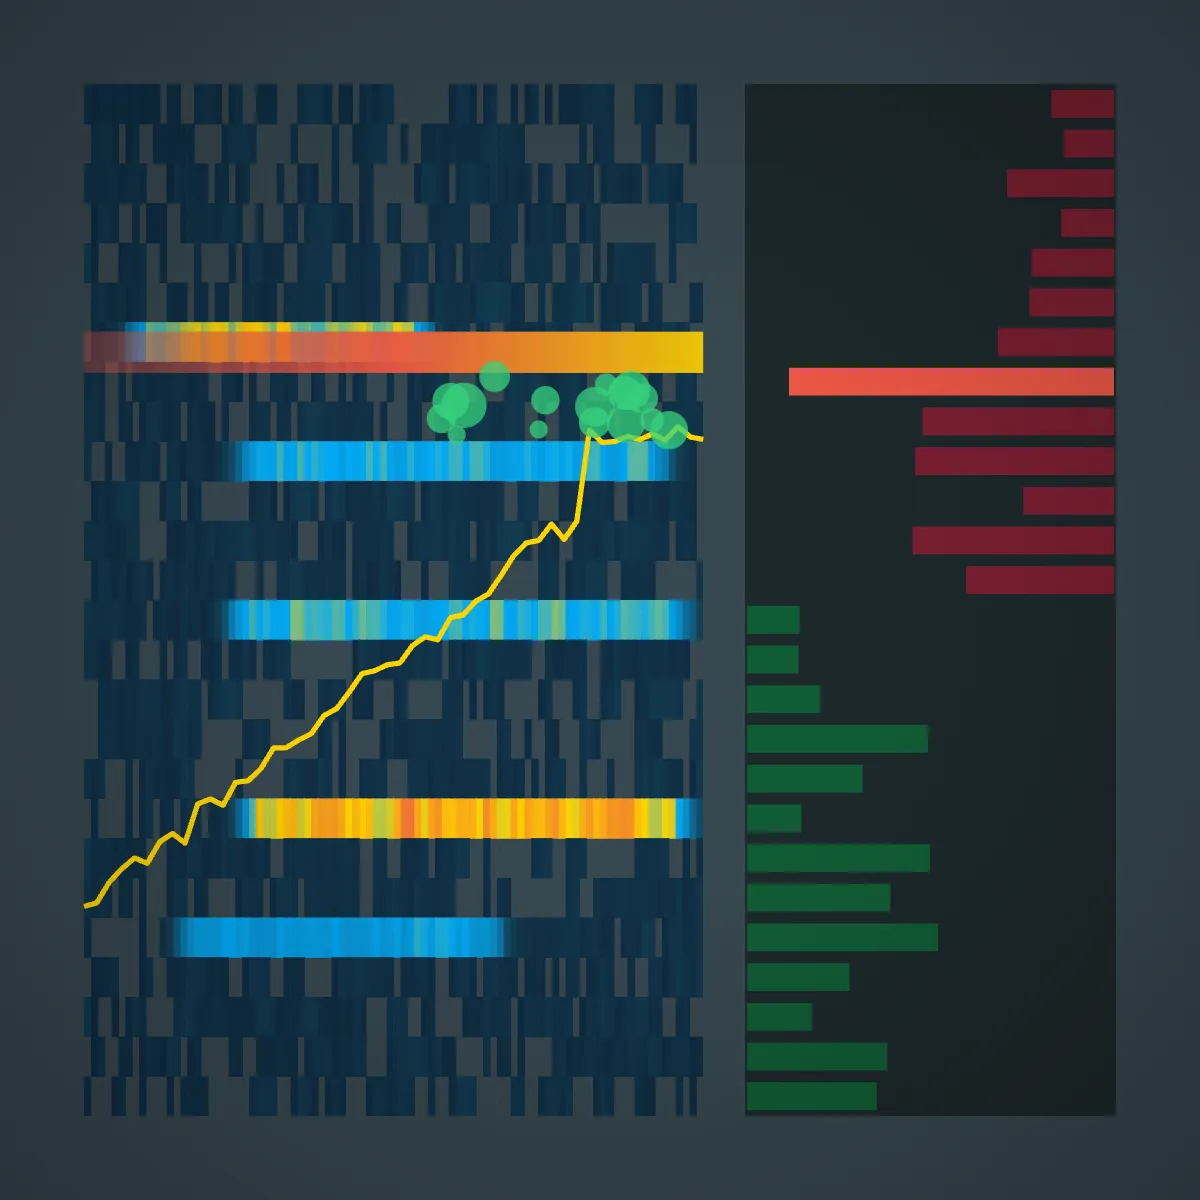
Watching futures prices alone tells you what happened. The order book helps explain why it happened.
An order book (often called the Depth of Market or DOM) displays the buy and sell orders currently resting in the market. These are orders waiting to be executed rather than trades that have already occurred.
Many traders begin by focusing exclusively on price, but experienced market participants often monitor how liquidity changes around price just as closely. The interaction between resting orders and executed trades can reveal important clues about market sentiment that aren’t obvious from candlestick charts alone.
For example, imagine the E-mini S&P 500 futures contract is approaching an important resistance level.
On a standard price chart, all you see is price moving toward resistance.
With order book depth, however, you may notice several different scenarios unfolding.
Scenario One: Liquidity Holds
Large sell orders remain stacked above price as buyers continue pushing upward.
Every attempt to move higher encounters significant supply.
Eventually, buyers slow down, momentum fades, and price begins rotating lower.
Although the resistance level looked identical on the chart, the order book revealed that sellers were actively defending that area.
Scenario Two: Liquidity Disappears
Price approaches the same resistance level.
Initially, large sell orders appear in the order book.
However, moments before price reaches them, those orders begin disappearing.
Instead of meeting heavy resistance, buyers suddenly find very little supply remaining.
Price accelerates upward.
To someone watching only price, this breakout may seem unexpected.
A trader monitoring order book depth, however, saw liquidity being removed before the breakout occurred.
Scenario Three: Absorption
Sometimes aggressive buying continues for several minutes, yet price barely moves.
At first glance this may seem confusing.
If buyers are so aggressive, why isn’t price rising?
The answer may be absorption.
Large passive sellers continue accepting every incoming buy order without allowing price to advance.
Eventually one side wins.
Either buyers consume enough liquidity to break through resistance, or sellers overwhelm demand and price reverses.
Understanding this interaction between aggressive orders and passive liquidity is one of the core advantages of order book analysis.
Rather than viewing price movement as random, traders begin observing the continuous negotiation occurring between buyers and sellers.
Choosing a Real-Time Futures Data Feed
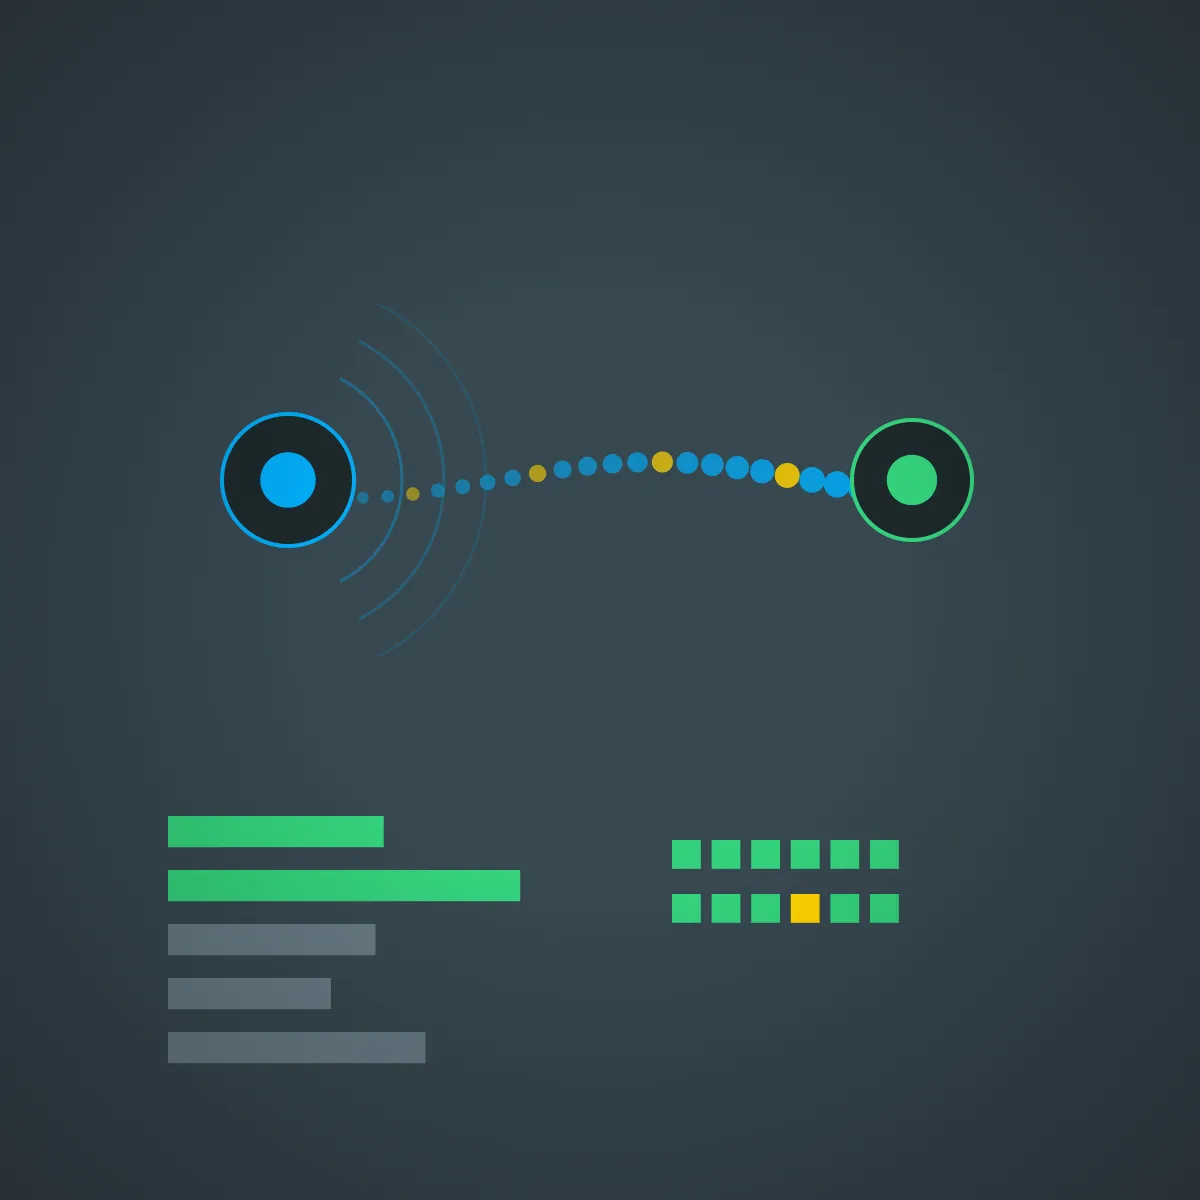
The quality of market data directly influences the quality of market analysis.
Even the most advanced trading software cannot compensate for delayed, incomplete, or unreliable data.
Before selecting a futures data feed, traders should consider several practical factors.
Exchange Coverage
Different providers offer access to different exchanges.
If your primary focus is U.S. equity index futures, you’ll typically want reliable CME market data.
Commodity traders may require additional exchanges depending on which products they trade.
Before subscribing, verify that your chosen data provider includes the markets you actually intend to trade.
Latency
Latency refers to the time required for market information to travel from the exchange to your platform.
For long-term investors, milliseconds generally make little difference.
For active futures traders, especially scalpers, lower latency becomes increasingly important.
Receiving market updates even a few moments earlier can provide additional time to evaluate developing conditions before submitting orders.
Historical Data
Real-time data is only part of the picture.
Many traders spend significant time reviewing previous trading sessions.
Historical replay allows traders to:
- study past market reactions
- review successful trades
- identify mistakes
- practice new strategies
- understand recurring market behavior
This type of deliberate practice often contributes more to long-term improvement than simply watching live markets every day.
Reliability
Markets occasionally experience periods of exceptional volatility.
Ironically, these are often the moments when reliable market data becomes most valuable.
Choose providers known for consistent uptime and stable connectivity rather than focusing exclusively on cost.
A cheaper feed that disconnects during major economic releases may ultimately prove far more expensive than a reliable professional solution.
Do You Need Real-Time Data?
Not every trader requires live market data.
Swing traders holding positions for several weeks often make decisions using daily or weekly charts.
Delayed pricing may be perfectly adequate for their workflow.
Day traders, however, generally rely on continuous streaming information.
Before subscribing, ask yourself:
- Are you actively trading intraday?
- Are you monitoring overnight Globex sessions?
- Do you need Level 2 market depth?
- Are you reviewing order flow in real time?
Answering these questions will help determine the type of market data that best fits your trading process.
Common Mistakes When Using Live Futures Data
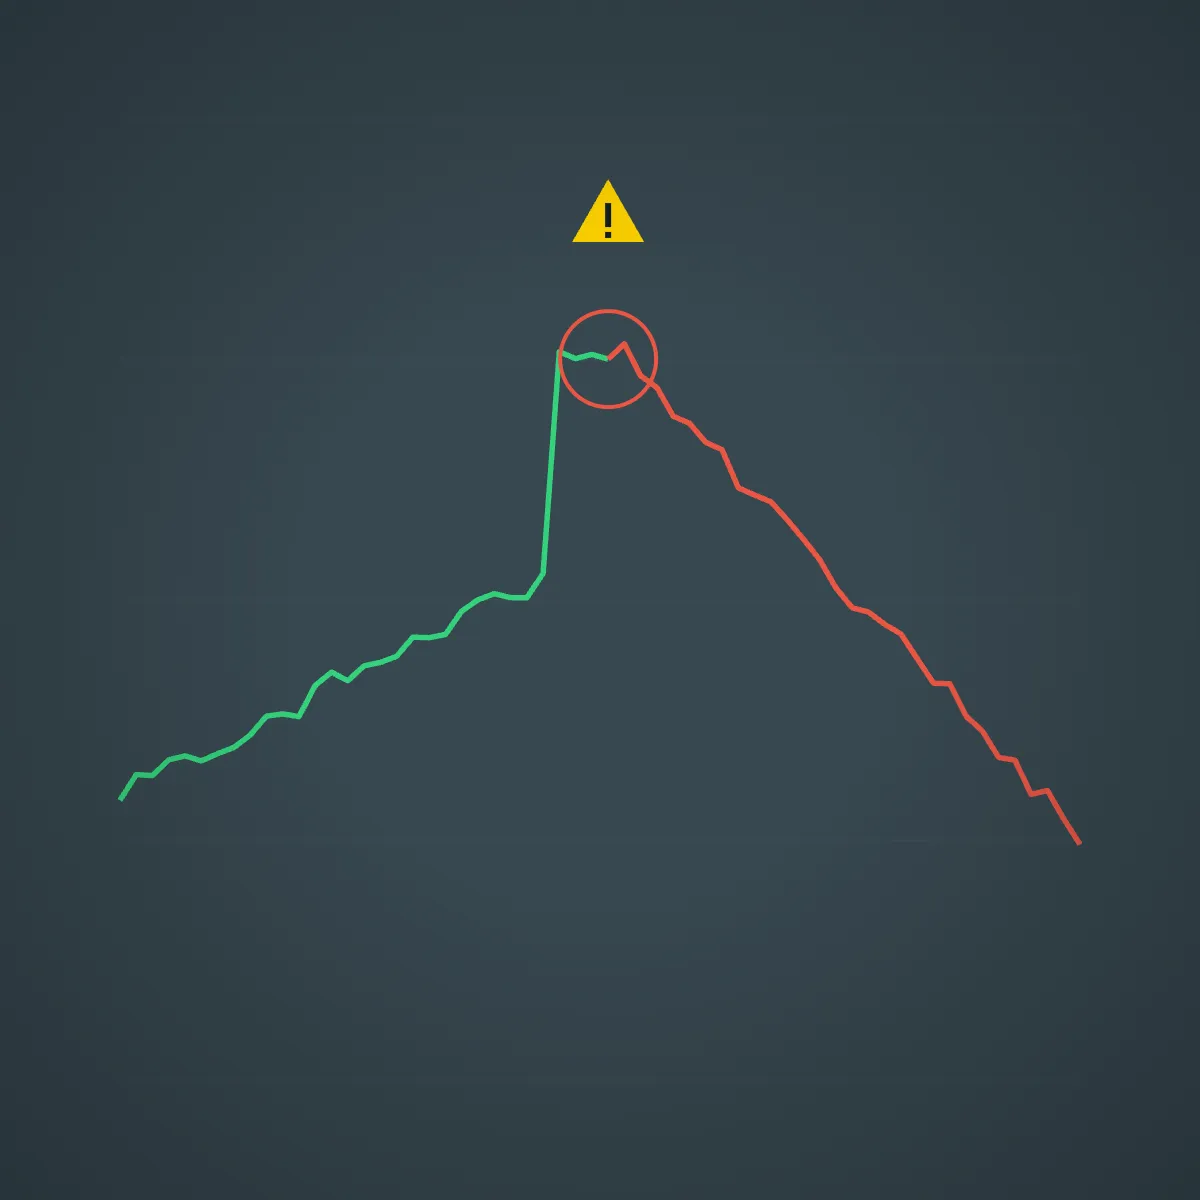
Access to real-time market data does not automatically improve trading performance.
In fact, many new traders become overwhelmed by the sheer volume of available information.
Understanding several common mistakes can help prevent unnecessary frustration.
Assuming Futures Predict the Cash Market
One of the most common misconceptions is believing futures perfectly forecast where stocks will open.
While futures provide valuable indications of market sentiment, they are not guarantees.
Unexpected news released minutes before the opening bell can completely change market direction.
Treat futures as one piece of evidence rather than a definitive prediction.
Watching Price Without Liquidity
Price shows the result.
Liquidity often explains the cause.
Many traders become fixated on price movement while ignoring whether buying or selling pressure is actually increasing.
Watching liquidity alongside price frequently provides a clearer understanding of market behavior.
Trading Every Overnight Move
Not every overnight move creates an opportunity.
Markets regularly overreact before stabilizing during the regular session.
Professional traders often wait for confirmation rather than immediately chasing overnight momentum.
Patience frequently produces higher-quality opportunities than reacting to every price fluctuation.
Ignoring Risk Management
Real-time data can create the illusion that traders always know what will happen next.
They do not.
Every trading decision still involves uncertainty.
No amount of market data removes the need for disciplined position sizing, predefined stop-loss levels, and consistent risk management.
Successful traders use better information—not to eliminate risk—but to make more informed decisions.
How Order Flow Improves Futures Analysis

Traditional price charts summarize completed market activity.
Order flow attempts to show how that activity develops while it is happening.
Instead of focusing only on where price has moved, traders begin observing:
- where liquidity is building
- where large participants are active
- how aggressive buyers and sellers interact
- whether important levels are holding or failing
- how supply and demand evolve over time
This additional layer of information often helps explain price movements that otherwise appear random.
Consider a practical example.
Suppose E-mini S&P 500 futures are approaching yesterday’s high.
A traditional chart simply shows price nearing resistance.
An order flow trader sees considerably more.
Large resting sell orders appear just above the previous high.
Aggressive buyers continue lifting offers.
Executed volume increases.
Suddenly, those resting sell orders disappear.
Buyers continue executing aggressively.
Price breaks higher.
The breakout becomes far easier to understand because traders observed the underlying liquidity changes rather than only the resulting price movement.
Likewise, the opposite situation can occur.
Price reaches resistance.
Buyers continue attacking.
Large sell orders remain in place.
Executed buying increases dramatically, yet price barely advances.
This may indicate absorption rather than breakout strength.
Instead of chasing higher prices, experienced traders recognize that sellers remain in control despite aggressive buying.
Platforms that combine real-time price, liquidity visualization, and order flow allow traders to interpret these interactions much more naturally than traditional charts alone.
Rather than replacing technical analysis, order flow adds another dimension that helps explain why markets behave the way they do.
Conclusion
Real-time stock futures provide some of the earliest insights into market sentiment, allowing traders to monitor overnight developments, economic releases, and changing liquidity before the regular trading session begins.
However, prices alone rarely tell the complete story.
Understanding how liquidity changes, how buyers and sellers interact, and how market depth evolves provides additional context that many active traders find invaluable.
Whether your goal is preparing for the opening bell, monitoring overnight Globex activity, or actively trading futures throughout the session, combining reliable real-time market data with thoughtful analysis can significantly improve decision-making.
For traders looking to move beyond traditional price charts, Bookmap combines real-time futures data with advanced visualization of liquidity, market depth, and order flow to help make complex market behavior easier to interpret.
FAQ
What are real-time stock futures?
Real-time stock futures are continuously updated prices for equity index futures contracts such as the E-mini S&P 500, Nasdaq-100, and Dow Jones. They allow traders to monitor market sentiment nearly 24 hours a day before and during the regular trading session.
Why do stock futures trade overnight?
Stock index futures trade through electronic exchanges such as CME Globex, allowing markets to react immediately to economic data, earnings reports, geopolitical events, and developments in international markets while traditional stock exchanges are closed.
What’s the difference between Level 1 and Level 2 futures market data?
Level 1 market data displays the latest traded price, best bid, best ask, and trading volume. Level 2 market data adds multiple levels of the order book, allowing traders to monitor market depth and changing liquidity.
How can I access real-time CME futures data?
Real-time CME data is typically available through brokers and trading platforms that offer licensed exchange data. Access often requires an active market data subscription, with different options depending on whether you need Level 1 or Level 2 information.
Are futures prices always accurate predictors of the stock market open?
No. Futures provide valuable indications of overnight market sentiment but cannot predict the opening session with certainty. Additional news, changing liquidity, and market participation before the opening bell can significantly alter market direction.
What is order book depth?
Order book depth shows the quantity of buy and sell orders resting at different price levels beyond the current bid and ask. Traders use this information to evaluate liquidity, identify potential support and resistance, and better understand market structure.
Can beginners benefit from real-time futures charts?
Yes. While beginners may not immediately need advanced market depth analysis, learning how futures respond to economic events and overnight developments helps build a stronger understanding of market behavior and price discovery.
How does order flow complement futures trading?
Order flow adds context to price movement by showing how liquidity, executed trades, and market participation evolve in real time. Combined with traditional chart analysis, it can help traders better understand breakouts, reversals, absorption, and changing market sentiment.
Sign Up Now