See earnings more clearly in real time.
Compare plans to access deeper market visibility for earnings.
Trading Basics
July 19, 2024
SHARE
The Role of Earnings Reports in Swing Trading Strategies: Forecasting and Capitalizing on Market Movements

Do you wish to optimize your swing trading strategies? The key lies in anticipating price movements. Most successful swing traders prefer analyzing the earnings reports of a company to better gauge market sentiment. Let’s learn how to analyze and use these earnings reports for substantial gains.
In this article, we’ll start by explaining earnings reports and their key components, such as earnings per share (EPS), revenue, and forward guidance. You’ll understand the importance of these reports in assessing a company’s financial health and performance.
Also, we’ll discuss how traders can anticipate market reactions before an earnings release using consensus estimates and whisper numbers. You’ll understand how to interpret stock price movements and trade on price gaps following earnings announcements. By understanding concepts like Post-Earnings Announcement Drift (PEAD), you’ll be better equipped to capitalize on the momentum created by earnings surprises. Let’s begin.
Earnings Reports: An Overview
Earnings reports are formal documents released by publicly traded companies. These documents detail their financial performance over a specific period, usually a quarter or a fiscal year. Most investors and analysts use these reports as they provide a comprehensive overview of the company’s:
- Financial health
and
- Operational efficiency
Let’s have a look at some key components of an earnings report:
- Earnings Per Share (EPS)
- This is a critical metric indicating the portion of a company’s profit allocated to each outstanding share of common stock.
- The net income is divided by the number of outstanding shares to calculate the EPS.
- EPS serves as an indicator of a company’s profitability.
- It is closely watched by investors.
- Revenue:
- Revenue is also known as sales or turnover.
- It represents the total amount of money generated by the company’s business activities during the reporting period.
- It indicates a company’s ability to generate sales.
- It is often considered a fundamental indicator of business growth.
- Guidance
- This refers to the company’s projections or expectations for future financial performance.
- Guidance often includes forecasts for revenue, earnings, and other financial metrics.
- It helps investors and analysts make informed decisions about the company’s prospects.
Why are Quarterly Earnings Reports Important?

Quarterly earnings reports offer regular and timely insights into a company’s financial health and performance. By reporting quarterly, companies provide frequent updates on their financial performance. This reporting allows investors to track progress and make more timely decisions.
Additionally,
- Quarterly reports enable stakeholders to compare a company’s performance against
- Previous periods,
- Industry peers, and
- Market expectations.
- This comparison helps in assessing whether the company is improving, stagnating, or declining.
- Numerous studies have shown that quarterly earnings reports significantly influence a company’s stock price.
- Positive results often lead to stock price increases, while disappointing performance results in declines.
- Also, regular reporting ensures transparency and holds the company accountable to its shareholders.
Key Metrics in Earnings Reports
As discussed above, Earnings Per Share (EPS) is a financial metric, which calculates the portion of a company’s profit allocated to each outstanding share of common stock. Let’s check out its formula:
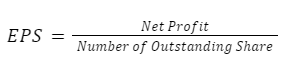
For example,
- Say a company reports a net income of $100 million.
- It has 10 million outstanding shares.
- In this case, the EPS would be $10
- This means each share is attributed $10 of the company’s net profit.
Why is EPS Crucial?
EPS is crucial for several reasons:
- Indicator of Profitability
- Measure of Financial Performance
- EPS provides a direct measure of a company’s profitability on a per-share basis.
- This makes it easier to compare performance across different companies regardless of their size.
- Comparison Over Time
- By tracking EPS over multiple periods, investors can assess whether a company’s profitability is
- Improving,
- Stable, or
- Declining.
- By tracking EPS over multiple periods, investors can assess whether a company’s profitability is
- Measure of Financial Performance
- Influence on Stock Prices
- Market Perception
- Generally, higher EPS values indicate better profitability.
- It leads to higher stock prices as investors perceive the company to be more valuable.
- Investment Decisions
- Investors often use EPS as a benchmark for making investment decisions.
- Consistent increases in EPS are seen as a sign of robust financial health and growth potential.
- This situation attracts more investors.
- Market Perception
- Insight into Earnings Growth:
- Growth Indicator
- A growing EPS indicates that the company is
- Generating higher profits
- A growing EPS indicates that the company is
- Growth Indicator
and
- Managing its resources efficiently.
- Signal of Issues
- On the other hand, a declining EPS signals issues within the company, such as
- Reduced profits,
- Increased costs, or
- Dilution of shares.
- These issues prompt investors to scrutinize the underlying causes.
- On the other hand, a declining EPS signals issues within the company, such as
Let’s understand better with the help of an example:
- Say a company has a net income of $100 million and 10 million outstanding shares.
- It reports an EPS of $10.
- This means each share is entitled to $10 of the company’s profits.
- A trader notices a consistent increase in this EPS over time.
- They view it as a strong signal of the company’s financial health and growth potential.
- Thus, they make investments in the company.
Why are Revenue Figures Significant?
Revenue is commonly known as the “top line.” That’s because it appears at the top of the income statement. The revenue figures represent the total amount of money generated by the sale of goods or services related to a company’s primary operations.
It is a fundamental metric for assessing a company’s ability to generate sales. Let’s learn what investors can assess by examining the revenue figures.
- Total Sales Indicator
- Primary Metric
- Revenue is a direct measure of a company’s sales performance.
- It reflects the effectiveness of the company’s
- Sales and marketing strategies,
- Pricing, and
- Product demand.
- Sales Volume Insight
- It provides insights into the volume of goods or services sold.
- Also, revenue offers a snapshot of the company’s
- Market position
- Primary Metric
and
- Competitive strength.
- Business Expansion Indicator
- Growth Signal
- Revenue growth is a clear indicator of business expansion.
- A consistent rise in revenue suggests that the company is successfully:
- Increasing its market share,
- Enhancing its product offerings, or
- Expanding into new markets.
- Operational Efficiency
- Steady revenue growth also indicates operational efficiency, as the company can meet market demand effectively.
- Growth Signal
- Market Demand Reflection
- Customer Demand
- Increasing revenue signals strong market demand for the company’s products or services.
- It shows that consumers are willing to spend money on what the company offers.
- Investor Attraction
- Investors often look for companies with a growing revenue trend.
- That’s because it often indicates potential for profitability and long-term growth.
- Customer Demand
For example,
- Say a company reports $500 million in revenue in this quarter.
- However, in the last quarter, the company reported a revenue of $450 million.
- It shows a growth trend.
- This upward trajectory attracts investors who are looking to expand companies with
- Strong market demand
and
- Operational effectiveness.
What is Forward Guidance and How Important is it?

Forward guidance refers to the management’s projections about the company’s future:
- Earnings,
- Revenue, and
- Other key metrics.
Normally, it includes forecasts for the next quarter or fiscal year. This kind of projection is crucial for setting market expectations. Let’s see how:
- Market Expectations
- Future Outlook
- Forward guidance provides insights into the company’s expectations for future performance.
- These help investors and analysts form an outlook on the company’s potential growth and profitability.
- Expectations Management
- It helps manage market expectations by offering a realistic projection of future performance based on current
- Trends,
- Strategic plans, and
- Market conditions.
- It helps manage market expectations by offering a realistic projection of future performance based on current
- Future Outlook
- Influence on Investor Sentiment
- Positive Guidance
- When a company provides positive forward guidance, it boosts investor confidence and leads to an increase in stock prices.
- This positive sentiment is based on the expectation of a strong future performance.
- Negative Guidance
- Conversely, negative guidance leads to a decline in stock prices.
- That’s because it indicates potential challenges or slower growth ahead.
- Positive Guidance
For example,
- Say a tech company projects a 10% revenue increase for the next quarter due to a new product launch.
- Now, traders might anticipate a stock price rise and plan their trades accordingly.
- This projection significantly influences
- Market sentiment
and
- Investor behavior.
- Being positive news, it drives stock prices up in anticipation of the expected growth.
How to Analyze Earnings Reports for Swing Trading?
To effectively analyze market expectations and sentiment before an earnings report is released, traders rely on two key metrics:
- Consensus estimates
and
- Whisper numbers
Let’s understand both in detail:
What are Consensus Estimates?
Consensus estimates represent the average earnings and revenue expectations of analysts who cover the stock. These estimates are compiled from various financial analysts’ projections. They provide a benchmark for anticipated company performance.
How do traders use it?
- Traders use consensus estimates to gauge the general expectations of the market.
- If a company’s actual earnings exceed these estimates, it often leads to a positive reaction in the stock price.
- Conversely, if the company falls short, it can lead to a negative reaction.
What are Whisper Numbers?
Whisper numbers are unofficial and speculative estimates. They often differ from consensus numbers and provide an alternative set of expectations. These expectations reflect more optimistic or pessimistic views than the consensus estimates.
Often, whisper numbers are based on:
- Informal information,
- Rumors, and
- Traders’ gut feelings about the company’s upcoming earnings.
How do traders use it?
- Traders monitor whisper numbers to gauge sentiment beyond the official analyst’s expectations.
- By anticipating how the actual earnings might compare to these estimates, traders can position themselves before the earnings release.
- For example,
- Say the consensus estimate predicts an EPS of $1.50.
- However, whisper numbers suggest $1.55.
- Now, traders anticipate a positive surprise and a long position.
- For example,
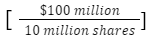
How to Interpret Stock Price Movements After Earnings Reports
It is essential to note that the immediate reaction of a stock price to an earnings report is often driven by the surprise element, “How do the actual results compare to expectations?” Now, when there is a positive surprise (earnings exceed expectations), it leads to a sharp increase in the stock price. Conversely, a negative surprise results in a quick decline.
Additionally, earnings reports can cause significant volatility. Stocks often experience large price swings immediately following the release as investors and traders react to the new information.
For Example,
- Say a company reports an EPS of $1.60.
- It beats the consensus estimate of $1.50 and the whisper number of $1.55.
- The positive surprise is likely to result in a swift increase in the stock price due to:
- Heightened investor optimism
and
- Increased demand.
How to Strategize?
When it comes to pre-earnings positioning, traders who anticipate an earnings beat might enter long positions before the report. If the earnings report confirms their expectations, they can capitalize on the price surge. On the other hand, after the earnings report, traders must analyze:
- The magnitude of the surprise
and
- The market’s reaction.
If the stock price has risen sharply, they can consider taking profits or holding for further gains if the outlook remains positive.
For example,
- Say a consensus estimate predicts an EPS of $2.00.
- But whisper numbers suggest $2.10.
- Now, traders can anticipate a positive surprise and take long positions.
Furthermore, it is noteworthy to state that if a stock is trading below its historical P/E ratio before the anticipated earnings beat, it might be considered undervalued. This situation presents a buying opportunity.
Detailed Example: Analyzing an Earnings Report from a Tech Company
To understand better, let’s study an example of how a swing trader might analyze an earnings report from a tech company. Consider the following earnings report details:
- Consensus EPS Estimate: $2.00
- Actual EPS Reported: $2.20
- Consensus Revenue Estimate: $1 billion
- Actual Revenue Reported: $1.05 billion
- Guidance: The company raised its guidance for the next quarter.
Market Reaction
- Positive Surprise: The company beat both EPS and revenue estimates and raised future guidance.
- Stock Price Movement: The stock might jump 5-10% in after-hours trading due to the positive earnings surprise and raised guidance.
- Trading Volume:
- A significant spike in trading volume post-announcement suggests increased investor interest.
- It also indicates the sustainability of the price movement.
The Trader’s Actions
| Pre-Announcement Positioning | Post-Announcement Reaction |
|
|
How Traders May React Based on Earnings Reports?
Several traders analyze the market after the release of the earnings reports using the concept of Post-Earnings Announcement Drift (PEAD). It highlights a phenomenon where a stock’s abnormal returns drift in the direction of an earnings surprise for several weeks or even months after the earnings announcement.
In simple words, Post-Earnings Announcement Drift (PEAD) means that, after a company announces its earnings, the stock price often keeps moving in the direction of the surprise (good or bad) for several weeks or even months. This occurs because:
- The market does not immediately and fully price in the new information revealed in the earnings report.
- Instead, the stock price continues to adjust as more investors process the news and react accordingly.
How to Capitalize on PEAD?
Traders can capitalize on PEAD by entering trades shortly after the earnings announcement. This way, they can take advantage of the momentum created by the earnings surprise.
For Example,
- Say a company reports a positive earnings surprise.
- This causes its stock price to increase by 5% immediately.
- Historical data indicates that such stocks usually gain an additional 3-4% over the next month.
- In this situation, a swing trader can enter a long position shortly after the announcement to ride this continued upward momentum.
How to Trade Price Gaps Following Earnings Announcements
It is pertinent to note that earnings announcements often lead to significant gaps in stock prices. These gaps could be either up or down, depending on whether the earnings surprise is:
- Positive
or
- Negative
These gaps present trading opportunities as they reveal strong market reactions to the earnings news. Traders can exploit these gaps by identifying key support and resistance levels that emerge after the earnings announcement.
For Example,
- Consider a stock that closes at $50 before an earnings announcement and opens at $55 after an earnings beat.
- If the price stabilizes and holds above $54, this new level may act as a support.
- A trader might enter a long position at $55, setting a stop-loss just below $54 to manage risk.
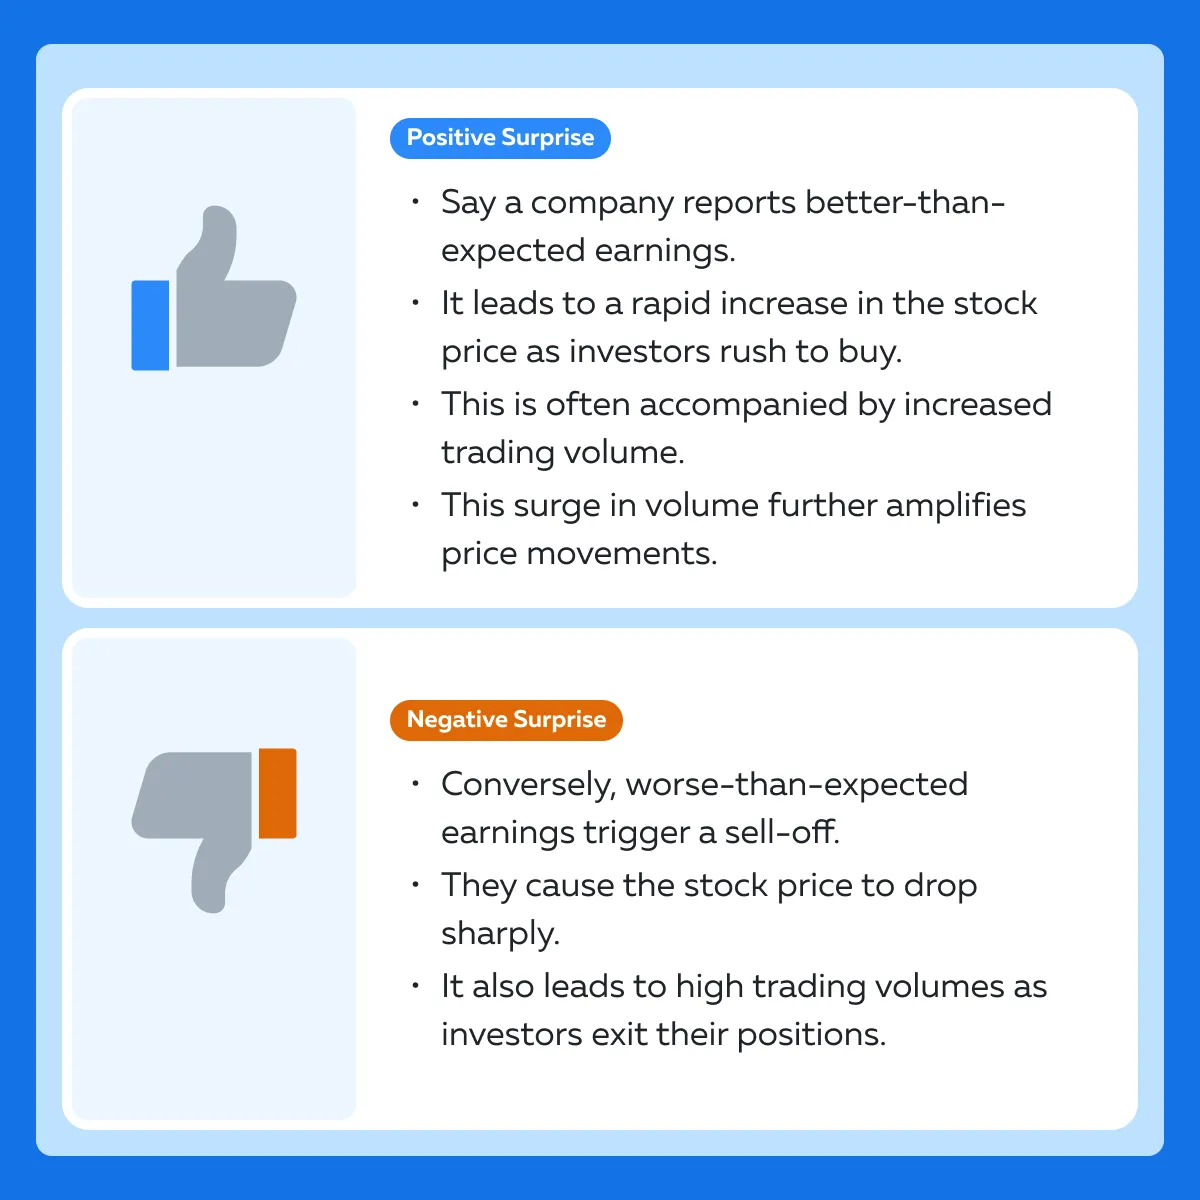
How Important are Sentiment Analysis and Subtle Cues?
Sentiment analysis is a part of subjective analysis. Following this, traders pay close attention to the language used in the earnings report and the conference call.
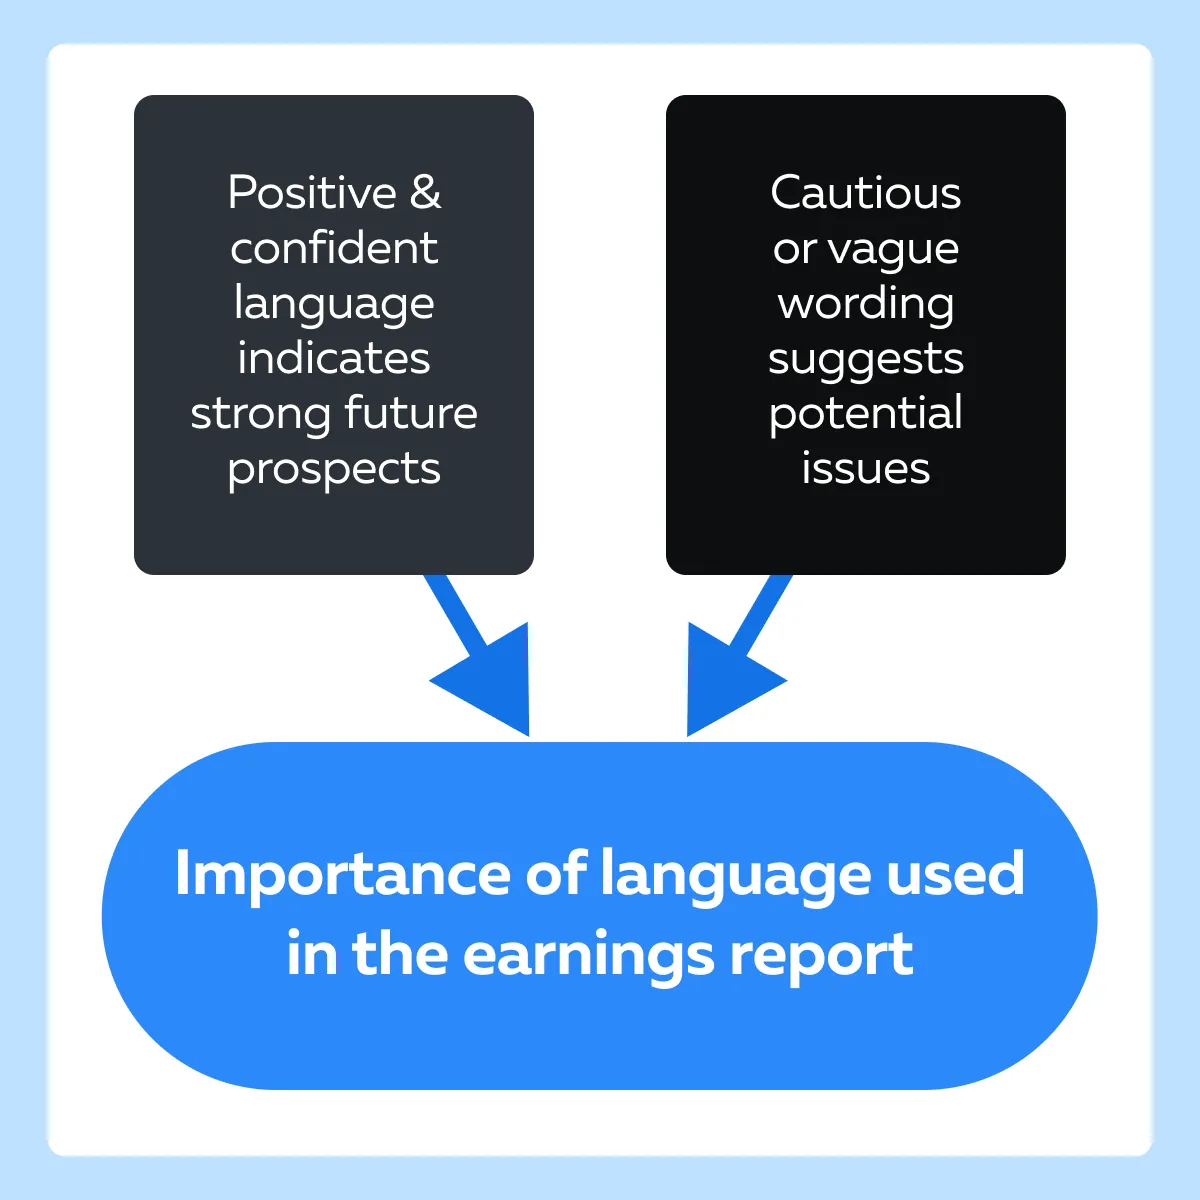
Additionally, traders also look for subtle hints about the company’s:
- Strategic direction
or
- Potential challenges
For Example:
- In an earnings call, the CEO repeatedly mentions the strong demand for a new product line and upcoming international expansion.
- This positive sentiment leads traders to anticipate continued stock price growth.
- It also reinforces their decision to enter a long-term position.
Conclusion
Earnings reports are crucial for swing trading. They provide valuable insights into a company’s financial health and prospects. These reports help traders understand stock price movements by revealing whether a company has met, exceeded, or fallen short of market expectations.
Often, positive earnings lead to price increases, while negative surprises cause declines. By analyzing these reports and understanding concepts like Post-Earnings Announcement Drift (PEAD) and trading price gaps, traders can make informed decisions to capitalize on market reactions.
Additionally, monitoring sentiment and subtle cues in the earnings reports further aids in predicting stock performance. For more strategies and insights on swing trading, visit this article on swing trading.
Sign Up Now