See market activity more clearly in real time.
Compare plans to access deeper market visibility for market activity.
Setups
March 31, 2024
SHARE
Trading Microsoft: Insights From the Bookmap Community
Microsoft is one of the oldest remaining technology companies in the world. Best known for its Windows operating system, it is also a popular stock to trade.
Let’s explore how the Bookmap community trades Microsoft.
A Brief Intro to Insights
Insights is a page of curated trading content produced by our diverse community across social media.
On the page, you can search for content by certain tags such as asset class (Futures, Stocks, Crypto), instrument (e.g. ES or BTCUSD), indicator (e.g. Stops & Icebergs), order flow phenomena (e.g. Aggressive Sellers), etc.
Setup #1: Liquidity Levels & VWAP
One of the tried-and-tested ways to trade effectively is by simply identifying areas of liquidity, something that the Bookmap allows you to do with its intuitive heatmap.
An early winner of the Blue Jacket content competition and member of Bookmap Academy Junior, JayLA is a big proponent of liquidity levels, both when trading APPL (Apple) as well as MFST (Microsoft).
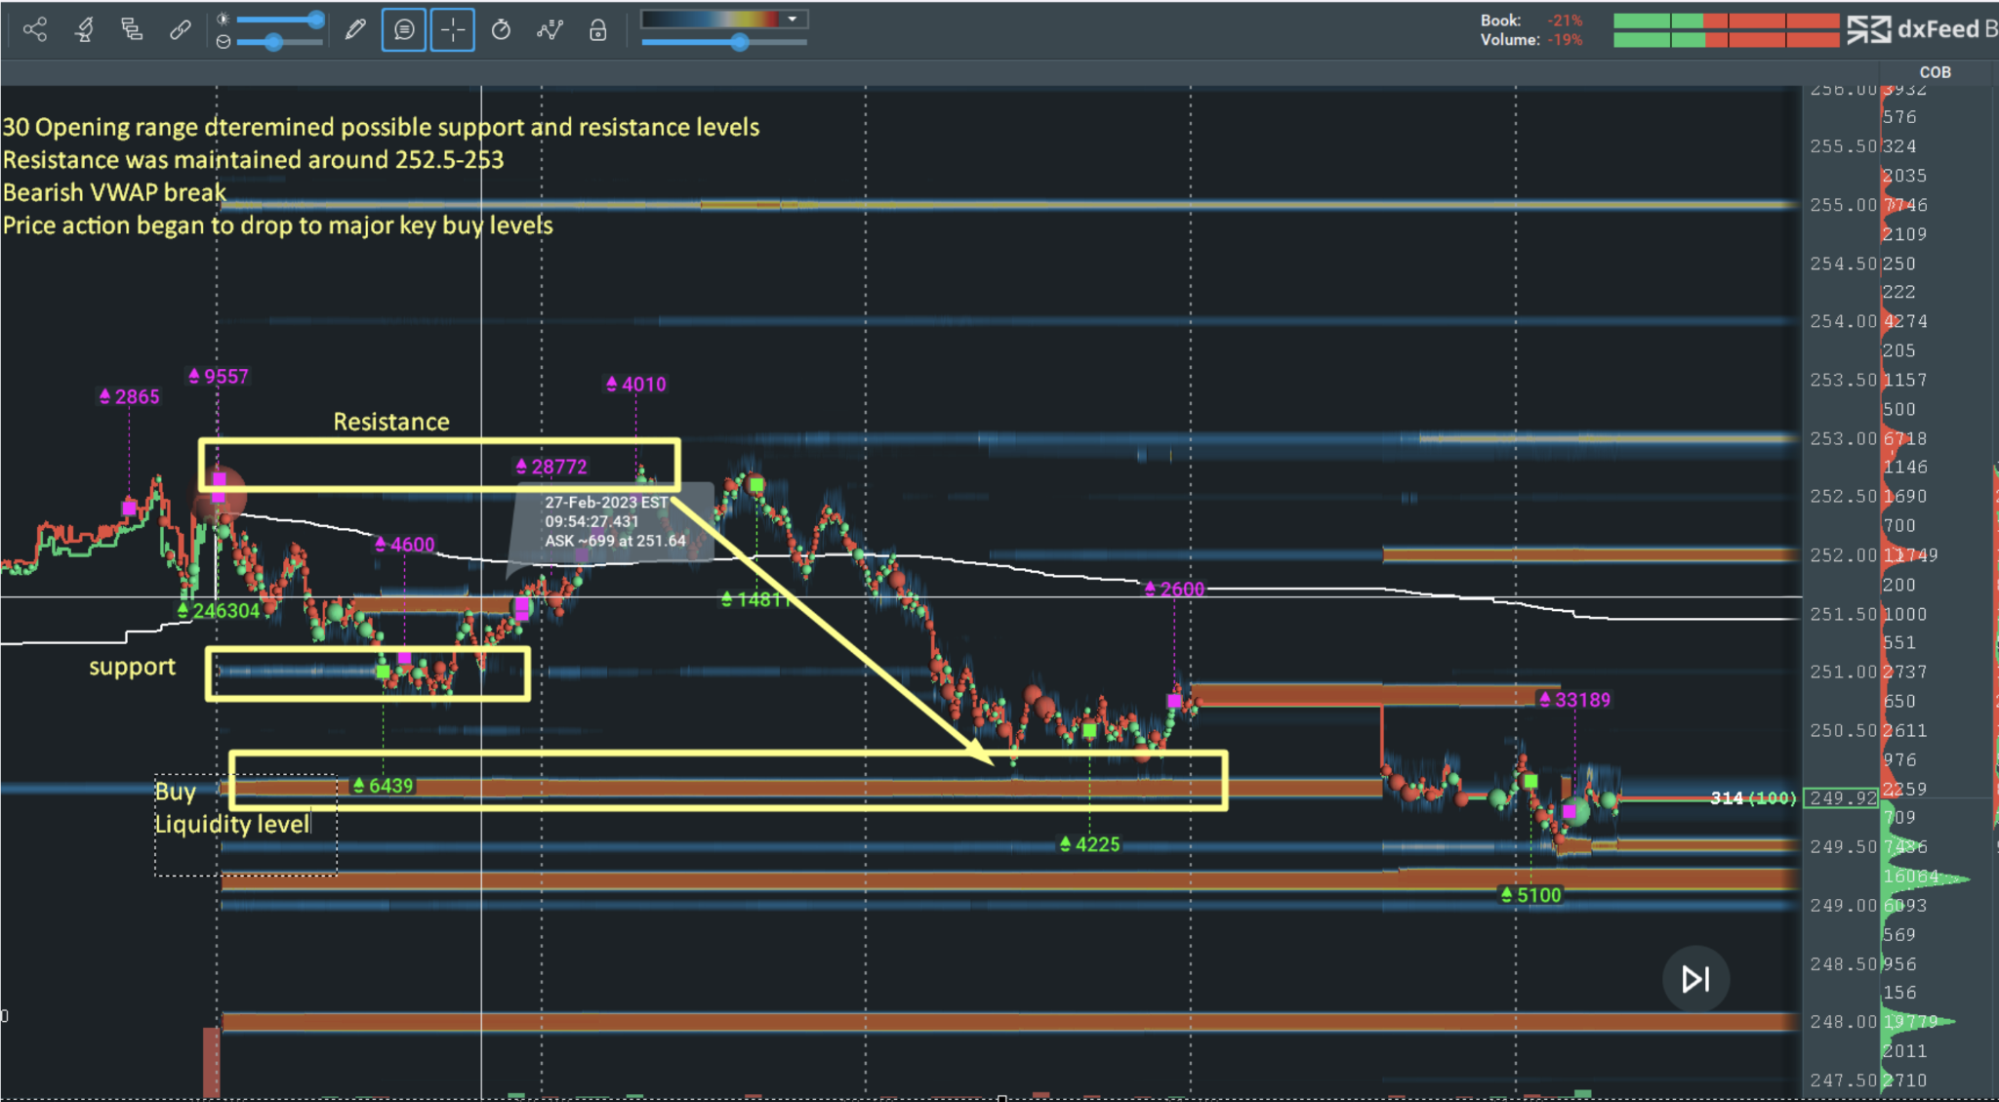
Above is an example of how JayLA analyses a trading pattern on MFST (Microsoft) using Bookmap. He notes the “short at resistance from opening range” and “bullish volume was not coming at 252.5 / 253 range”.
Then prices began to drop, breaking the VWAP and dropping towards “major liquidity levels”.
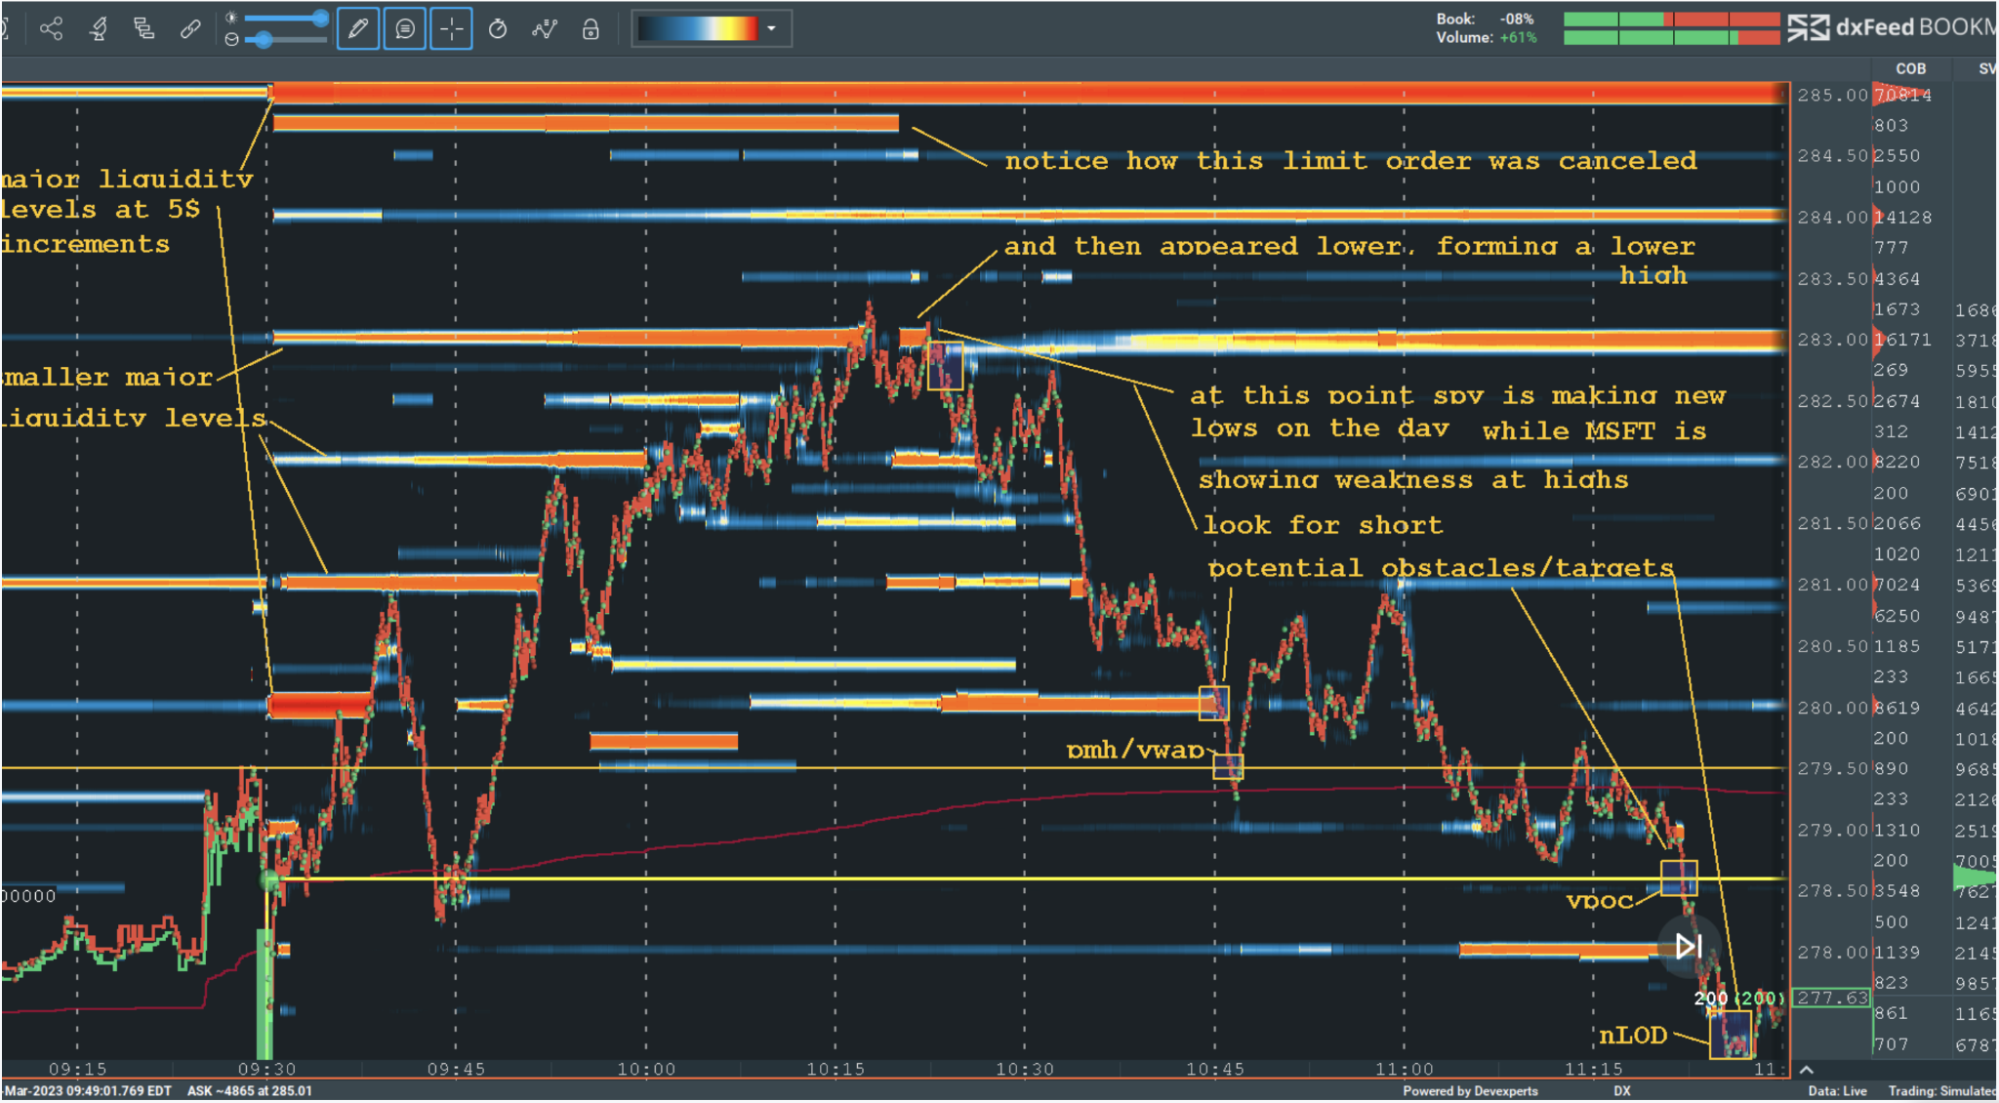
Next is another MFST chart for #bmbluejacket, this time from Barboza. He mentions that it’s “hindsight analysis”, and not a “playbook setup”. However, it is “something cool to see on BM with the limit orders for extra potential confirmation”.
Setup #2: Double Tops/Bottoms and Cumulative Volume Delta
Just because Bookmap is a cutting edge data visualization platform, doesn’t mean you can’t take advantage of old school chart patterns too. The volume dots represent actual traded volume (unlike bars, lines, and candlestick charts which just show the last traded price), the patterns are the same as in all the classic technical analysis handbooks.
Another Blue Jacket winner and current Bookmap Academy Junior member, Jec also utilizes double top and bottom patterns in his order flow analysis.
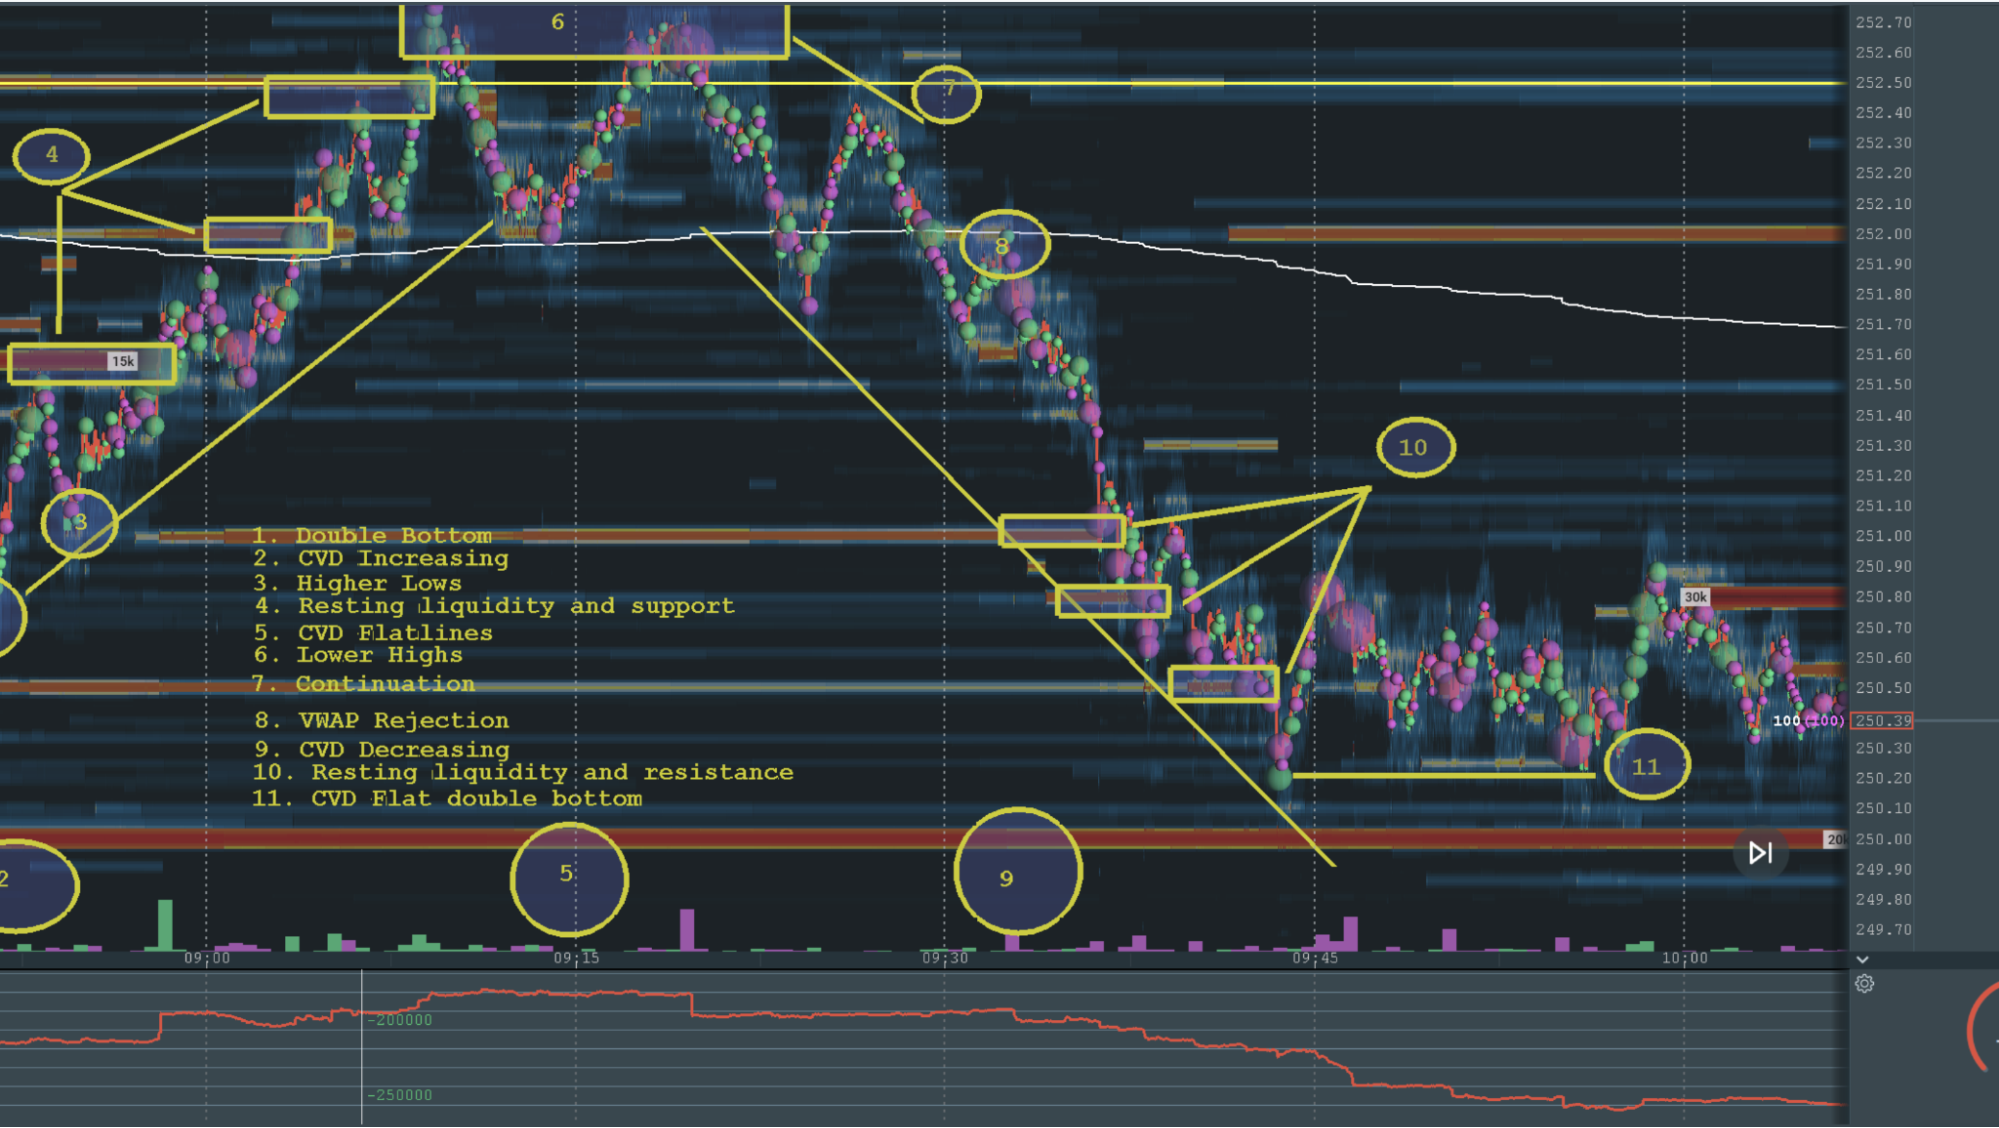
“Lower highs and a decreasing CVD setup a reversal and we faded the move back down to 250.30 before price made higher lowers and went sideways” – Jec
Along with a Double Bottom Pattern and CVD increasing, Jec writes that “We find continued uptrend support at liquidity levels before stalling and fading back to VWAP.”
Setup #3: Liquidity Levels, Absorption, and Gamma Strikes
Longtime Bookmap Academy trader and weekly Discord streamer DougP exposes what goes into his clean and effective trading strategy.
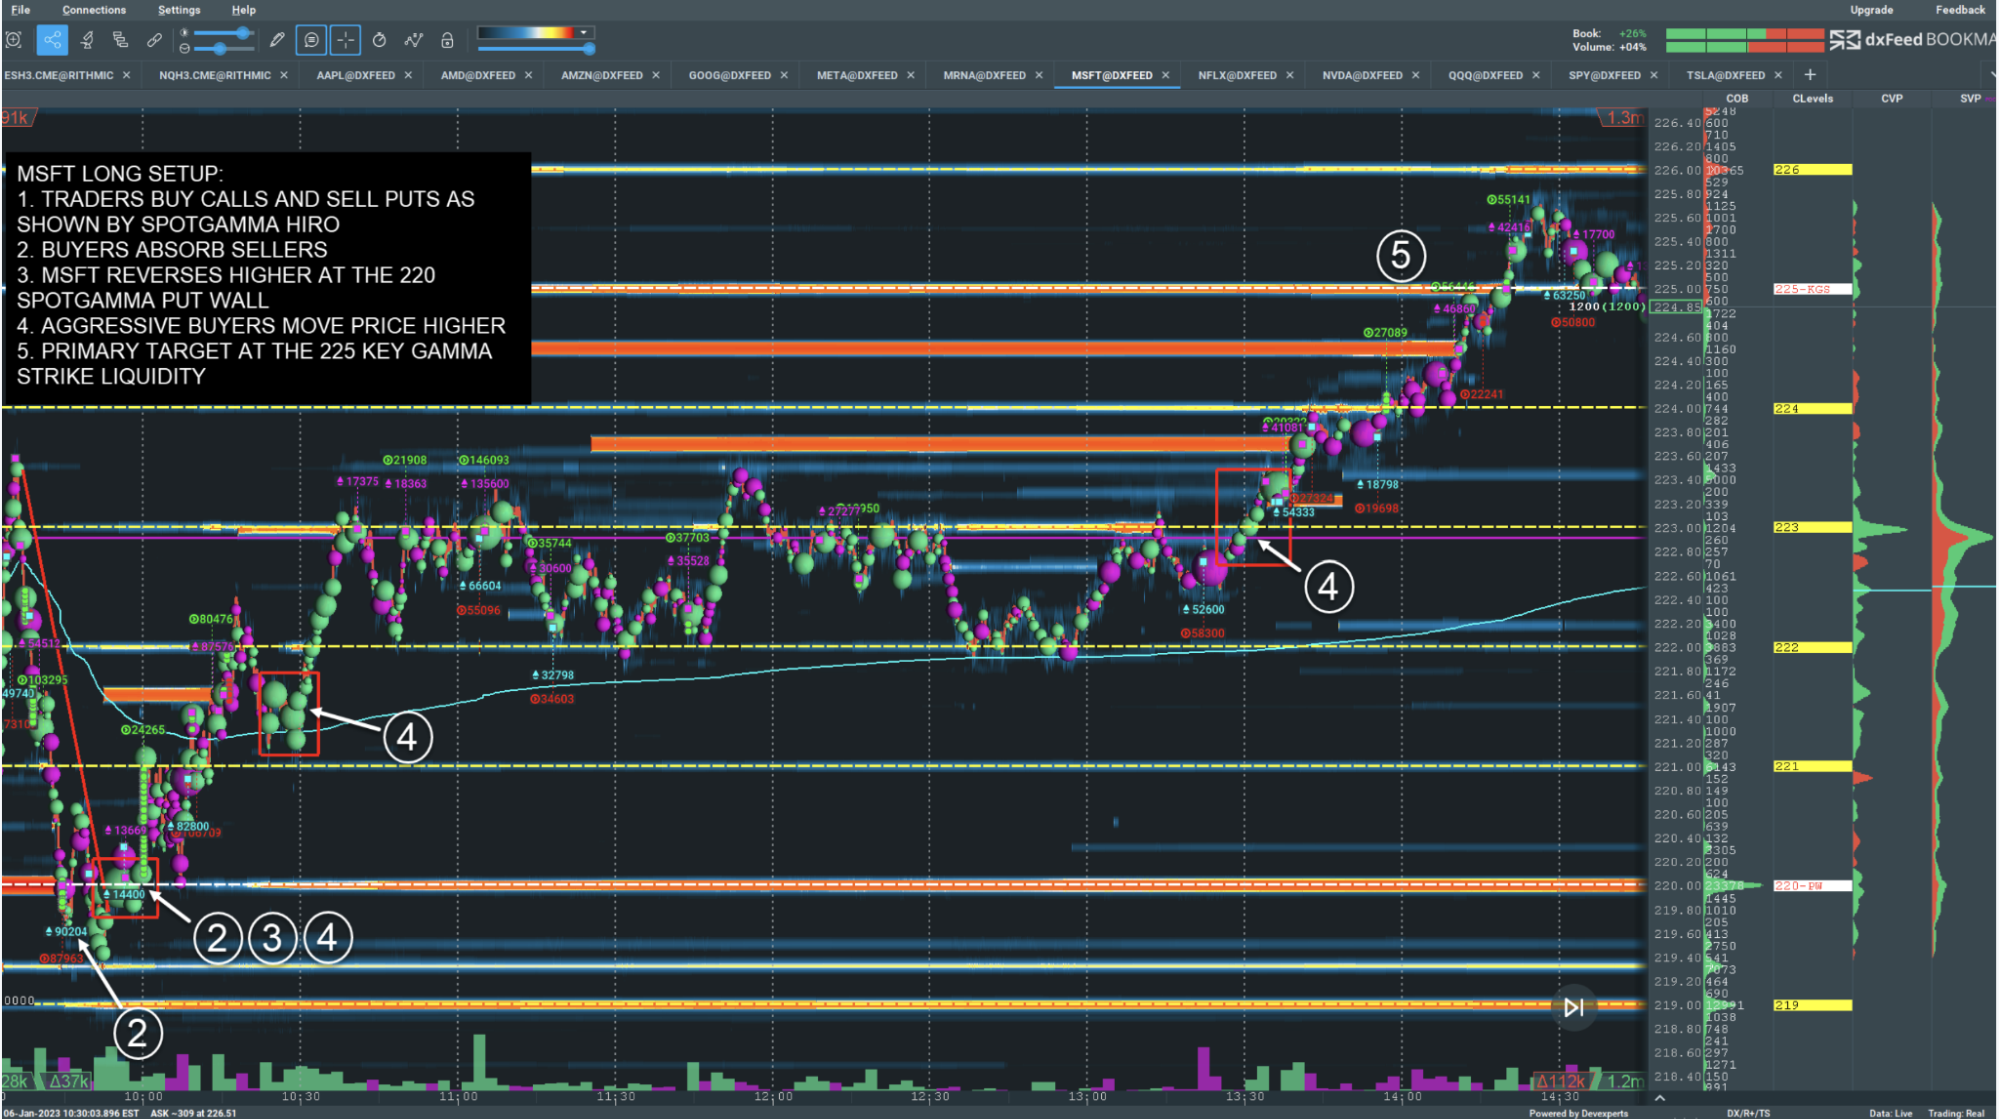
In this example, he writes that MSFT “reverses higher at the 220 SpotGamma Put Wall as traders buy calls and sell puts”.
As “market makers buy stock to hedge delta exposure… aggressive buyers move MSFT higher”.
Conclusion
Microsoft may not be the sexiest stock, especially when compared to the likes of Tesla. Nevertheless, this stock can provide some decent opportunities for the well-equipped traders out there.
To join their ranks, choose to see the whole picture today.
Risk Disclaimer: Trading stocks involves substantial risk of loss and is not suitable for all investors. Past performance is not indicative of future results.
Sign Up Now