See market activity more clearly in real time.
Compare plans to access deeper market visibility for market activity.
Setups
March 27, 2024
SHARE
Trading Apple: Insights From the Bookmap Community
Love it or hate it, Apple is the world’s largest technology company by revenue. It is also a favorite of trader’s all over the world, offering the volatility of a technology stock, but with the smooth returns of a large and established corporation.
Let’s take a look at how some of the best traders in our community trade Apple.
A Brief Intro to Insights
Insights is a page of curated trading content produced by our diverse community across social media.
On the page, you can search for content by certain tags such as asset class (Futures, Stocks, Crypto), instrument (e.g. ES or BTCUSD), indicator (e.g. Stops & Icebergs), order flow phenomena (e.g. Aggressive Sellers), etc.
Setup #1: Liquidity Levels
One of the tried-and-tested ways to trade effectively is by simply identifying areas of liquidity, something that the Bookmap allows you to do with its intuitive heatmap.
An early winner of the Blue Jacket content competition and member of Bookmap Academy Junior, JayLA is a big proponent of liquidity levels, especially when trading APPL (Apple).
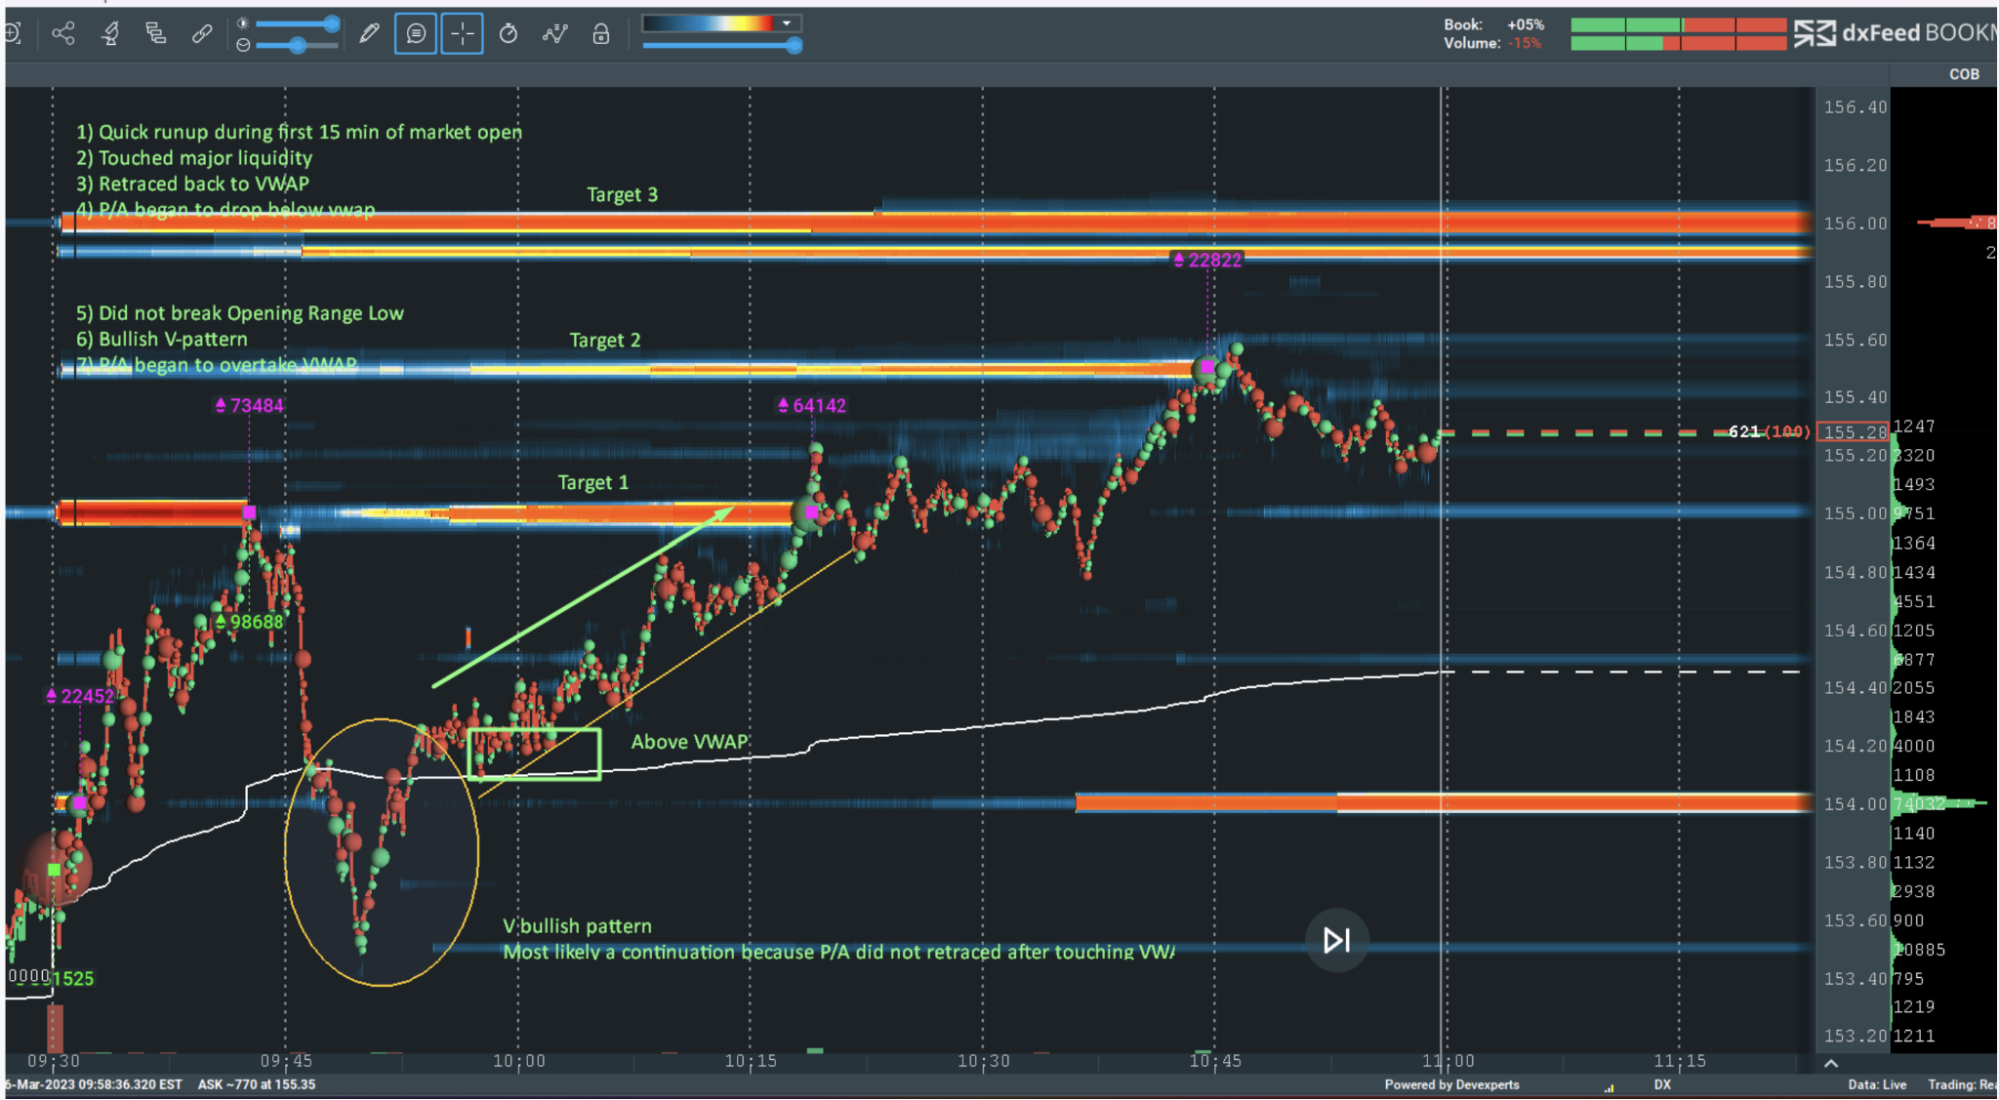
Image 1: “I saw the V pattern… I couldn’t tell if it was bullish or bearish at the time when I was trading but I saw the Opening range low was not broken… Then p/a went above (the) vwap then I knew it was a bullish pattern and went long.” – JayLa
In the example above from March 6, 2023, JayLA notes the “quick runup during the first 15 min of market open” before price “touched major liquidity” and “retraced back to VWAP”.
When price failed to break the “Opening Range Low” and printed a “bullish V-pattern”, a signal was received to get long. From there, JayLa used the liquidity levels as targets, the liquidity levels giving clear areas to take profits on any leg of the trade.
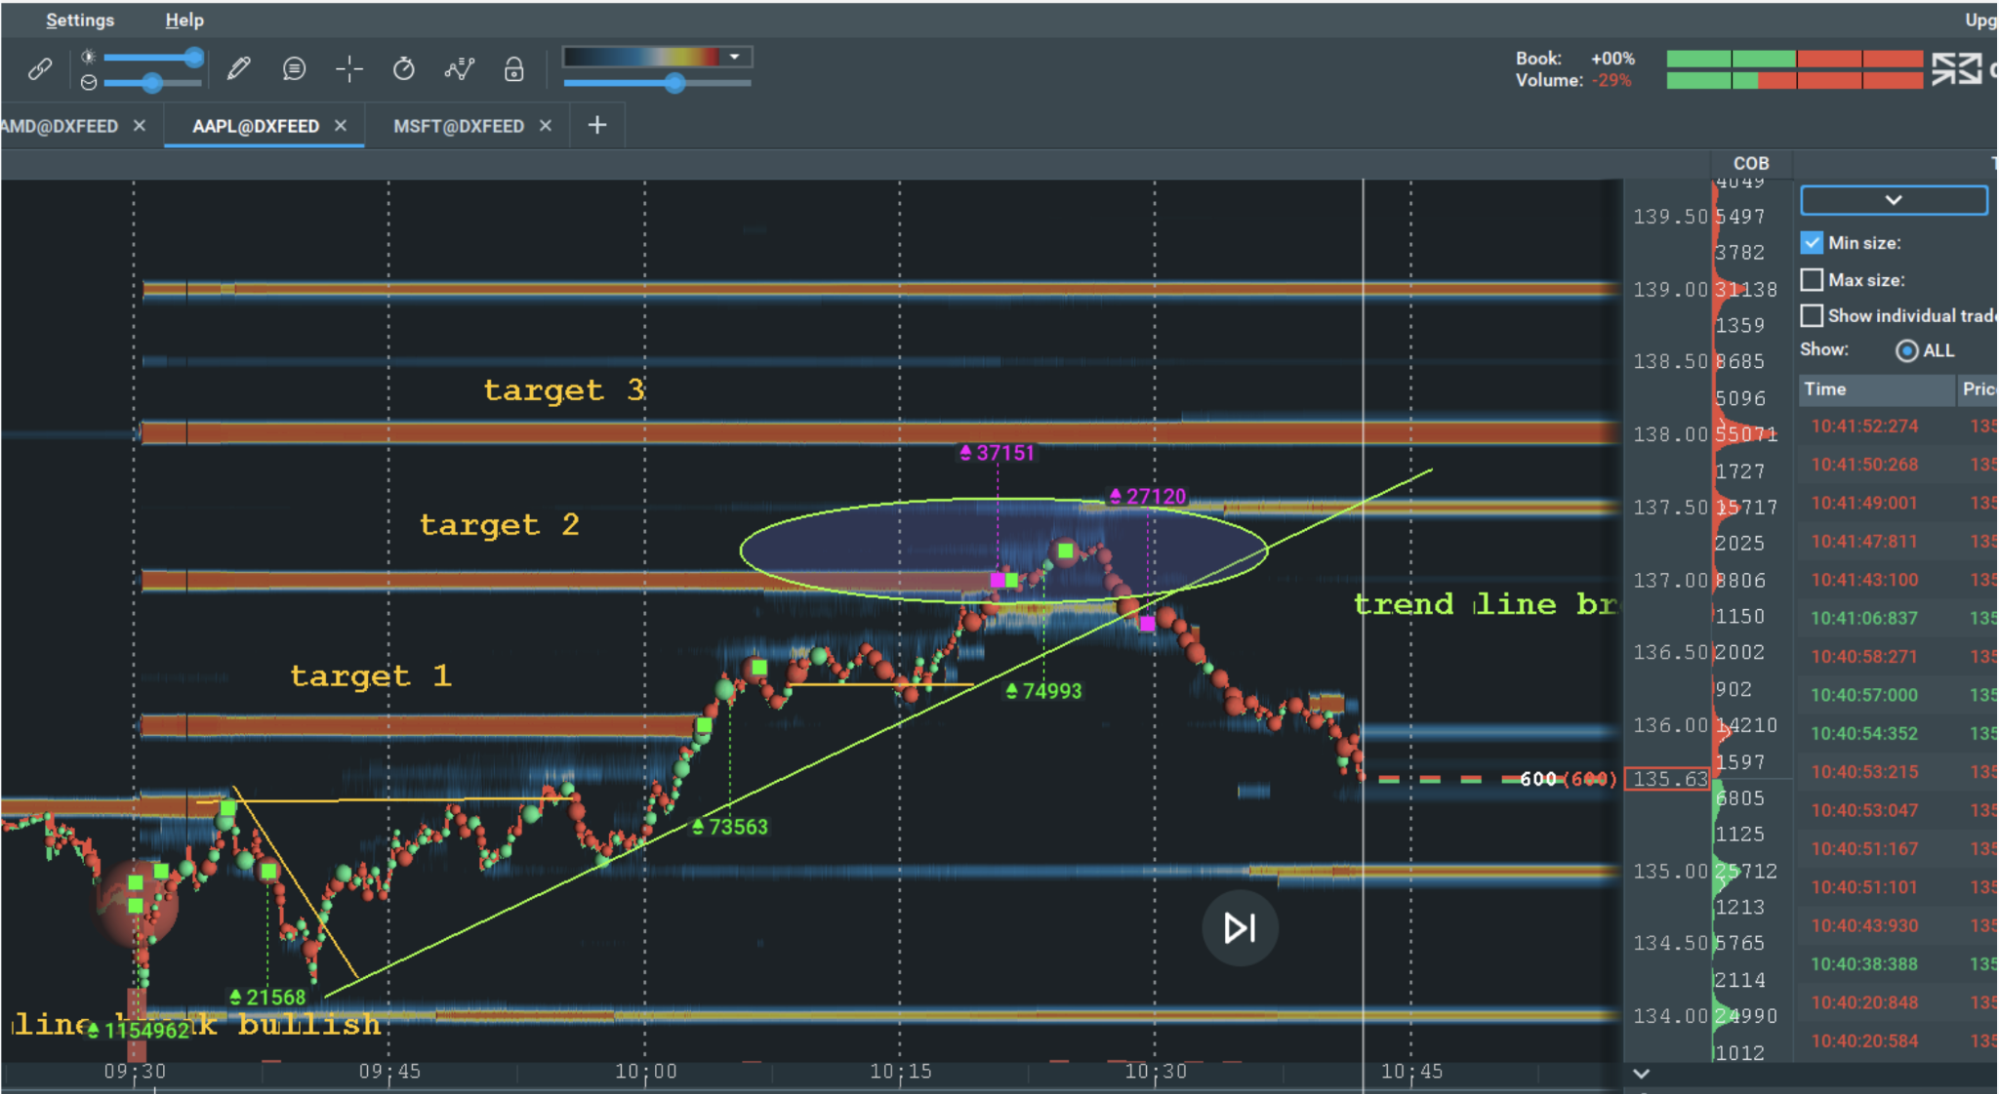
Image 2: APPL trades from one majority liquidity level to another and through 2 levels before breaking the trend line.
Above is another example from JayLA, where Apple “moved from (the) large liquidity level (134) to major sell liquidity levels (136, 137).
Next we have an example from Barboza, whereby price holding above the VPOC (Volume Point of Control) and previous day’s high signals a long bias, with the major liquidity levels being potential targets.
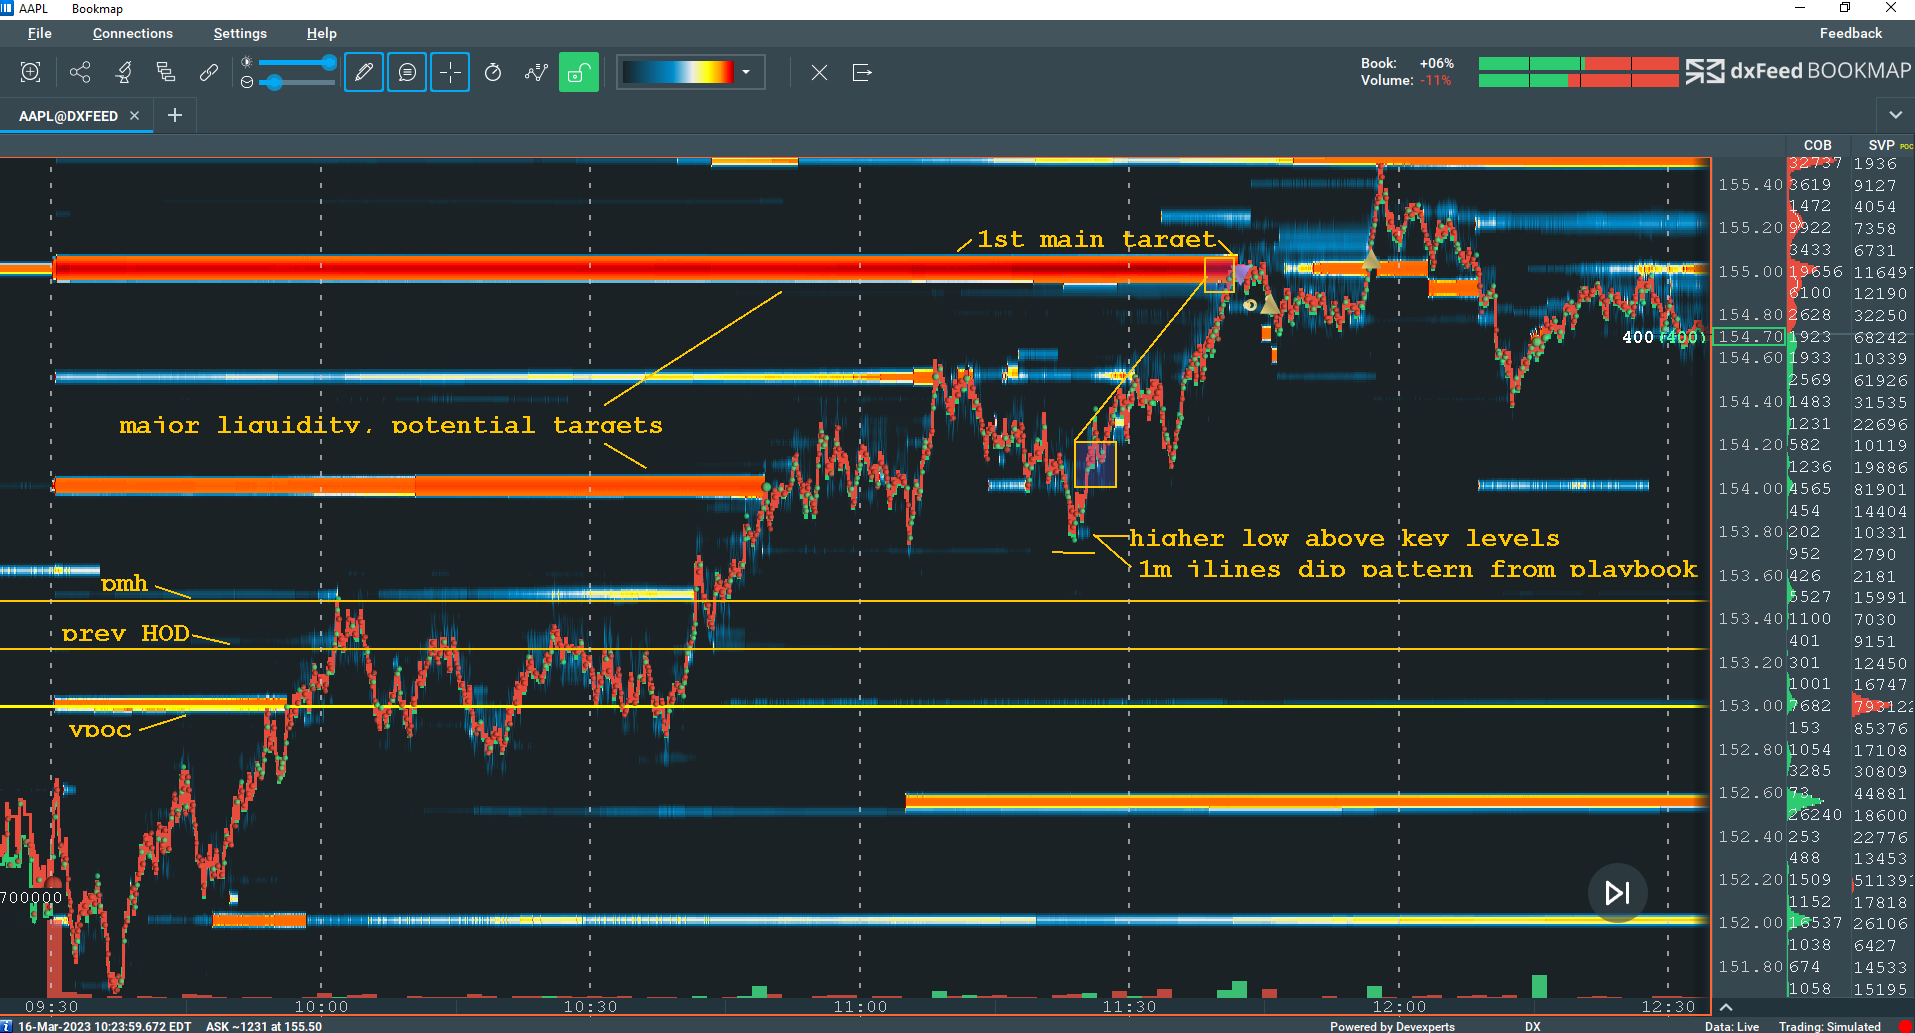
Image 3: APPL analysis by Barboza for Blue Jacket.
Setup #2: Traded Volume & Correlations
Many traders like to trade correlations, which can be a tough job at times. Bookmap makes it easier with the Correlation Tracker, but still some prefer to just eyeball related charts.
Below we see how David911 notes the huge market selling on APPL: “seeing 700,000 apple shares sold on the opening bell was a tell to add to my signals”.
This helped his short trades including on the NQ (Nasdaq).
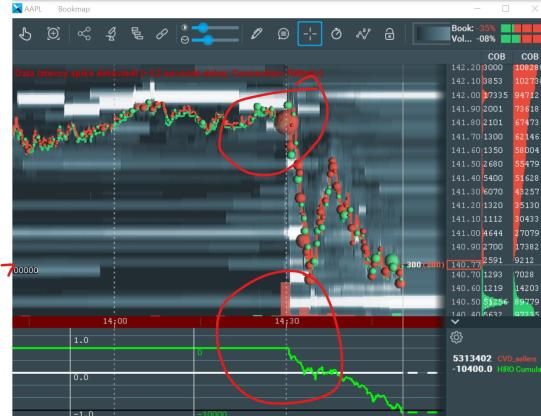
Image 4: “this helped the hefty short my end (i also spanked NQ)” – David911
Setup #3: Filtering With Tradermap Pro
One of the most powerful features of Tradermap Pro is the ability to filter for large orders, potentially giving you an inside look at the larger players’ activity. For a good read on Tradermap Pro, check out our guest article 4 Ways to Trade with Tradermap Pro.
As TraderPete says, Tradermap Pro can be used for ‘Context Building’: “For those looking for targets of large traders, and have Global Plus, Consider Trader Map pro, where you can filter the large players, Real Bids (and) Offers. “
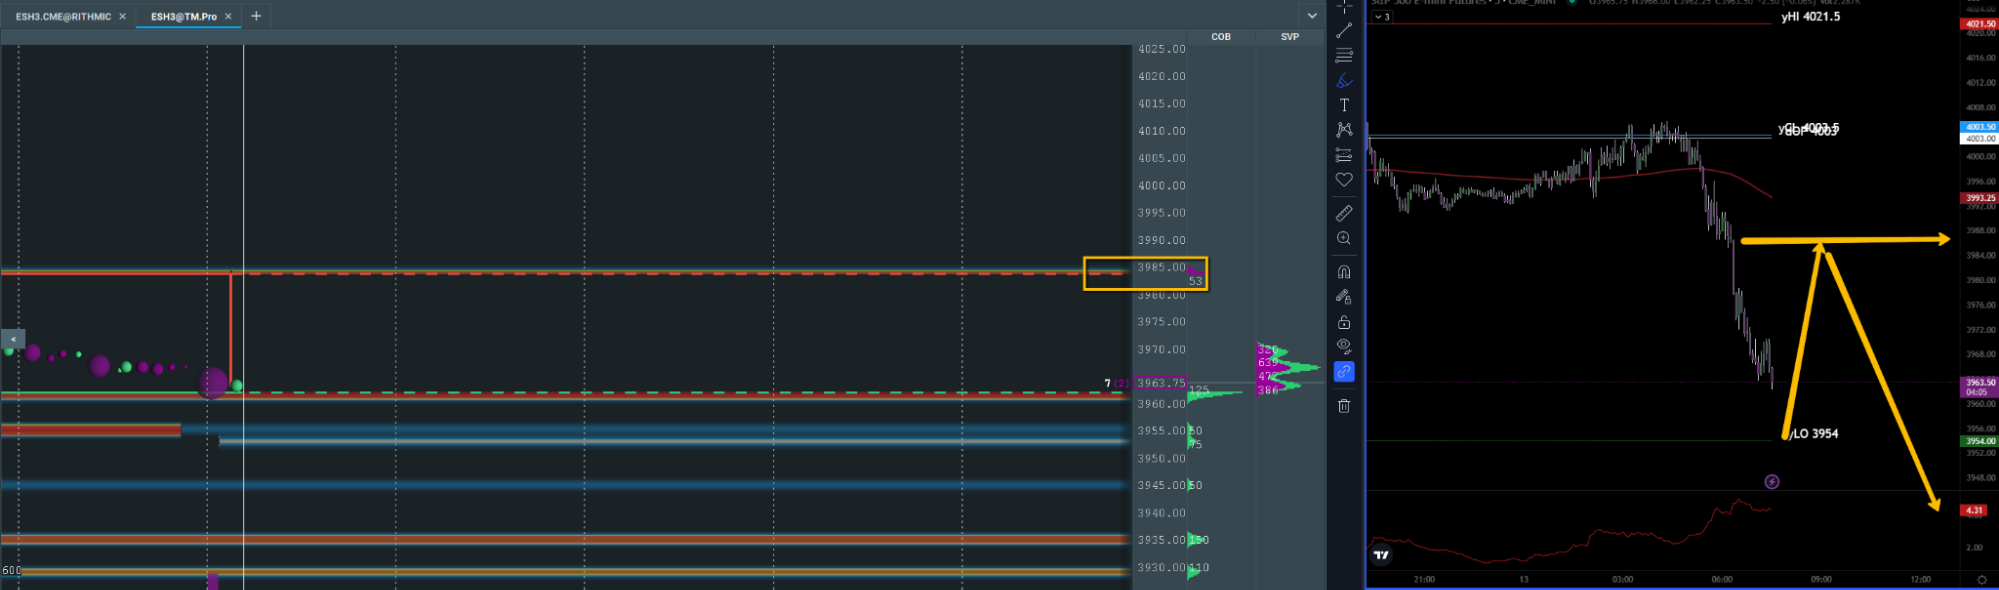
Image 5: …these things repeat a lot combined with your bias you don’t have to second guess targets.” – TraderPete
Conclusion
As you can see, there are many ways to trade Apple, and Bookmap’s heatmap and indicators can be powerful tools for traders looking to successfully trade Apple stock.
By using the heatmap and various indicators to visualize order flow identify key levels and trends, savvy traders can make more informed decisions and increase their chances of profitability.
If you want to trade as well as the traders in this article and potentially be featured in a future article, choose to see the whole picture today.
Risk Disclaimer: Trading stocks involves substantial risk of loss and is not suitable for all investors. Past performance is not indicative of future results.
Sign Up Now