See market profile more clearly in real time.
Compare plans to access deeper market visibility for market profile.
Education
February 4, 2026
SHARE
Understanding Market Profile: Bell-Shaped Curves, Single and Multiple Distributions Explained
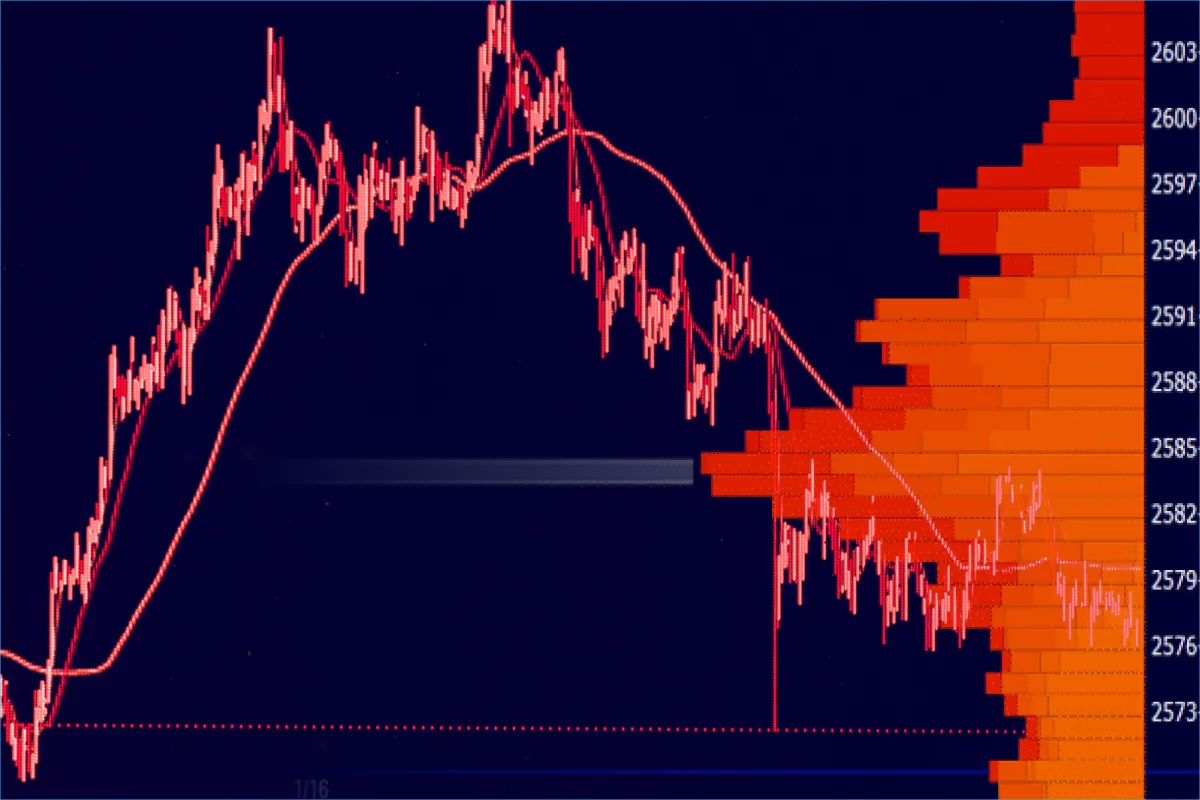
Markets don’t move randomly. Every tick is part of an ongoing conversation between buyers and sellers about where the price truly belongs. Okay, but how can you spot that? Market Profile is the tool that lets you listen to that conversation.
At its core, Market Profile represents “price action” into “market profile distributions”. By studying them, you can understand where the market found value, where it rejected prices, and how that value evolved during the session.
So, don’t want to guess why the price stalled or suddenly moved? In this article, you will learn how to read single, double, and multiple distributions and connect them with real-time order flow. Also, you will understand how to use Bookmap to gain essential confirmations. Let’s begin.
What Market Profile Represents
Market Profile is a way to “organize market activity,” so it’s easier to understand. Instead of focusing only on price fluctuations, it arranges trading data into a time-based histogram. This graph shows how much trading happened at each price level during the day.
If we were to simplify, it answers one core question:
- At which price does the market feel most comfortable today?
That comfort zone is known as “fair value”, and market profile distributions visually highlight it. To better understand the market profile, let’s learn about some key concepts:
| Point of Control (POC) | Value Area | Tails |
|
|
|
Together, these elements form a distribution curve. By studying them, you can read market acceptance, rejection, and balance.
Single Distribution: A Balanced Auction

A single distribution in Market Profile describes a balanced market (not a trending one). If you want to visualize, imagine it as a “bell-shaped curve”, where most trading activity clusters around the center. In market profile distributions, this indicates that buyers and sellers largely agree on the session’s value.
A single distribution has a rounded profile with a single clear hump. In it:
- Most activity is concentrated near the Point of Control (POC), and
- Upper and lower tails are present but not extreme (showing limited rejection).
How Does It Form?
In this market phase, both sides are comfortable with the price. Thus,
- Buyers step in near the lower edge,
and
- Sellers respond near the upper edge.
Since neither side dominates, the price oscillates and frequently returns to the middle of the value area.
How Should Traders Interpret This
You should expect rotation and mean reversion (not breakouts). Next, you may:
- Look to fade the extremes back toward the POC or value area,
and
- Use the POC as a key reference for entries, targets, and trade management.
Need a tool? On Bookmap, you can observe alternating delta and steady resting liquidity on both sides. Also, Bookmap shows absorption near the edges. Using all this information, you can easily confirm a balanced + single-distribution day.
Double Distribution: A Shift in Value
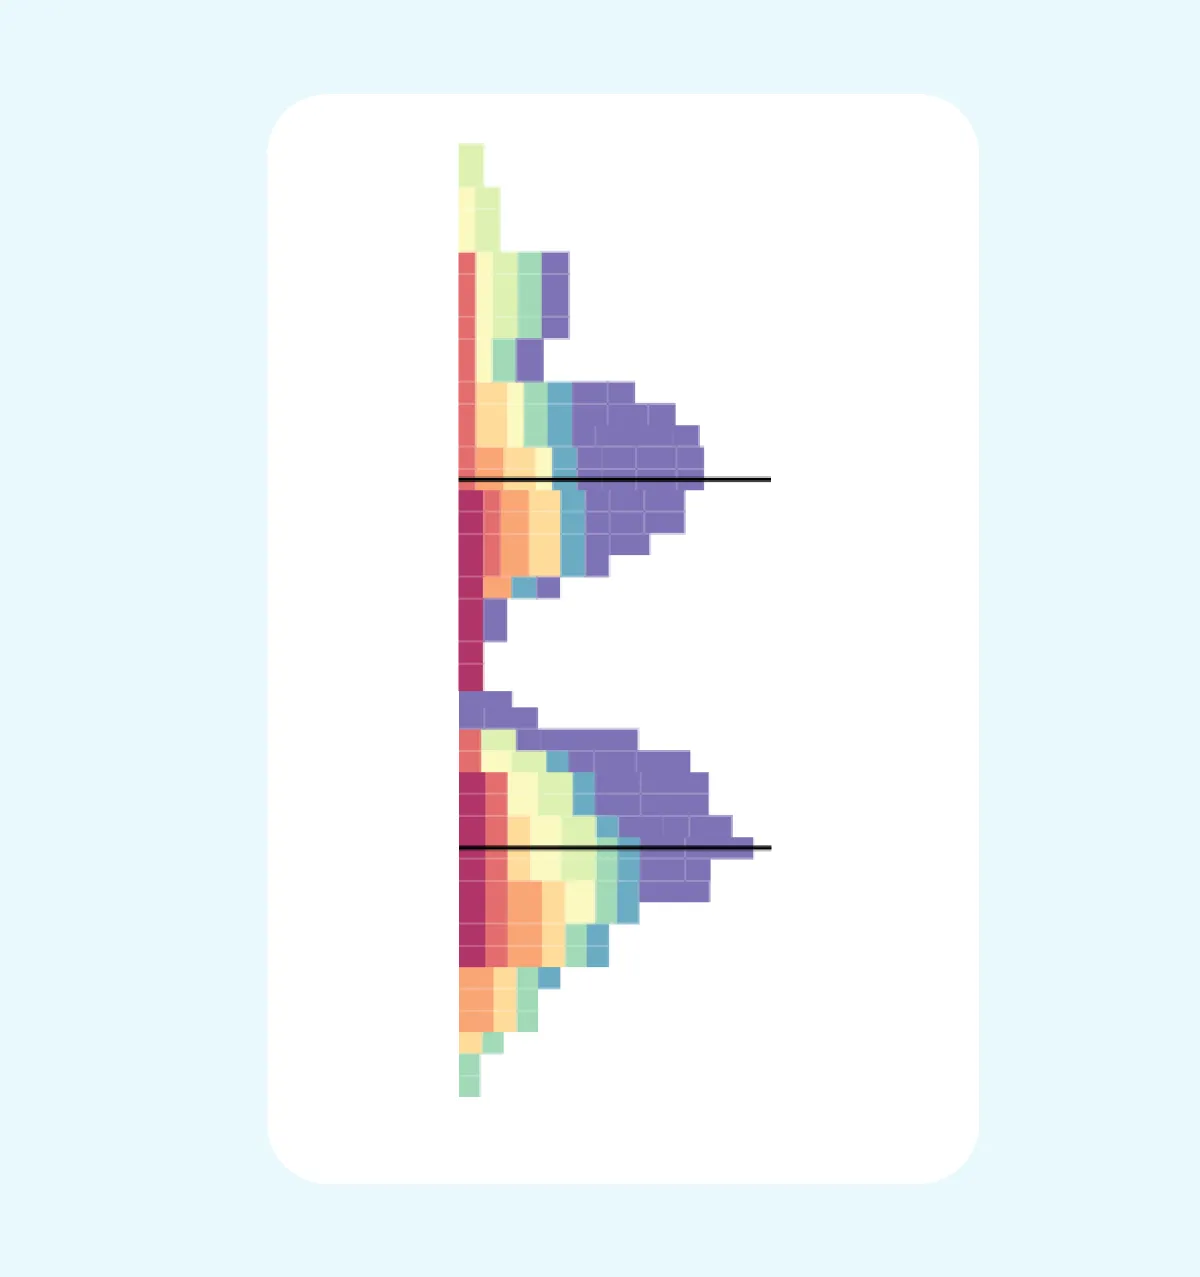
A double distribution in Market Profile means the market moved from one area of balance to another during the same session. Does it trend nonstop? Nope! Instead, value shifts. In market profile distributions, this structure shows that the market accepted two different price zones at different times.
Okay, how does it look? Usually, it is two distinct bell-shaped humps at separate price levels. There is a thin or low-volume zone between them, and price moves through these zones quickly. Also, there are either two Points of Control (POCs) or one primary POC with a strong secondary node.
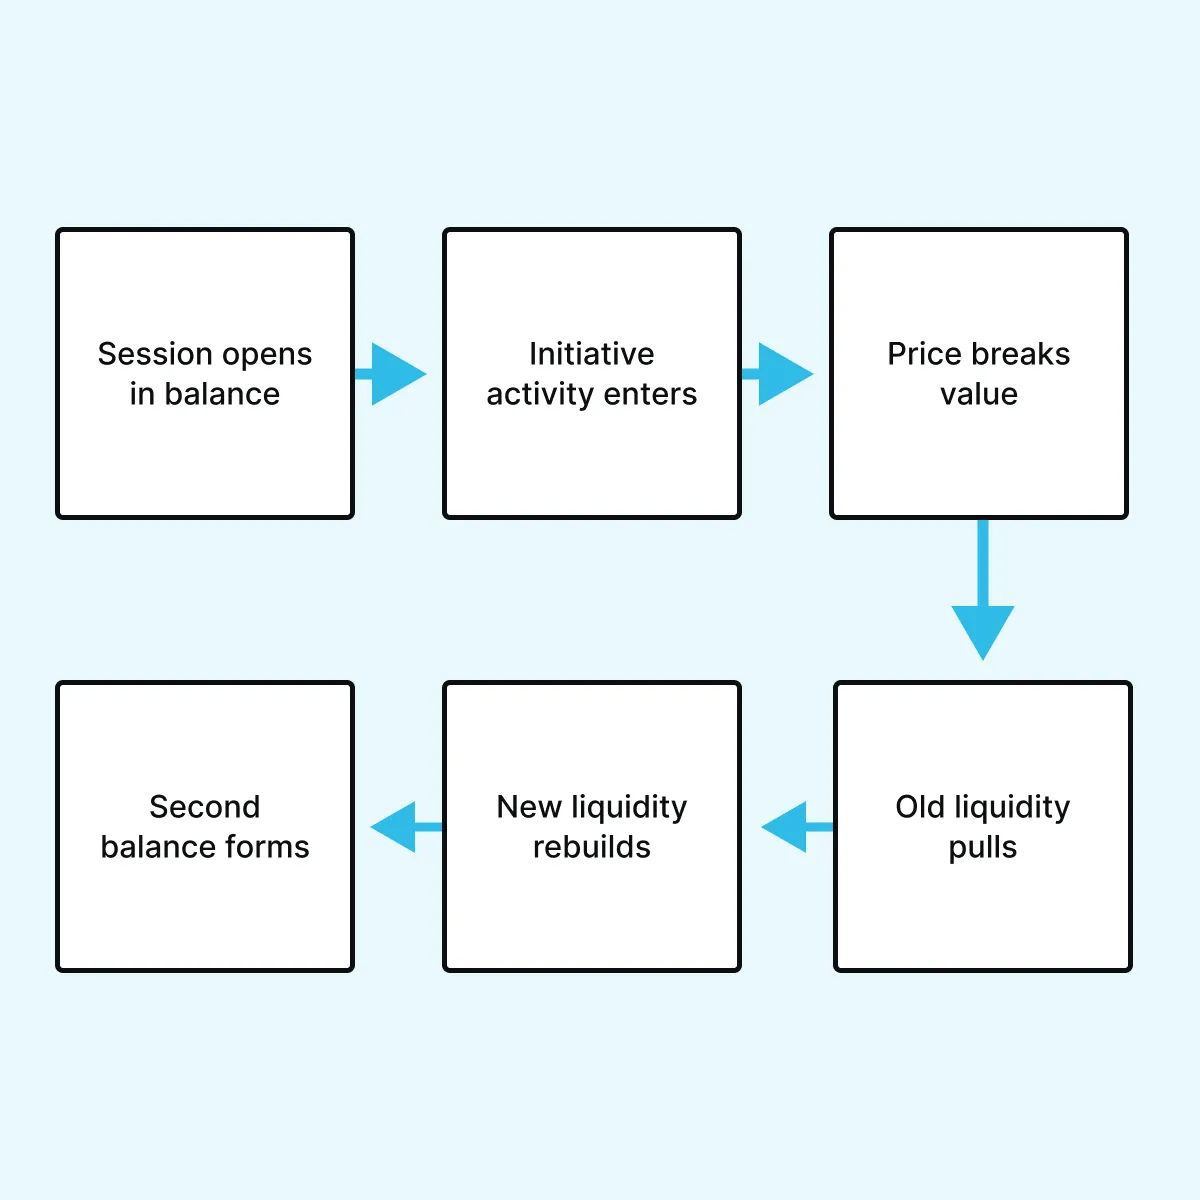
How Does It Form?
The session usually starts in “balance”. Then, a news event, data release, or strong initiative buying or selling pushes the price away from the first value area. After the move, liquidity returns, and the market builds acceptance at a new level, creating the second balance.
How Should Traders Interpret This
You must realize that “old value” and “new value” are clearly separated in this market phase. The thin zone between them acts as an essential transition or rejection area. As a trader, you may expect reactions when:
- Price revisits the bridge,
or
- Tests the edges of either balance.
Again, you can use Bookmap to see liquidity pulling + followed by aggressive movement. Also, you can observe that once the price stabilizes:
- Passive bids or offers reappear,
and
- Delta begins to align with the new value area.
Both these signals confirm the shift. Learn to recognize single and multiple distribution days in real time → Compare Plans
Multiple Distributions: Trend With Migrating Value
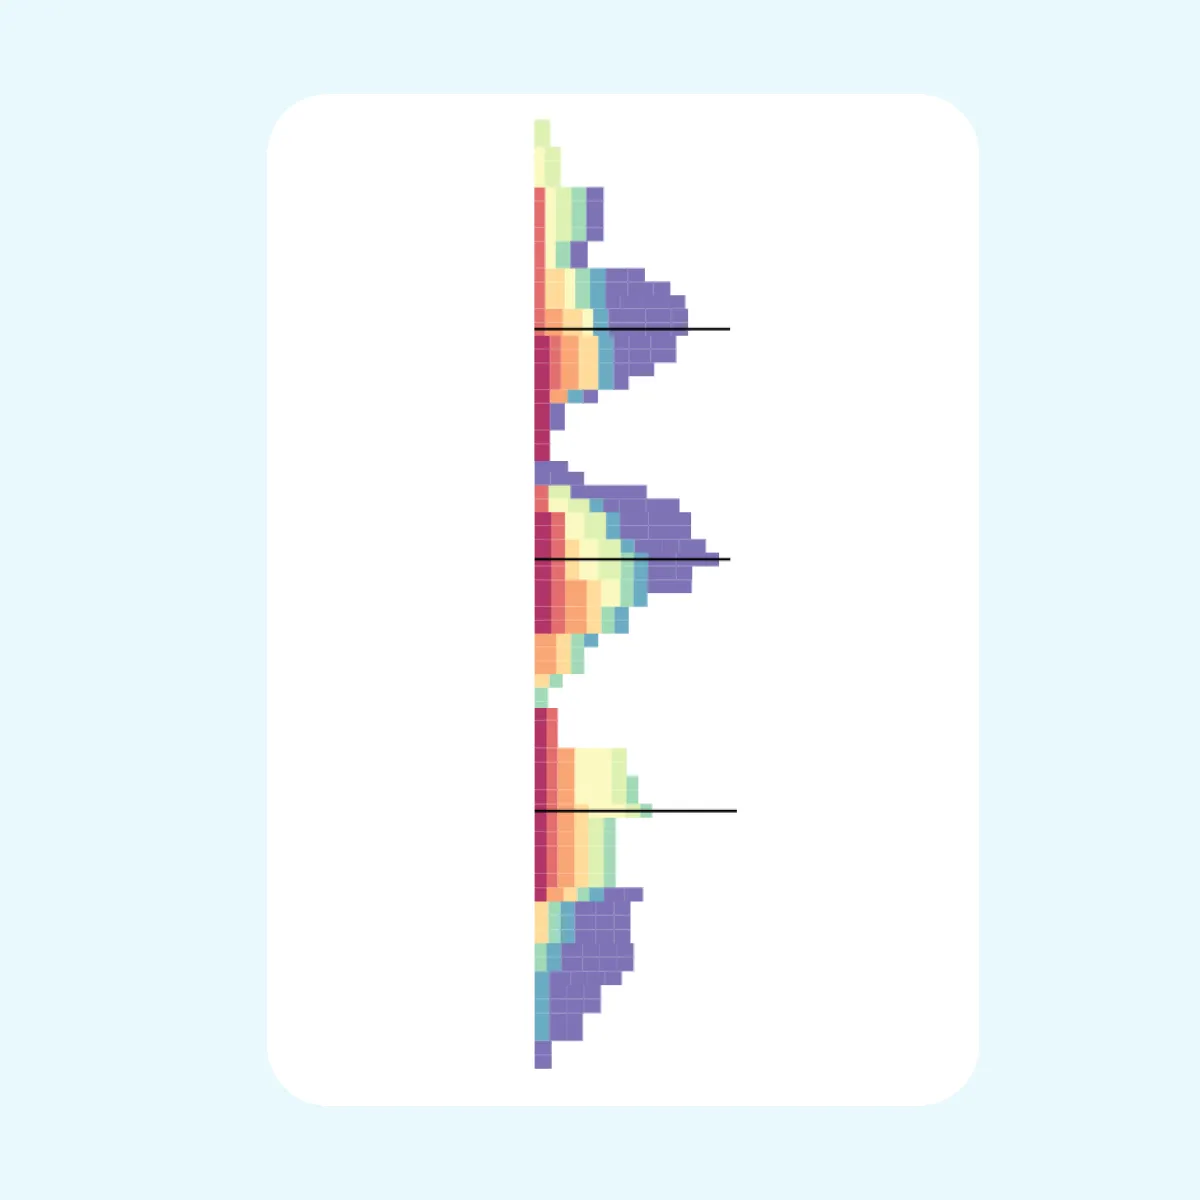
Multiple distributions in Market Profile describe a “trending market”. Unlike single- or double-structures, value does not stay in one place. Instead, it migrates in steps. Due to such a slow iteration, the market leaves behind several “balance areas”.
Now, if we talk about what it looks like, in market profile distributions, there are three or more distinct humps across the profile. Each hump represents a pause where the market accepted value. Additionally, thin zones between humps show fast movement + little trading.
How Does It Form?
The session progresses in phases. Let’s see how:
- First, price pushes in one direction.
- Then the market pauses and balances.
- After acceptance builds, price pushes again.
Note that every “push-and-pause” sequence creates another distribution.
How Should Traders Interpret This
Ideally, you should trade in line with value migration, not against it. Also, treat the most recent balance area as:
- Support in an uptrend,
or
- Resistance in a downtrend.
Lastly, watch thin zones for quick rotations and possible trend continuation.
If you want to visualize everything and obtain confirmation of the order flow, you can use Bookmap. Here, you can observe liquidity pulling in the direction of the trend, with fresh resting bids or offers forming at new, higher, or lower bases. This confirms sustained control by one side.
Reading Distributions with Order Flow Context
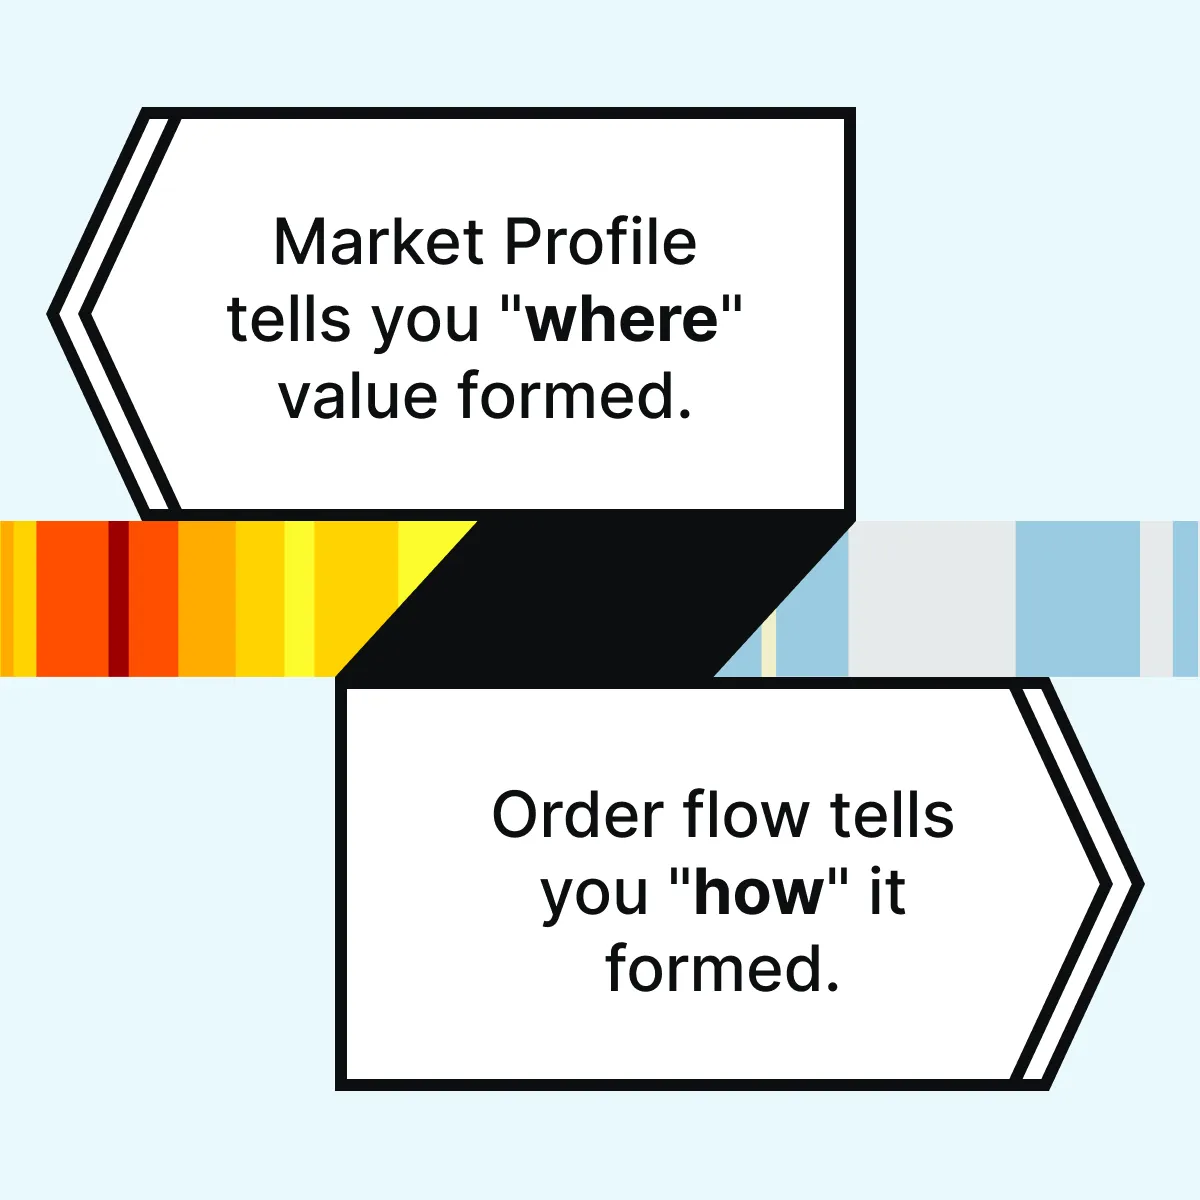
When used together, “market value + order flow” gives a much clearer picture of market behavior. Why? That’s because in market profile distributions, the shape shows acceptance and rejection, and order flow explains the participation behind it. Let’s see how you can use them together:
| Reading Balance Days (Single Distributions) | Value Shift Days (Double Distributions) | Trending Value Days (Multiple Distributions) |
|
|
|
Want to know one best practice? Use Bookmap’s replay mode and replay sessions to watch how each balance pocket formed in real time. This allows you to connect the profile structure with live order flow behavior.
Combine profile context with Bookmap’s liquidity and delta insights → Compare Packages.
Using Market Profile for Trade Planning
Is market profile just a way to describe the market? Nope! You can also use it to plan your trades. Different market profile distributions signal distinct conditions, each with its own opportunities and risks. Let’s see what your ideal trading approach should be in different market profiles:
| Single Distribution (Balanced Market) | Double distribution (value shift): | Multiple distributions (trending market) |
|
|
|
For better clarity, consider this example:
- Suppose the market forms a balance area near 4600.
- Later, it builds another balance near 4630.
- Also, the price zone between 4615 and 4620 becomes a key transition area.
- Now, this is where the market decides whether to rotate back or continue higher.
When price enters this zone, traders should closely watch Bookmap. Changes in liquidity (such as orders pulling or stacking) along with delta shifts can confirm intent. Additionally,
- Strong absorption may signal rejection back toward the value,
while
- Aggressive participation supports continuation into the higher balance.
Conclusion
So now you know about the primary role of market profile. It is to tell you the story of “value in the market”. If we were to recap:
- A single distribution shows balance, where price rotates around a central Point of Control, and buyers and sellers agree on value.
- A double distribution signals a shift, in which the market leaves behind the old value and accepts a new price area.
- Multiple distributions reflect a trend, with value migrating step by step and forming several balance pockets along the way.
Want to get the most out of market profile distributions? You should always combine them with real-time order flow. When you watch value build in real time, your trade decisions become more timely and informed. See how market profile structure aligns with real-time order flow → Compare Packages.
FAQs
1. What is the purpose of Market Profile?
The Market Profile shows where the market spent most of its time and where it felt comfortable trading. It highlights areas of “balance” and “imbalance”. This knowledge allows traders to identify essential price zones where reactions are more likely.
2. What does a double distribution day indicate?
It shows that the market moved from one accepted price area to another. The thin zone between them is critical because price usually reacts there when it revisits that area.
3. Can you trade directly from Market Profile shapes?
Market Profile shapes only give you context + direction. You can’t get exact entry points from them. Ideally, you should use the profile to plan the trade, and then rely on order flow confirmation to time execution.
4. How does Bookmap enhance Market Profile analysis?
Bookmap is an advanced real-time market analysis tool. Using it, you can see liquidity, delta, and absorption behind market profile distributions. This knowledge allows you to confirm “value shifts” as they occur (not after the session ends).
Sign Up Now