See value area more clearly in real time.
Compare plans to access deeper market visibility for value area.
Education
October 20, 2024
Updated
SHARE
Can Market Profile Give You an Edge in Intraday Trading? Here’s How to Use It

Do you wish to achieve market success? The secret lies in spotting certain key price levels. Most traders do so by using “Market Profile,” which is a tool that organizes market data and shows where the most trading activity occurs. Being different from traditional charts, it provides a detailed view of price distribution and volume.
In this article, you will learn about crucial Market Profile levels such as the Point of Control (POC), Value Area High (VAH), and Value Area Low (VAL). These levels are important for identifying areas where the market is likely to stabilize, reverse, or break out. We will cover how to use these levels to spot trading opportunities and even explain to you several strategies for trading breakouts, reversals, and range-bound markets.
By understanding how to interpret these levels, you can make more informed decisions on when to enter and exit trades. Let’s get started.
What is Market Profile and Why is it Important for Intraday Trading?
Market Profile is a technical analysis tool that organizes market data into a bell-shaped distribution curve. By doing so, it shows where the most trading activity occurs at different price levels over a specific time period.
Also, it is different from traditional charts, such as candlesticks or bar charts that focus on price and time. Instead, Market Profile charts show where the most trading activity occurs at different price levels. It specifically focuses on:
- Price distribution (where trading volume is concentrated)
and
- Volume (the amount of trading at each price level)
In this way, the Market Profile provides a clearer view of which prices are considered fair or important by market participants. This helps traders understand market behavior and identify key levels at which buying or selling pressure is likely to increase.
Learn how to use Market Profile for better intraday decisions – Join now!
How Market Profile Organizes Market Data?
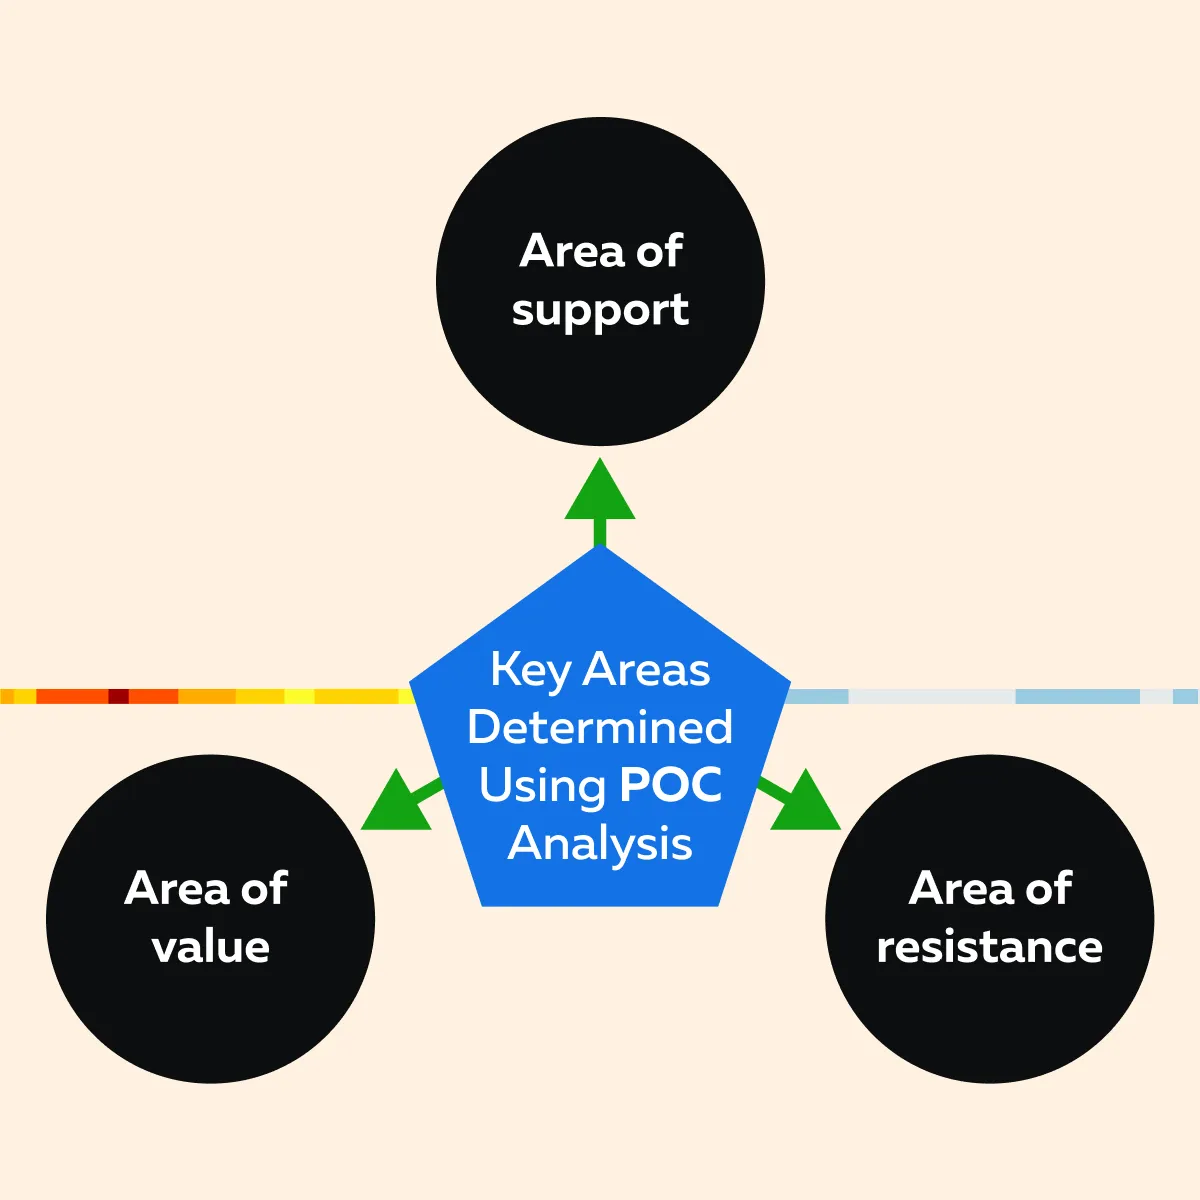
It must be noted that Market Profile uses “time-based data” to create a distribution curve. This curve shows price levels where most trading activity takes place, known as the “Point of Control” (POC). Also, it represents the areas in which buying and selling pressures are strongest.
See the graphic below to understand how analyzing POC helps traders:
How Important is Market Profile for Intraday Traders?
Using Market Profile, most intraday traders:
- Understand market sentiment
and
- Spot likely trend reversal points.
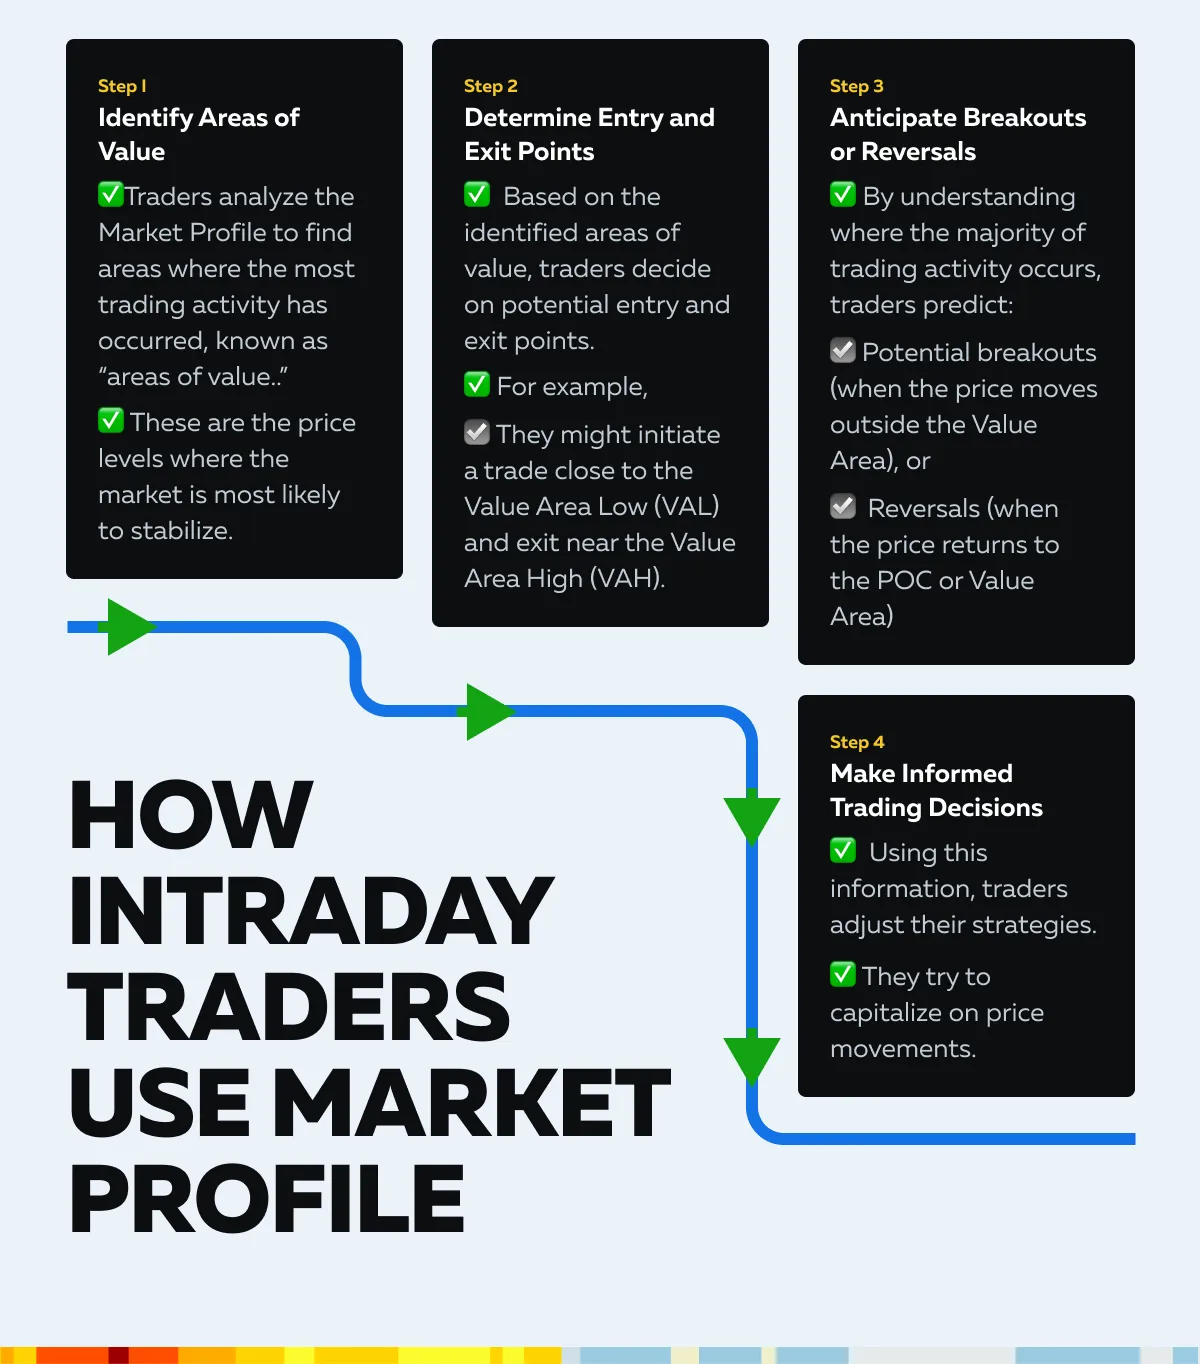
Also, it helps to identify support and resistance levels and understand whether the market is trending or ranging. Moreover, by analyzing the distribution curve, traders can even predict the day’s expected high and low points. This way, traders can frame their strategies accordingly to capitalize on price movements within these levels. Now, let’s see how intraday traders practically use market profiles for intraday trading strategies:
Refine your intraday trading strategy with our Market Profile tools. Sign up today!
Identifying Key Market Profile Levels for Intraday Trades
To better understand market dynamics, traders must identify certain key Market Profile levels, such as:
- Point of Control (POC)
- Value Area High (VAH), and
- Value Area Low (VAL).
These areas provide information on where the most trading activity occurs. A thorough analysis helps to make informed decisions on entries, exits, and potential reversals. Let’s study these levels in detail:
Point of Control (POC)
The Point of Control (POC) is the price level on a Market Profile chart where the highest volume of trading activity has occurred over a specific time period. It is the price at which most transactions take place and is a key reference point for intraday traders. The Point of Control (POC) is important because it indicates the price level that traders consider to be the “fair value.”
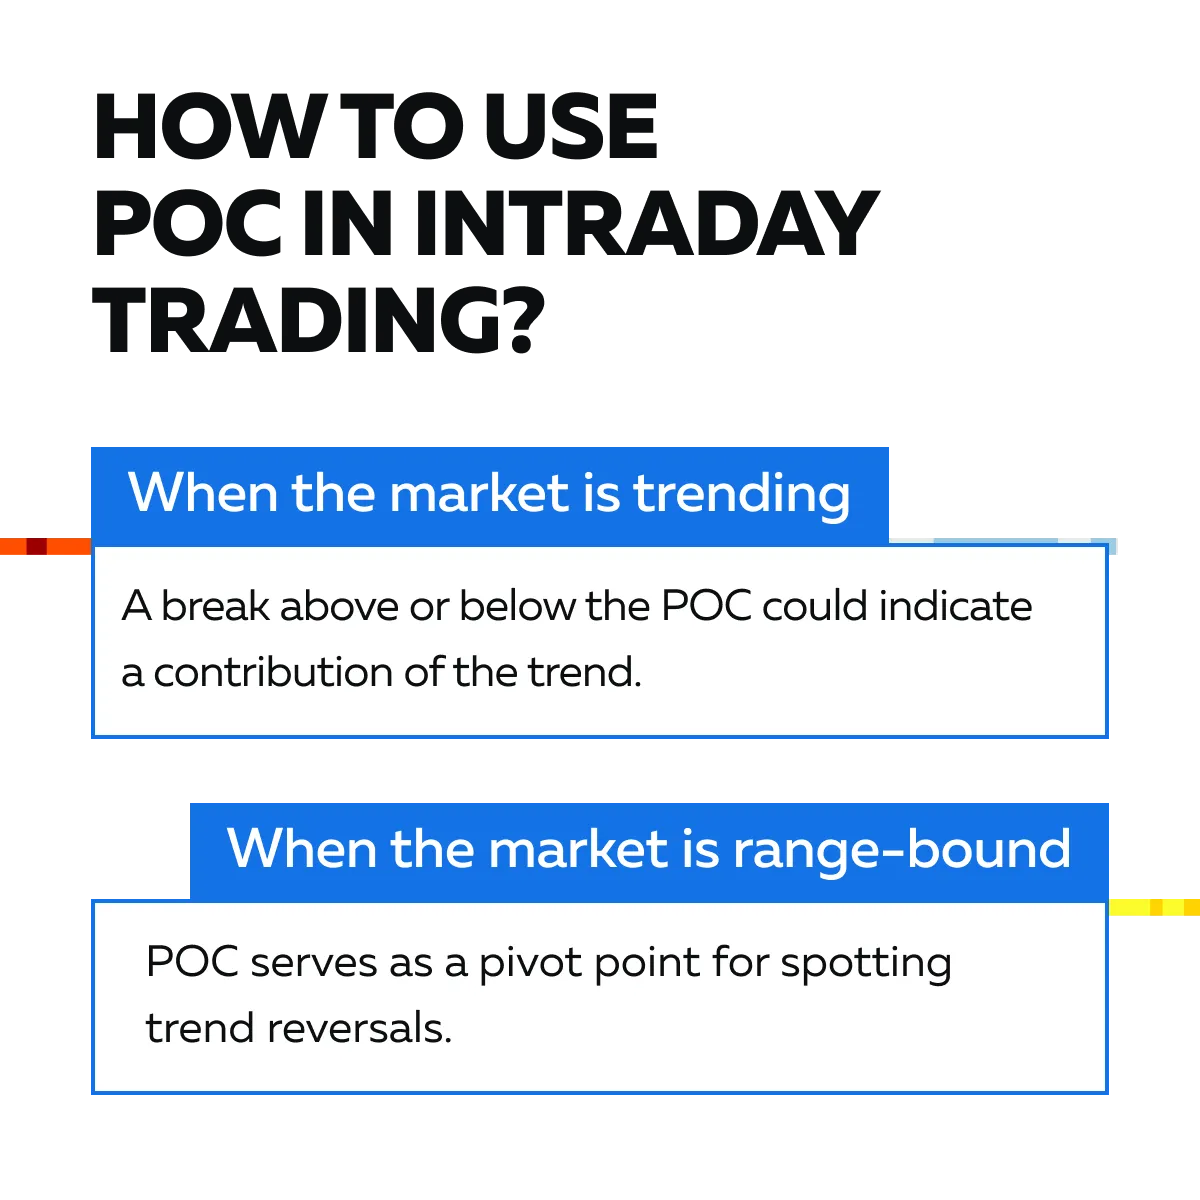
How to Use POC in Intraday Trading?
Traders can use the POC as a potential entry or exit point. See the graphic below to understand its practical usage:
Value Area (VA)
The Value Area (VA) represents the price range where 70% of all trading activity occurred. Usually, it is defined by the upper and lower boundaries on a Market Profile chart. This area reflects the range within which most market participants are comfortable trading. In this way, it indicates a zone of balance between buyers and sellers. Now, in terms of significance, most traders view the VA as an “area of equilibrium.” That’s because:
- When prices remain within the VA, it suggests a balanced market.
- However, when prices move outside the VA, it signals potential trading opportunities, such as breakouts or pullbacks.
By analyzing the VA, traders identify areas of value, support, and resistance. Be aware that all of them are crucial for planning trade.
How are trades set up around the Value Area High (VAH) and Value Area Low (VAL)?
It is significant to mention that several traders often look for trade setups around the Value Area High (VAH) and Value Area Low (VAL). That’s because it helps identify potential reversals or continuations. Firstly, let’s study both of them in detail:
| Aspect | VAH (Value Area High) | VAL (Value Area Low) |
| Location | The upper boundary of the Value Area. | The lower boundary of the Value Area. |
| Trader’s approach | When the price approaches the VAH, traders look for signs of a reversal, such as bearish candlestick patterns or volume divergence. In doing so, they look for the intensity of selling pressure. | When the price nears the VAL, traders watch for a likely reversal to the upside. They specifically look for bullish patterns or increased buying volume. |
| Indication | If the market breaks above the VAH with strong momentum, it suggests a continuation of a bullish trend. | A break below the VAL signals a continuation of a bearish trend. |
One must be aware that as the trading day progresses, the Value Area shifts and creates new “developing” areas of value. Traders often monitor these shifts to adjust their strategies. To identify developing value areas, traders use tools like:
- Volume profiles
or
- Real-time Market Profile charts.
Using them, they observe how the Value Area changes throughout the day. Always remember that if the Value Area is expanding or contracting, it reflects changes in:
- Market sentiment
and
- Trading activity.
For more clarity, let’s study a hypothetical scenario where a trader adjusts their trading strategy for bullish sentiment:
- Say a trader notices the Value Area shifting upwards throughout the day.
- This shift indicates a bullish sentiment and an upward trend.
- Also, it suggests that the market participants are willing to trade at higher prices.
- To adjust strategy, the trader focuses on long trades.
- They specifically look for buying opportunities on pullbacks near the newly developing VAL.
- They also use the new VAH as a target or resistance level.
- Doing so, they plan to exit their long positions if:
- The price reaches this level
or
- Shows signs of reversal.
Enhance your intraday trades with our Market Profile analysis. Get started with us today!
Strategies for Trading with Market Profile Intraday
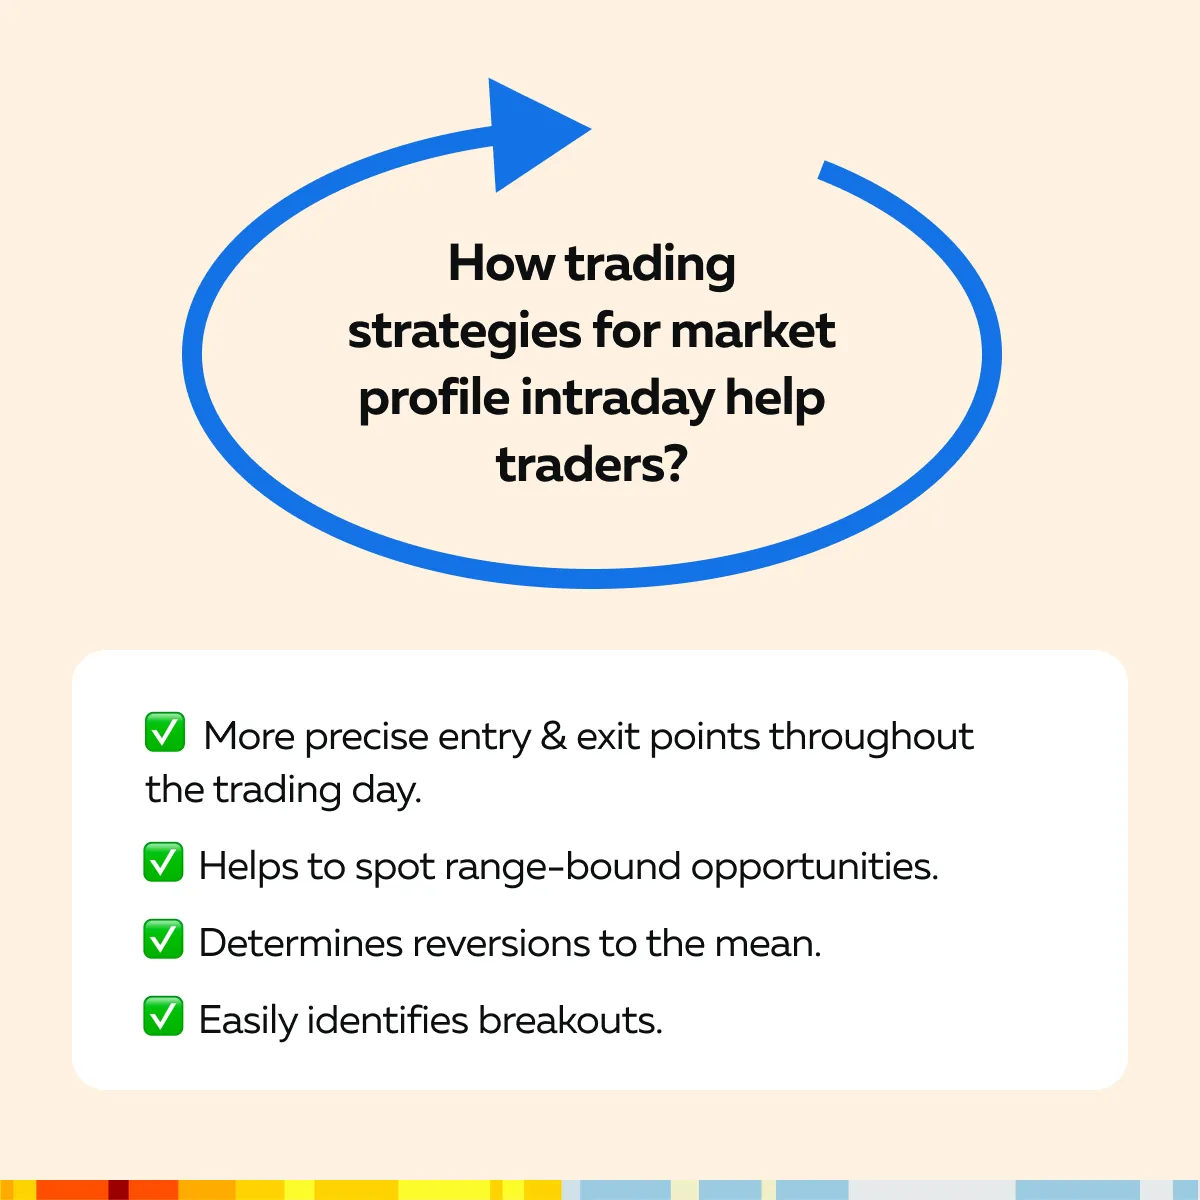
Most strategies centered around Market Profile intraday focus on using key levels such as the Value Area High (VAH), Value Area Low (VAL), and Point of Control (POC). See the graphic below to check how these strategies help traders:
Now, let’s study some popular trading strategies in detail:
Strategy I: Trading Breakouts
Traders use Market Profile to identify breakouts by monitoring price movements outside the Value Area or Point of Control (POC). Usually, a breakout occurs when the price moves significantly above the Value Area High (VAH) or below the Value Area Low (VAL) with strong volume. Such a situation indicates a likely trend continuation. For more clarity, let’s see the practical application of this strategy in simple steps:
- Step I: Identify Breakout Opportunity
-
-
- Monitor the price as it approaches and breaks above the Value Area High (VAH) with strong trading volume.
- This situation indicates bullish momentum.
-
- Step II: Enter Long Position
-
-
- Once the breakout above the VAH is confirmed, enter a long (buy) position to capitalize on the upward trend.
-
- Step III: Place Stop-Loss
-
-
- Set a stop-loss order just below the VAH to protect against potential false breakouts.
- It also helps in limiting losses if the trade goes against you.
-
- Step IV: Set Profit Target or Use Trailing Stop
-
- Determine a profit target at the next significant resistance level.
- Alternatively, you can use a trailing stop to lock in profits as the price continues to move in the desired direction.
- This allows for likely gains if the trend persists.
Strategy II: Trading Reversions to the Mean
Market Profile helps traders anticipate price reversions to the mean. This strategy particularly works when the price moves too far away from the POC (Point of Control, which represents the fair value area). Primarily, a reversion to the mean strategy involves:
- Trading against an extreme move
and
- Expecting the price to return to the POC
For example, if the price moves significantly above the POC, a trader may enter a short position and expect the price to revert towards the POC as the market normalizes. Following this ideology, the trader:
- Places a stop-loss above the recent high to manage risk
and
- Set a profit target near the POC
Strategy III: Trading Within Defined Ranges
Market Profile is also useful for trading within defined ranges, especially during periods of low volatility. When the market is range-bound, traders look for opportunities to:
- Buy at the VAL
and
- Sell at the VAH.
By doing so, they capitalize on predictable price movements within the range. Let’s understand this strategy better through some simple steps:
-
- Step I: Buy at Value Area Low (VAL):
- When the price approaches the lower boundary of the Value Area (VAL), the trader enters a buy position.
- They expect the price to rebound and move back towards the Value Area High (VAH).
- Step I: Buy at Value Area Low (VAL):
- Step II: Set Stop-Loss Below VAL
-
-
- Place a stop-loss order just below the VAL.
- This helps to protect against a breakdown and limits losses if the price continues to decline.
-
- Step III: Sell at Value Area High (VAH)
-
-
- As the price moves towards the upper boundary of the Value Area (VAH), the trader plans to exit the position by selling at the VAH.
- At this stage, they expect a price pullback from this level.
-
- Step IV: Repeat Within the Range
-
- The trader continues to trade within the defined range.
- They buy near the VAL and sell near the VAH.
- By doing so, they take advantage of predictable price movements in a balanced market with oscillating prices.
Conclusion
Market Profile for intraday trading can significantly enhance your trading decisions. Using it, you can identify crucial levels such as the Point of Control (POC), Value Area High (VAH), and Value Area Low (VAL). These levels indicate where the most trading activity occurs and provide a clearer view of where the market is likely to stabilize, reverse, or break out.
By focusing on these levels, traders can make more informed decisions about where to enter and exit trades. For example, buying near the VAL or selling near the VAH can help traders capitalize on predictable price movements within a defined range. Additionally, the Market Profile allows traders to anticipate potential breakouts or reversals by showing where trading volume is concentrated.
This way, Market Profile gives traders a better understanding of market dynamics and improves their ability to identify opportunities. Also, traders can enhance their decision-making process by using our advanced market analysis tools. We offer several modern features like liquidity heatmaps, volume indicators, and more that can significantly increase your trading success. Join us today and see the difference.
Sign Up Now