See liquidity more clearly in real time.
Compare plans to access deeper market visibility for liquidity.
Market Analysis
December 26, 2025
SHARE
Volatility Days and Liquidity Behavior: How to Read Market Chaos Through Order Flow
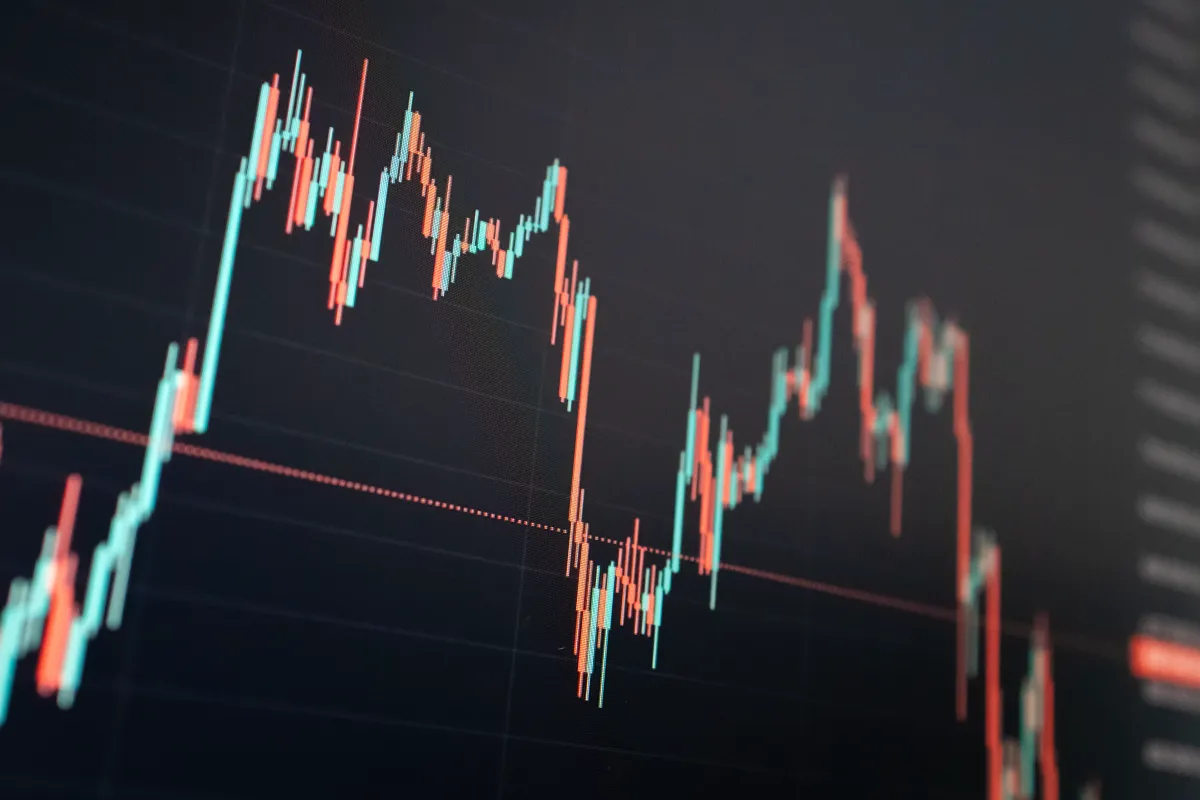
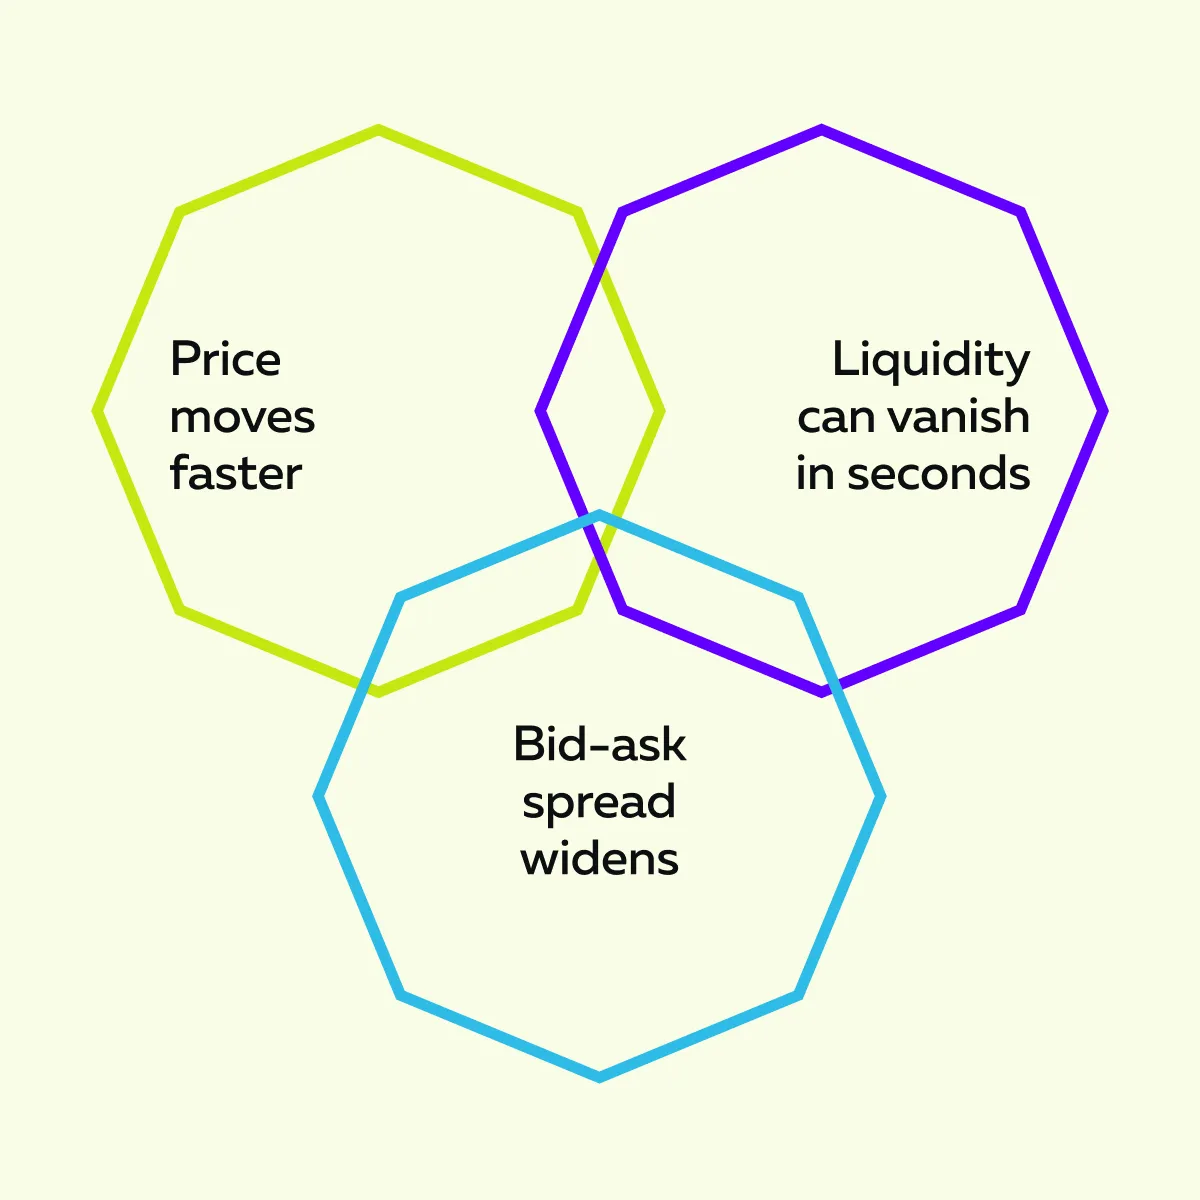
Volatility can make or break a trader. On some days, high volatility can make the market feel electric. You observe prices fluctuating rapidly, spreads widening, and orders vanishing within seconds.
How does it trick traders? Many traders mistake that speed for opportunity and rush in. The result? They get caught in the trap, and losses follow.
So how do you avoid this? First, understand that volatility doesn’t destroy market structure. Instead, it changes how liquidity behaves. To survive on high-volatility days, you must see these liquidity changes in real time. When you understand why and how liquidity changes during volatile sessions, you stop reacting emotionally and start reading traders’ real intentions.
Read this article to learn about the connection between trading volatility and liquidity. Also, discover how you can adjust your strategy to trade with structure.
What Happens to Liquidity When Volatility Spikes
When volatility spikes, liquidity in the market usually dries up. This means there are fewer buy and sell orders available at each price level. But why is this scarcity created? That’s because traders and institutions pull their resting limit orders. They do so to protect themselves from unpredictable price swings.
In calm markets, a regular flow of bids and offers maintains stable prices. But when volatility rises, that balance breaks. Most market participants step back in such situations to manage risk, which results in fewer orders being in the book.
The impact? Liquidity gaps or “air pockets” form. In these zones, price can jump sharply from one level to another with very little traded volume in between.
As explained in the Trader Lab session, trading volatility and liquidity are deeply connected. When one expands, the other contracts:
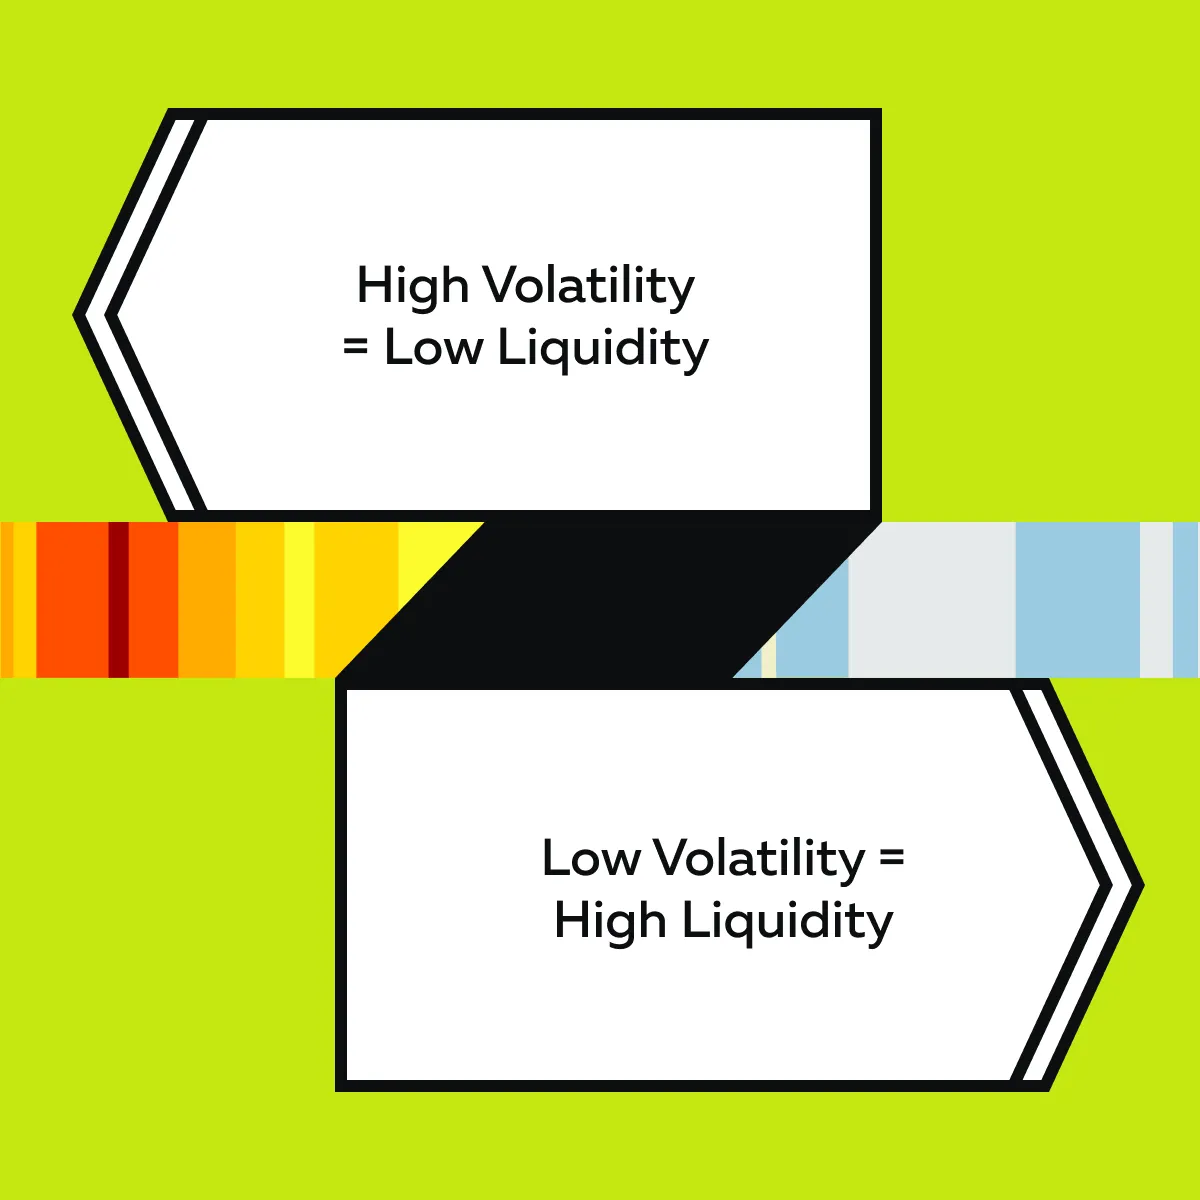
As a trader, you must understand that high volatility exposes where real buyers and sellers are willing to engage. By reading order flow, liquidity clusters, and volume nodes, you can spot these changes early and avoid getting caught in sudden price surges or drops.
Primary Behaviors When Volatility Rises
Besides reacting inversely to volatility, liquidity also exhibits certain defined behaviors during spikes. It may move, disappear, and then return. Let’s see how it works:
1. Liquidity Removal
Before a strong move starts, passive orders vanish. Traders and market makers cancel their limit orders to avoid being caught on the wrong side of momentum. The order book becomes thinner, causing rapid price fluctuations.
2. Spread Expansion
As uncertainty grows, the bid–ask spread widens. Buyers and sellers are farther apart on price. Due to this, market makers reduce their size or step back entirely.
In such a trading environment, the price can fluctuate strongly even with small trades. That’s why trading volatility and liquidity in these conditions feels unstable.
3. Stop Cascades
When price breaks through key levels, stop orders trigger in clusters. They create a rush of forced buying or selling. This adds momentum to the move and further accelerates the spike in volatility.
4. Re-Liquification
After the “flush,” larger players start rebuilding liquidity near the new extremes. They add limit orders again and try to stabilize the market. The result? Price again finds a balance, and volatility reduces.
For more clarity, let’s study an example:
-
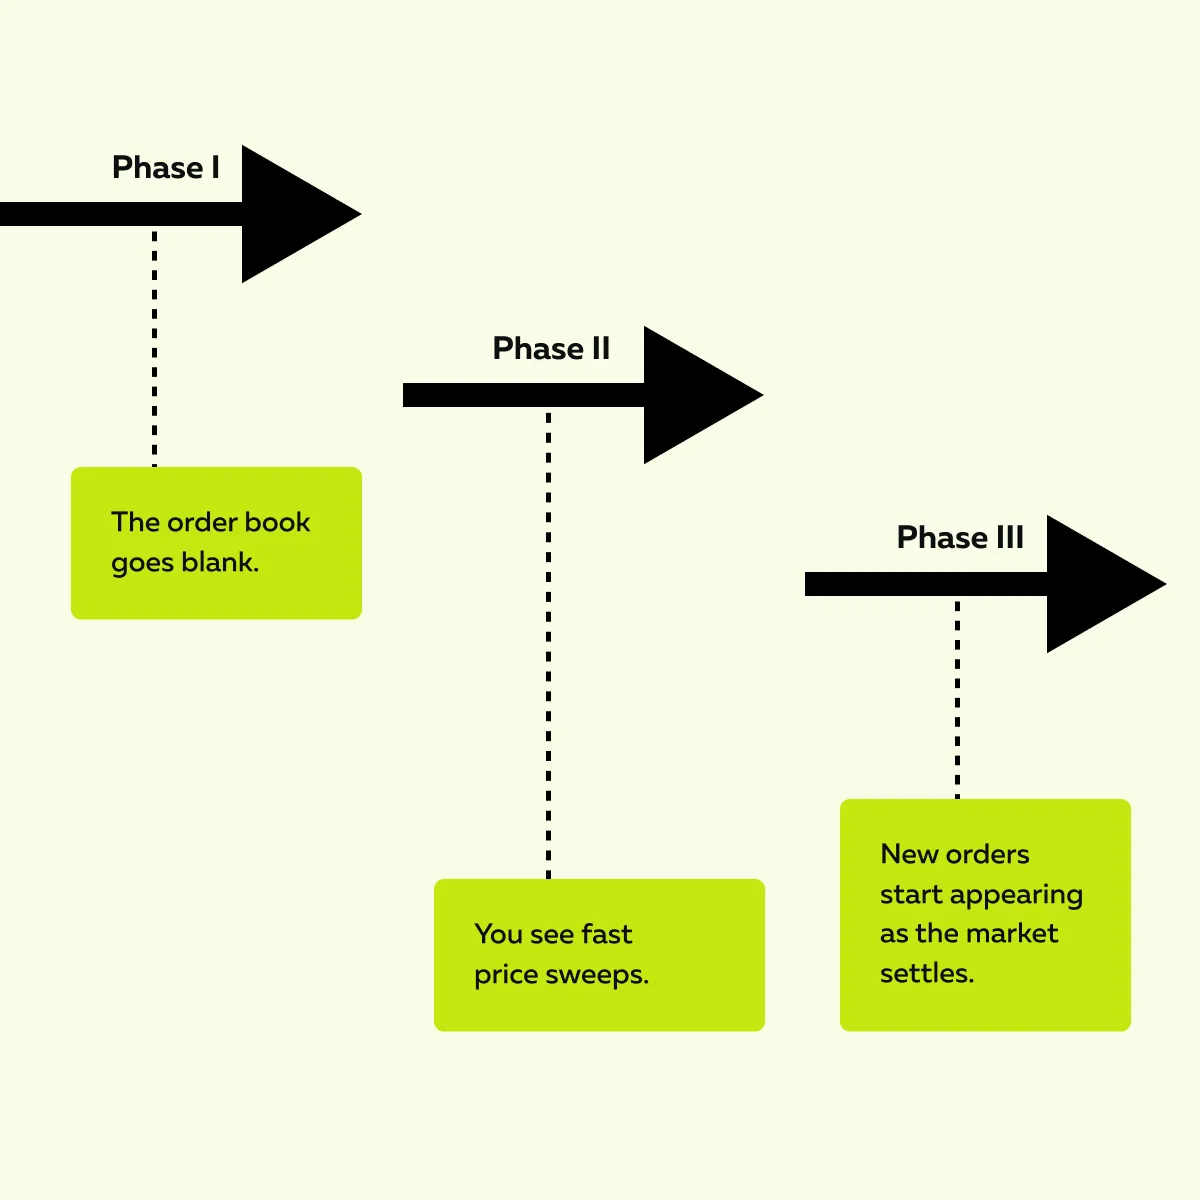
- When major news breaks (such as tariff announcements or CPI reports), the market can react quickly.
- In those moments, liquidity (the buy and sell orders) often disappears for a few seconds.
- This happens because traders quickly pull their orders to avoid risk.
- Now, as a result, prices jump far away very quickly (sometimes hundreds of ticks).
- This happens because there are no orders left to slow the move.
- Later, once the news shock passes, liquidity comes back.
- Traders start placing their orders again, and the market begins to calm down.
Want to see all this in real time? You can start using market analysis tools, such as Bookmap. These tools offer a special heatmap that lets you visualize all these activities in real time.
So, as Tom B. also explained in his session, high volatility temporarily breaks the market’s structure. Due to this:
- Liquidity disappears,
- Spreads widen, and
- Stops trigger.
However, once the shock passes, the market re-liquidifies and resumes its auction process. Track absorption and stop runs in fast markets → Compare Packages.
The Psychology of Volatility Days
Volatility days test a trader’s mindset more than their strategy! Many traders are unable to control their emotions and mistake speed for opportunity. What do they feel? – Prices are flying, and if I don’t jump in, I’ll miss the “big move”.
But as Tom B. explains, trading volatility and liquidity requires reading market behavior—not chasing price. Let’s see what usually goes wrong during volatility days:
| Buying Breakouts Without Confirmation | Over-Leveraging | Confusing Speed With Edge |
or
|
|
|
Note that volatility doesn’t change the rules of trading. Instead, it just reveals who truly follows them.
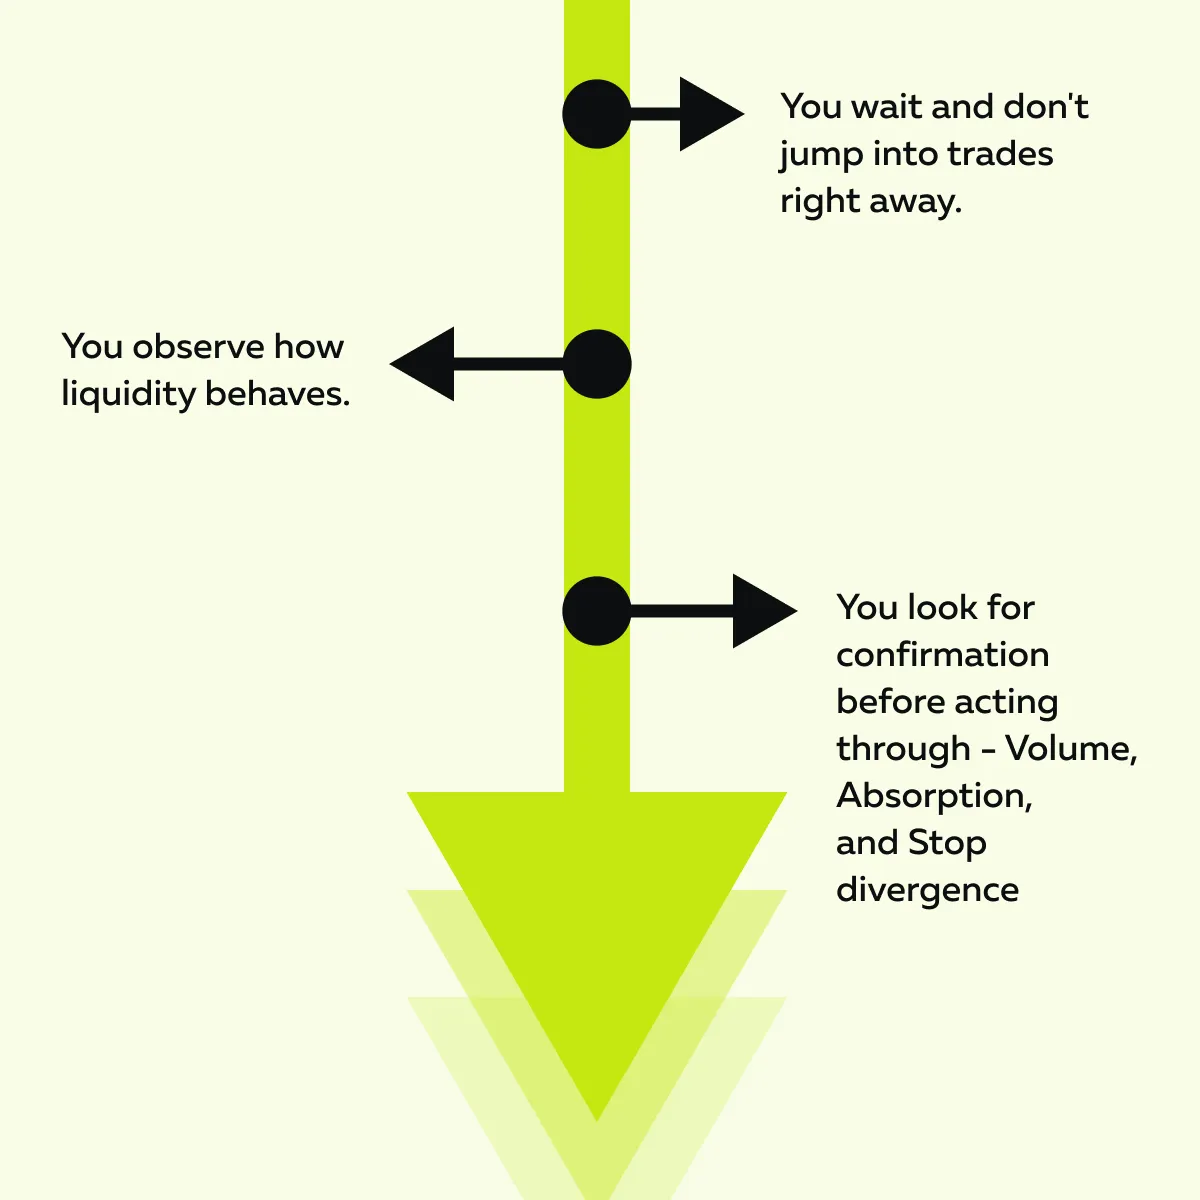
On volatile days, observation beats reaction. When everyone else does guesswork, you, as a disciplined trader, should calmly watch how real participants are influencing the market.
Reading Liquidity Behavior in Real Time
Want to trade well on volatile days? You must read how liquidity behaves as the market moves. Advanced tools like Bookmap make this possible by showing where orders appear, disappear, or move. Additionally, on Bookmap, you can study the liquidity patterns and understand:
- Who’s stepping in,
- Who’s backing off, and
- Where the price might turn next.
Below are four key patterns to watch:
| Liquidity Pattern | What It Means | What You See on Bookmap | How to Interpret the Pattern |
| 1. Liquidity Vacuum |
|
|
|
| 2. Absorption at Extremes |
|
|
|
| 3. Spoofing and Fade Signals |
|
|
|
| 4. Liquidity Rebuild |
|
|
|
For more clarity, let’s study an example:
- After a quick drop in the Nasdaq (NQ), you might see liquidity reappear just below the previous low.
- That zone often becomes new support.
- It offers a clear setup for a bounce once volatility cools.
Trade volatile sessions with confidence, not chaos → Compare Plans.
Adapting Your Execution on Volatility Days
When volatility spikes, the normal rules of trade execution no longer work the same way. Why? That’s because:
So, what to do to survive? You need to adjust both your size and timing to match the new market conditions. This is how you can adapt:
1. Reduce Position Size
Volatile markets amplify both profits and losses. Even small moves can cause big swings in your P&L. Thus, as a tip, reduce your size. It allows you to stay calm and lets you manage both trading volatility and liquidity risk without emotional pressure.
2. Widen Stops Logically
Don’t use fixed stop distances on volatile days. Instead, base stops on liquidity zones. These are areas where real buyers or sellers are visible. The advantage? Your trade gets more breathing room. Additionally, you can define your risk based on the actual market structure rather than random tick counts.
3. Wait for Rebuilds
Avoid entering during a “liquidity flush”. These are market times when:
- Orders disappear,
and
- Price is unstable.
As a savvy trader, you must wait until you see liquidity re-enter the book. This typically occurs when passive orders begin to return and the market starts to rebalance. Now, that’s your signal that conditions are calming, and structure is forming again.
4. Focus on Reaction Zones
Try to trade where the market shows real interest (for example, at absorption points or volume clusters). This aligns your execution with actual order flow and gives you a better statistical edge.
See how liquidity shifts during volatility with Bookmap’s real-time heatmap → Compare Packages.
Case Study: The Volatility Trap and Rebuild
Tom B., in his session, specifically explains a market event as the “volatility trap and rebuild”. It is the process of how the market becomes calm and organized again after a volatile event. Let’s understand it through a case study:
- a) Initial News Shock
- A sudden headline or data release hits the market.
- Traders rush to manage risk.
- Liquidity vanishes as participants pull their orders.
- With no bids left, the price drops rapidly (possibly 60 ticks in seconds).
- b) Panic Selling
-
- As the drop accelerates, stop orders trigger in waves.
- These forced sells add even more momentum.
- On Bookmap, you’ll see delta (selling pressure) going deep into negative territory.
- To most traders, this appears to be a total collapse.
- But then something changes!
- c) Absorption
-
- You’ll notice volume increasing, but price stops falling.
- This is where major market buyers (big money) quietly step in.
- They start absorbing the selling pressure.
- Now, it’s the first sign that the market is starting to find its footing.
- d) Liquidity Rebuild
- Soon after, new bids appear just below the low.
- On Bookmap, this shows up as a fresh layer of liquidity.
- The order book begins to thicken again.
- It’s proof that the panic is easing, and participants are ready to trade based on structure (not emotion).
- e) Reversal
- As liquidity rebuilds, the market returns to its original value range.
- Those traders who track order flow and analyze liquidity behavior see this change happen in real time.
- In contrast, those who are only watching prices see “volatility”. They miss the turning point!
So, what did you learn from this scenario? Liquidity tells the real story. As a trader, you should check withdrawal, absorption, and re-entry. Those who can read that story don’t just survive volatility days; they find structure and trading opportunities inside them.
Conclusion
By now, you know that volatility days might look wild, but they follow a clear rhythm. And to understand this rhythm, you must track how liquidity disappears, reappears, and absorbs. By following such an approach, you stop reacting to speed and start trading the story behind it.
Always remember that each pull, rebuild, and absorption tells you what real participants are doing (and not what indicators suggest).
Need a tool to track order flow and liquidity behaviour in real time? You can start using Bookmap and view the liquidity behavior in real time. See how Bookmap visualizes these transitions so you can respond with data, not emotion. Compare Packages to start seeing the real structure behind volatile markets.
FAQs
1. Why does liquidity vanish during volatile moves?
When volatility spikes, big traders and market makers pull their resting orders. They do so to protect themselves from sudden moves. The result? There are fewer bids and offers in the market, which creates “liquidity vacuums.”
Now, due to less resistance in the market, the price fluctuates strongly until traders start placing new orders again.
2. How can I avoid getting trapped on volatility days?
Stay patient and don’t chase fast moves! As a trader, you should wait until you see:
- Liquidity rebuilding,
and
- Signs of absorption.
These signals show the market is returning to its normal behaviour, that is,
- Prices are more stable,
- Liquidity comes back, and
- Buy/sell activity becomes more balanced.
This is when it is comparatively safer for traders to plan their next moves. Remember that entering mid-panic often means buying the top or selling the bottom.
3. Does higher volatility mean more opportunity?
Not always. Volatility increases both the expected reward and risk. As a trader, if you don’t understand liquidity behavior, volatile markets can trap you easily.
So, from where does the real opportunity come? You should wait for structure and trade only when order flow shows clear buying or selling interest (not random movements).
4. How does Bookmap help during volatile sessions?
Using Bookmap, you can:
- See liquidity in real time,
and
- Observe where orders are pulled, absorbed, or rebuilt.
Additionally, you can watch the actual behavior of market participants and act with context. This knowledge transforms volatility from “confusion” into “100% visual information,” enabling you to trade more confidently.
Sign Up Now