See mean reversion more clearly in real time.
Compare plans to access deeper market visibility for mean reversion.
Trading Basics
October 29, 2025
SHARE
Momentum vs Mean Reversion: Which Dominates in a Choppy Market?

Do you know why most traders lose? – You’ll say they lack strategy, but that’s not the only reason! Most traders fail because they can’t recognize whether the market is in momentum or mean reversion. Be aware that price action only makes sense when you know which regime is in control.
When you can’t spot the regime, even the best setups turn into costly mistakes. So, what are these phases? A momentum phase occurs when the price moves with strength. Here, liquidity pulls away, and aggressive flows dominate. In contrast, mean reversion shows up when the price is capped. In this phase, volume slows, and large passive orders get absorbed.
And how to spot them? The difference between the two is visible in liquidity, order flow, and tape speed. Want to learn in detail? In this article, you’ll understand both regimes step by step. You’ll also learn to identify them in real time. Read this article to the end to stop guessing and start reading the market with 100% clarity.
What’s the Difference Between Momentum and Mean Reversion?
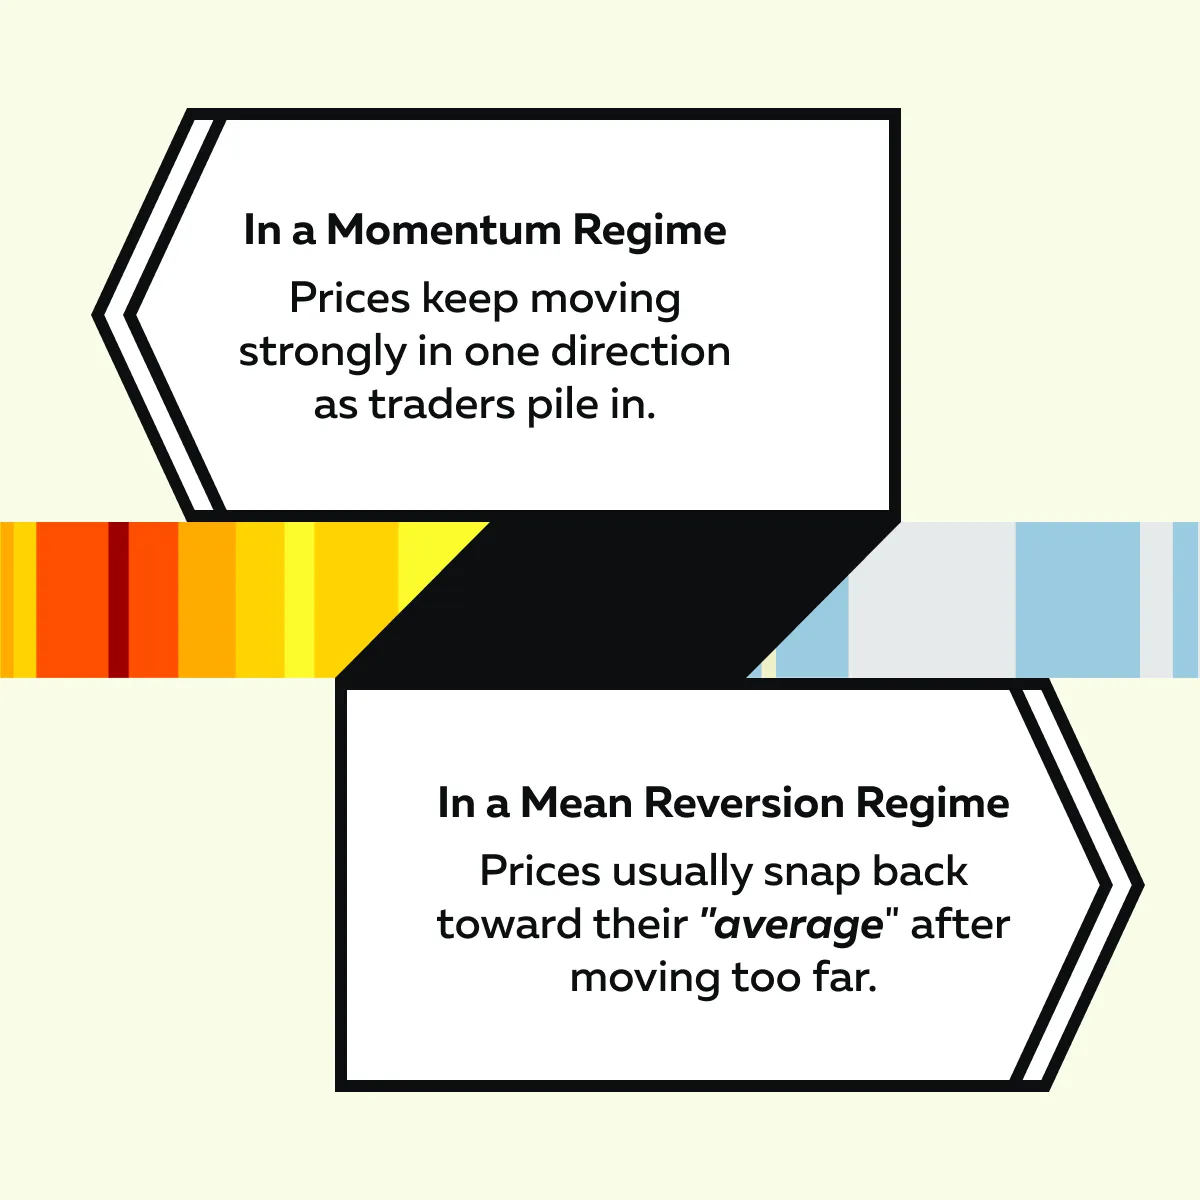
Momentum and mean reversion are two opposite ways markets behave. In both regimes, the price movement is different. Let’s see how:
But should I, as a trader, learn them? When you know the difference between these regimes, you can pick the right strategy. And Right setup = Profitable trades! Now, let’s understand them in detail:
Momentum Regime
Momentum means the market isn’t just moving. Instead, it’s running with force! In such a market,
- Prices climb because buyers keep lifting offers
or
- Prices fall because sellers keep hitting bids.
Also, most of the time, liquidity steps aside and leaves “open air” for the move to continue. Okay, but when does this happen? These momentum setups usually happen during:
- Big news releases,
- Breakout sessions,
and
- Strong trend legs.
Let’s understand better through an example. Let us say you are trading ES Futures (S&P 500 index futures). Suddenly, a CPI report comes out that is much stronger than expected. This news surprises the market and causes traders to react quickly.
- Buyers rush in to buy at higher prices because they expect the market to go up.
- Sellers step back! They don’t want to sell into a strong move.
- As a result, liquidity disappears.
- As more buyers keep entering, volume increases.
- This means lots of trades are happening in the same direction.
Now, what does this situation show? – It shows a momentum market. The price is moving strongly in one direction. Trying to go against it or fading the move can be very risky because the trend is supported by strong demand.
Mean Reversion Regime
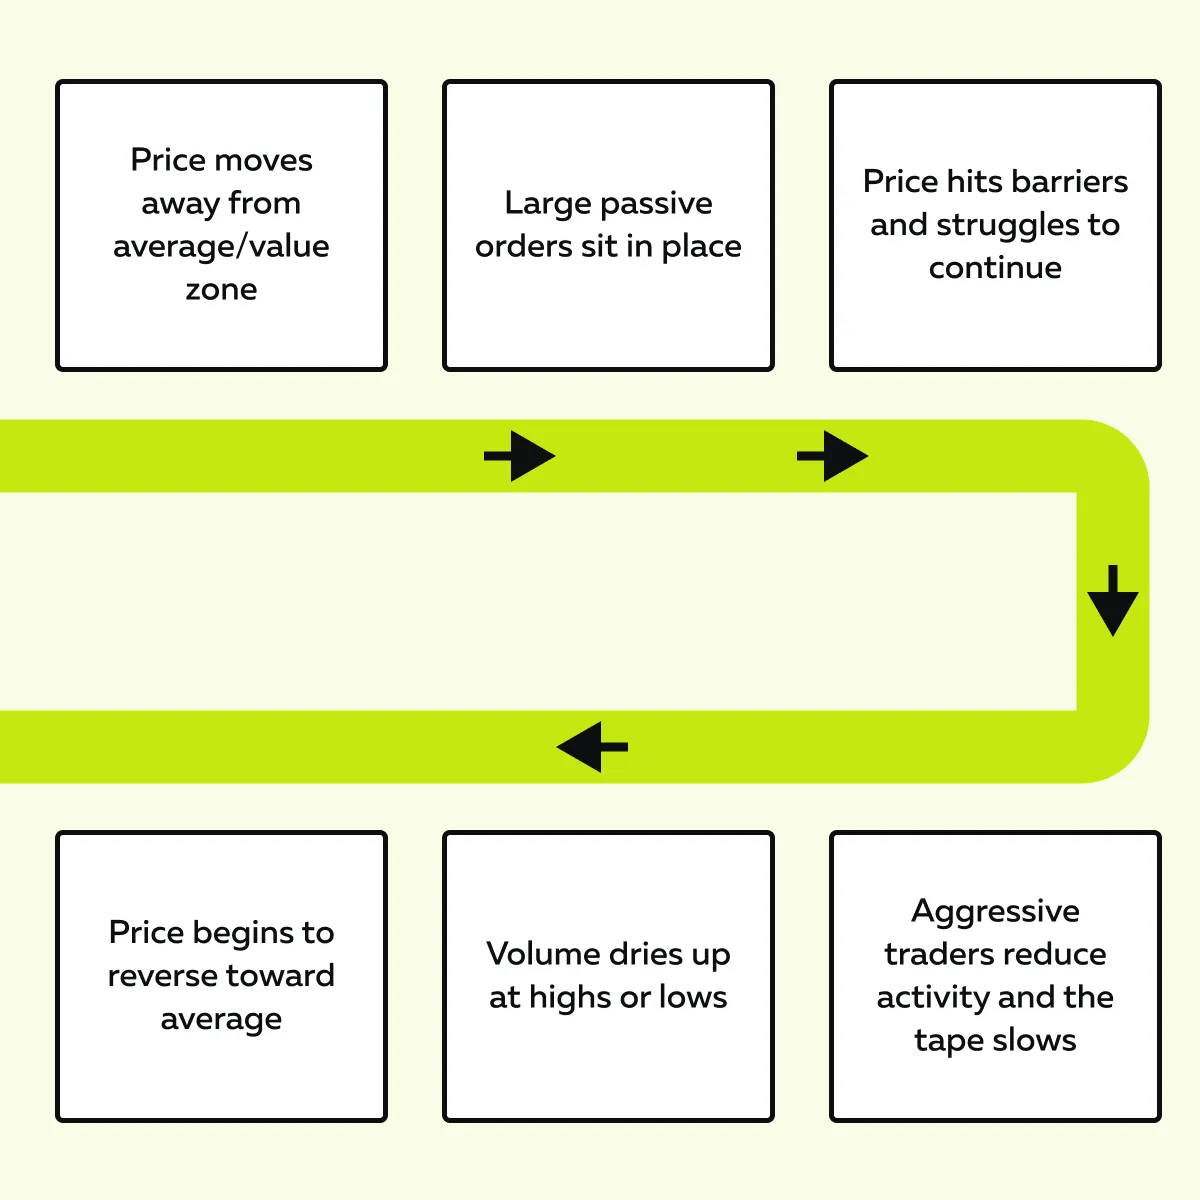
Mean reversion is the opposite of momentum. Instead of running in one direction, price returns to its “average” or a “fair value zone”. But why? That’s because of the presence of large passive orders like iceberg orders or resting liquidity. They often act as barriers and cap price moves. They prevent prices from running too far.
Furthermore, in this regime, the tape usually looks slower! This happens because volume dries up as price moves far away from its normal range or average (toward very high or very low levels). As a result:
- There are fewer buyers or sellers who are actively trading
and
- The move slows down. It is now more likely to reverse toward the average or value area.
So, when price is extreme + trading activity drops = It’s a mean reversion opportunity!
Okay, but where can I see mean reversion? It is more common during quieter times like:
- Pre-market,
- Lunch hours,
and
- Sideways sessions.
For more clarity, take Bitcoin as an example. Let’s assume price pulls away from VWAP. However, it keeps hitting resting sell orders and struggles to increase further. After several failed attempts, price drifts back down toward VWAP or the center of the prior range.
How should you interpret this? Momentum fades + mean reversion is in play. Don’t trade blind in chop—watch liquidity shifts in real time.
Signs You’re in a Mean Reversion Market
What should you observe while spotting mean reversion? – Check when the price keeps getting pulled back instead of running away. As told before, this regime is different from momentum, where price pushes with strength. In contrast, during a mean reversion regime, the market shows hesitation. Let’s see how:
Now, these are the signals that the price is more likely to return to its average than trend further. Let’s understand them in detail:
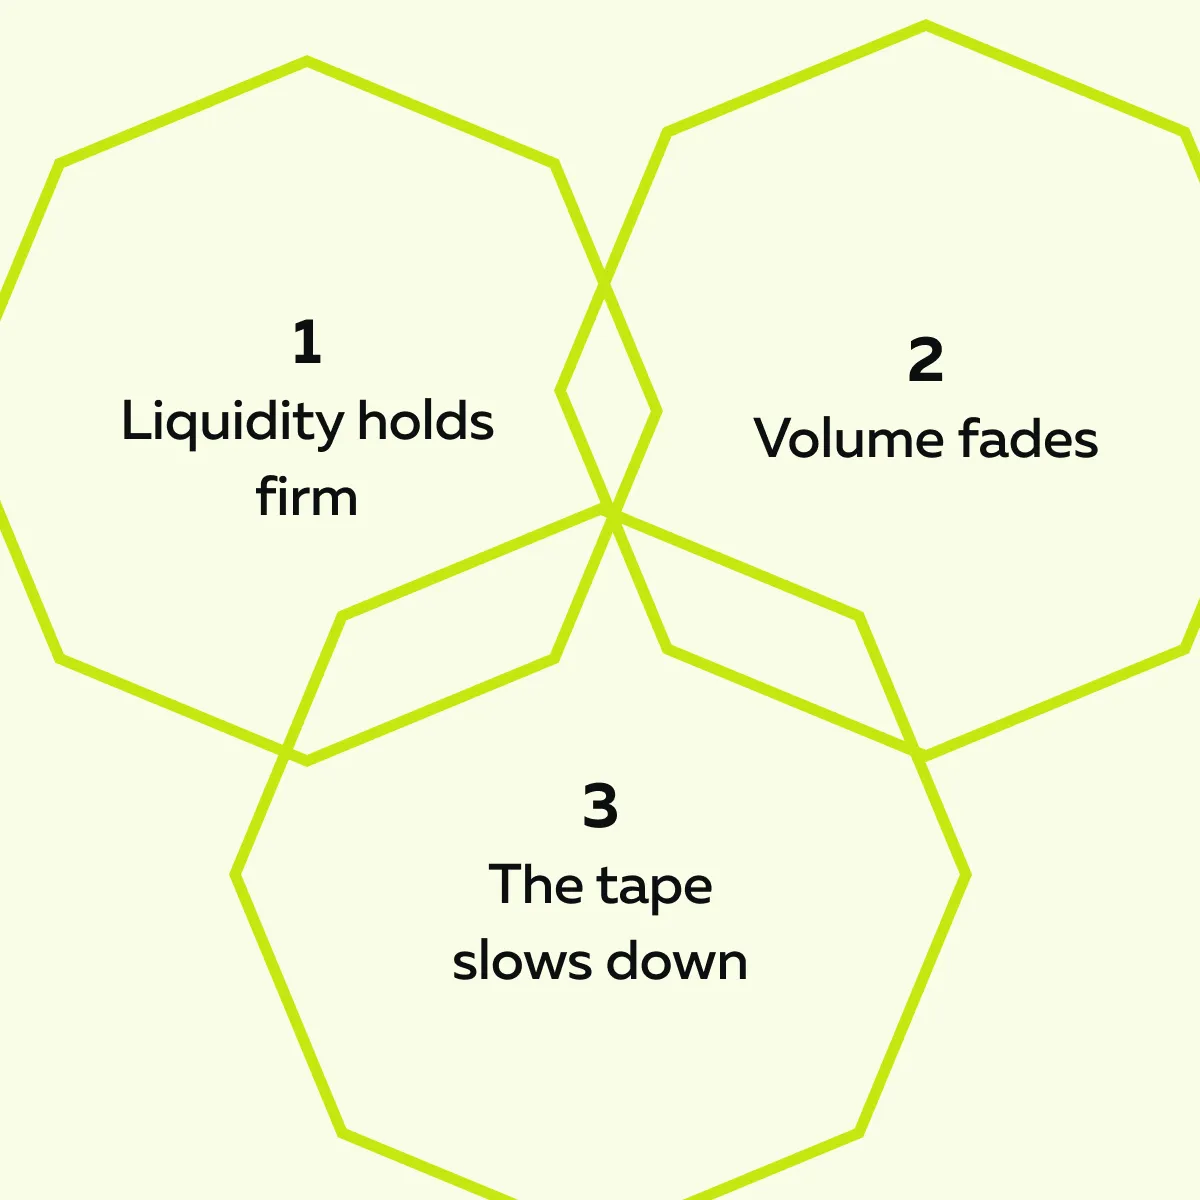
1. Liquidity Sits and Absorbs
In mean reversion, large orders don’t vanish! Instead, they stay in place and act like a wall. Price may test those levels again and again but fail to break through.
In these markets, sometimes iceberg orders (hidden size) keep absorbing aggressive buyers or sellers. This absorption prevents a breakout from happening. Interpretation? The market is capped and favours a return toward the middle.
2. Pace of Tape Slows into Extremes
Do you know what happens when price drifts too far from its range? – The tape slows down! Fewer aggressive orders hit the market, and volume dries up at highs or lows. Without the urgency of aggressive trades, momentum fades and aggressors lose control. That’s when the market is more likely to mean-revert than extend.
3. Responsive Buyers and Sellers Dominate
In a mean reversion regime, traders don’t chase the move! Instead, they’re fading it. How? This is what happens when price stretches too far:
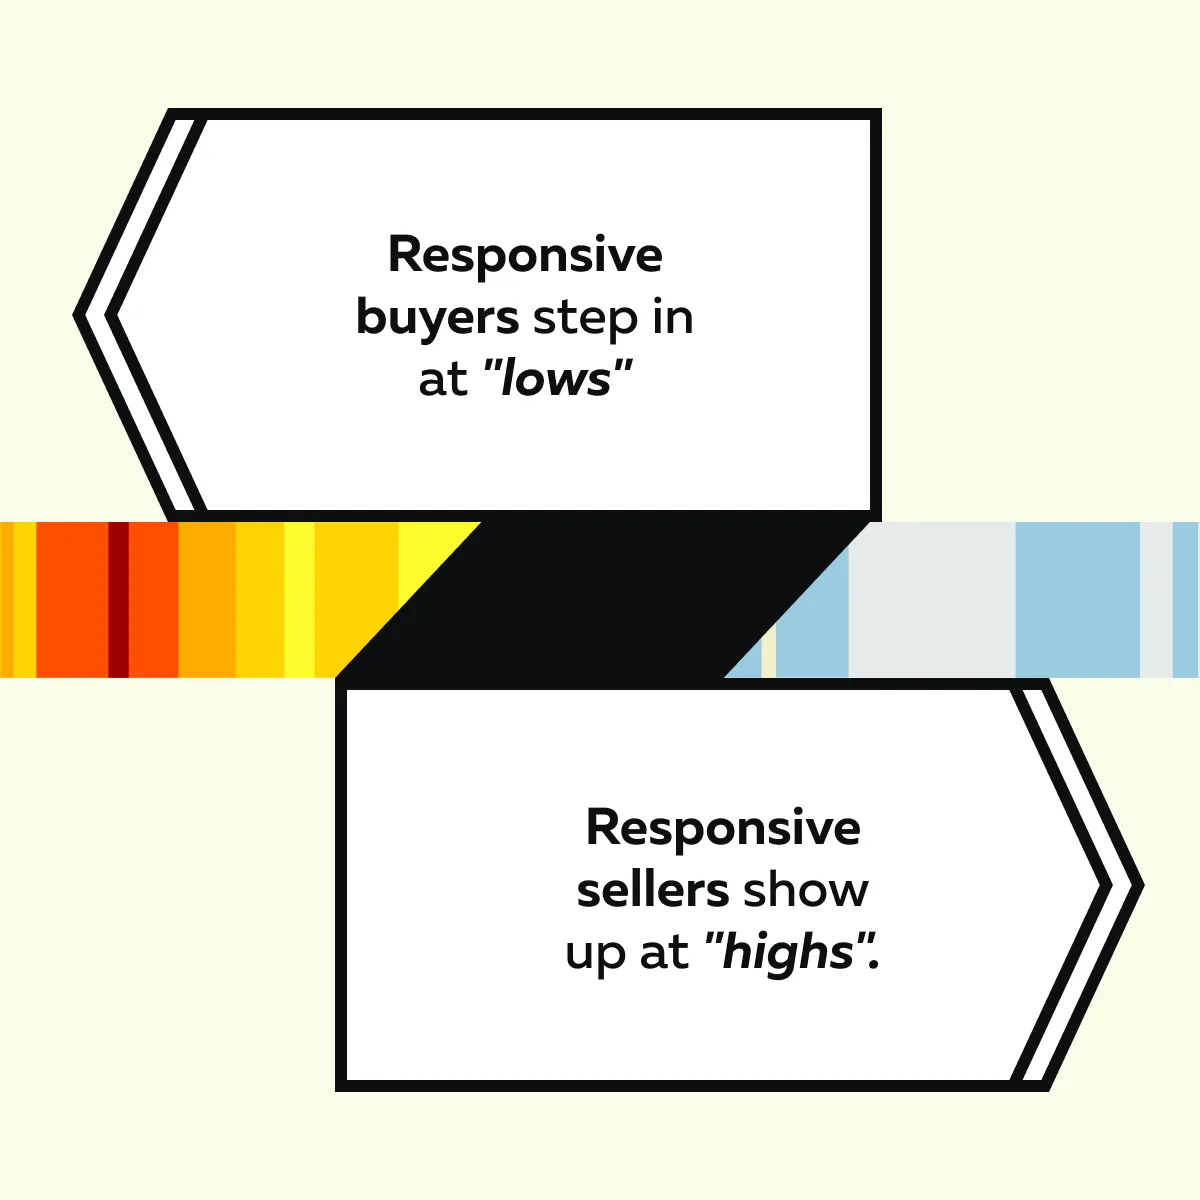
Now, due to this stepping in at extreme ends, the price does not follow momentum. Rather, it keeps gravitating back toward balance points like VWAP or a high-volume node. But how to see it? You can clearly see this on real-time market analysis tools, like Bookmap.
On Bookmap, you can see this as price bouncing between clear zones of liquidity. Each push is met with an opposite response! This keeps the market range-bound rather than trending.
Want to Trade Better? Follow this Practical Tip!
Realize that in choppy conditions, being patient is highly important! You should wait for:
- Price to travel to the outer edges of the range,
and
- Then let it stall near visible liquidity.
To spot this, you can look for signs like “slowing tape” and “absorption before entering”. Also, avoid chasing moves in the middle (when the price is near the middle of a range or average). That’s because in mean reversion markets, that’s where traders often get chopped up.
Signs You’re in a Momentum Market
A momentum market looks and feels very different from mean reversion! Instead of slowing down, price speeds up and keeps pushing in one direction. Let’s see some other ingredients of the momentum regime:
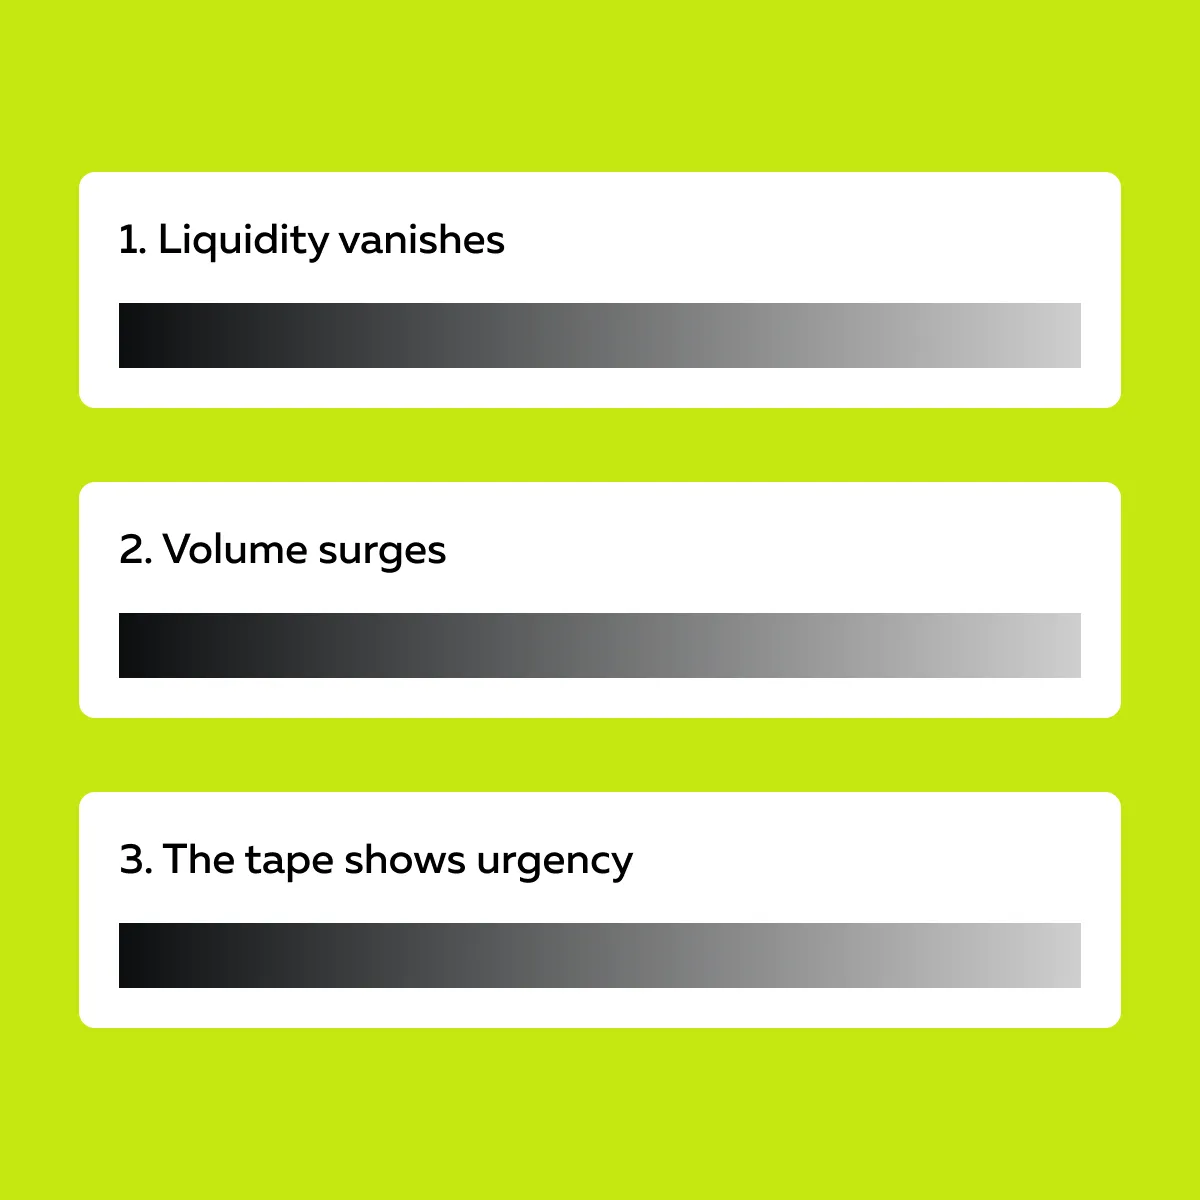
These are signals that the traders are chasing the move (not fading it). For more clarity, let’s understand these signs in detail:
1. Liquidity Disappears Ahead of Price
In a momentum market, liquidity does not stay in place to slow the price down. Instead, as price approaches certain levels, resting orders are cancelled or pulled. The impact? Due to such cancellations or pullouts, there is little resistance to stop the move. As a result, the market finds empty space, often called “air pockets.” Now, price can easily move through these air pockets.
Furthermore, the absence of liquidity shows that traders expect continuation. They prefer not to get filled against the direction of flow. This creates conditions where momentum can extend further than expected.
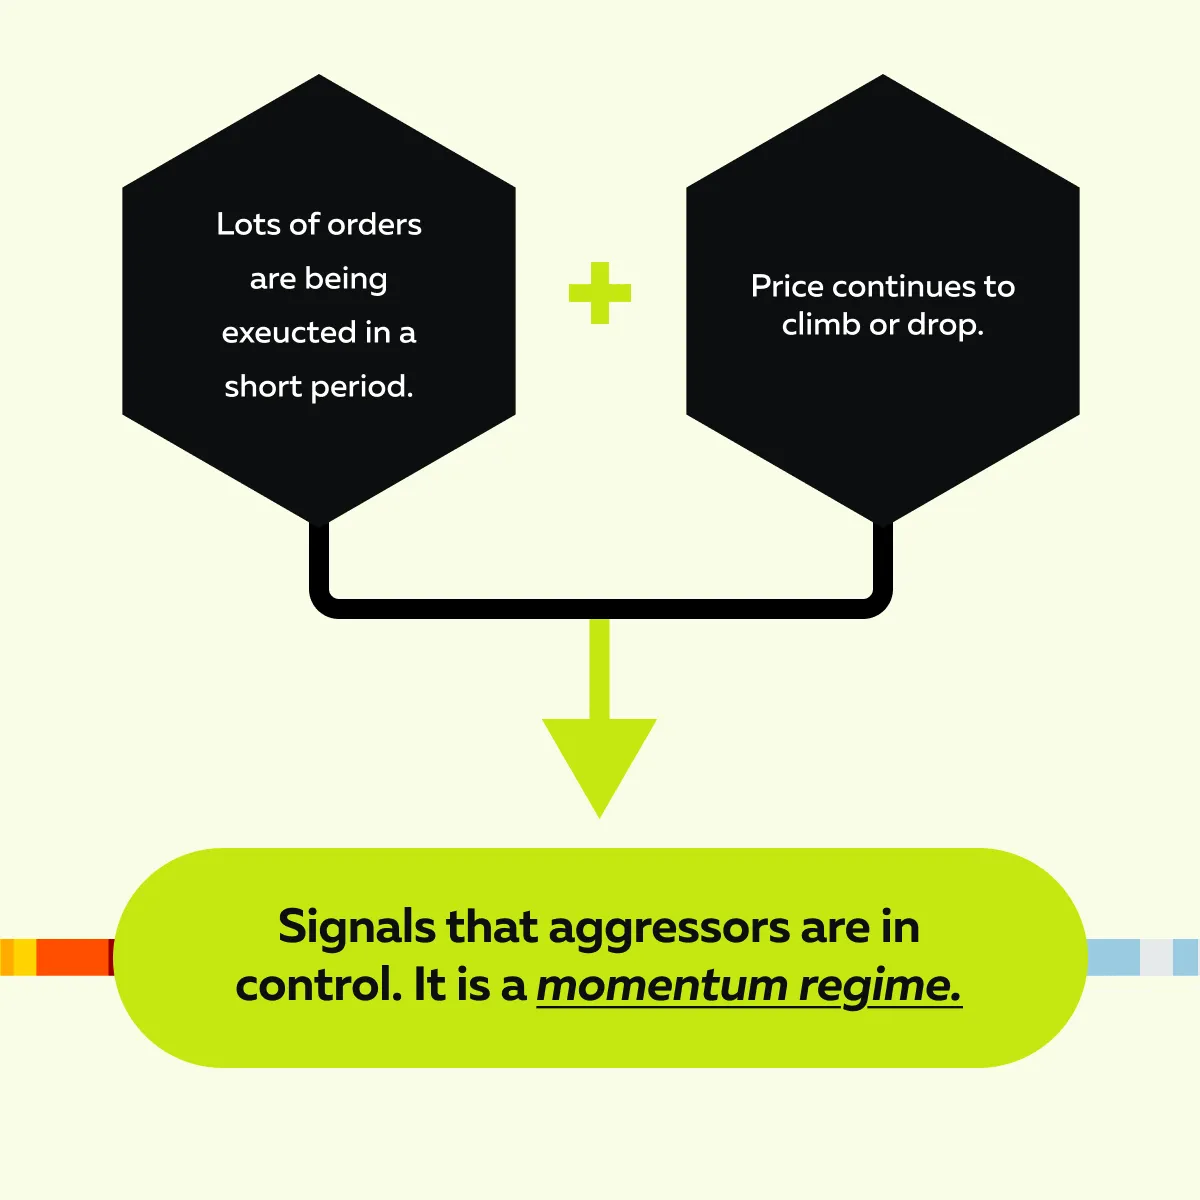
2. Tape Accelerates
Momentum is also visible in the speed of order flow. On real-time tools like Bookmap, you’ll notice:
- Volume dots appear in rapid succession,
and
- These dots cluster tightly in one direction.
Interpretation? This shows many market participants are trading aggressively at the same time. The tape (the stream of executed orders) feels faster because urgency is high.
More importantly, several veteran traders try to match this speed with directional price movement. Let’s see how:
3. Continuation Volume Follows Breakout
Are all breakouts meaningful? Nope! It is worth considering only if it is backed by real participation. As a trader, you must understand that in a momentum market, the first push through a level does not fade quickly! Instead, it is followed by more aggressive buying or selling.
This continuation volume shows that traders are committed and not just testing the level. The follow-through also separates true momentum from false breakouts. Additionally, you can confirm market strength in that direction if:
- Buyers keep lifting offers after an upside break,
or
- Sellers keep hitting bids after a downside break.
Whether it’s momentum or mean reversion, Bookmap helps you see it sooner.
Want to Trade Better? Follow this Practical Tip!
On breakout days, patience also matters. Don’t jump on the first tick through a level. Instead, wait for the price to prove that momentum is present. Join only if you see aggressive flows continue + liquidity remain thin beyond the breakout. This way, you’re trading with momentum rather than against it.
When It’s Not Clear: Tools to Read Regime in Real Time
Markets don’t always fit neatly into momentum or mean reversion! Yes, and that’s because market conditions change quickly. So, want to avoid fighting the tape? You must learn to read the regime in real time. Below are some ways to do so:
Watch How Liquidity Behaves
Liquidity tells you a lot about market intent. Let’s assume big buy or sell orders are resting in the market at certain price levels. When the price moves toward these levels, it keeps hitting these orders but can’t break through. Why? These orders act like a wall. They are absorbing the buying or selling pressure instead of letting the price move past. Now, that points to mean reversion!
In contrast, if orders pull away as the price approaches, this leaves less resistance. And that’s a sign of momentum. Pulling liquidity creates the “open air” that allows continuation.
Use Volume Dots and Tape Rhythm
Order flow reveals the character of the move. Let’s see how:
| In Momentum | In Range or Chop |
|
|
Additionally, a slower or fragmented tape usually means there’s no urgency. This favors mean reversion instead of momentum.
Recalibrate Expectations Mid-Session
Market regimes can shift within the same day! Let’s check how:
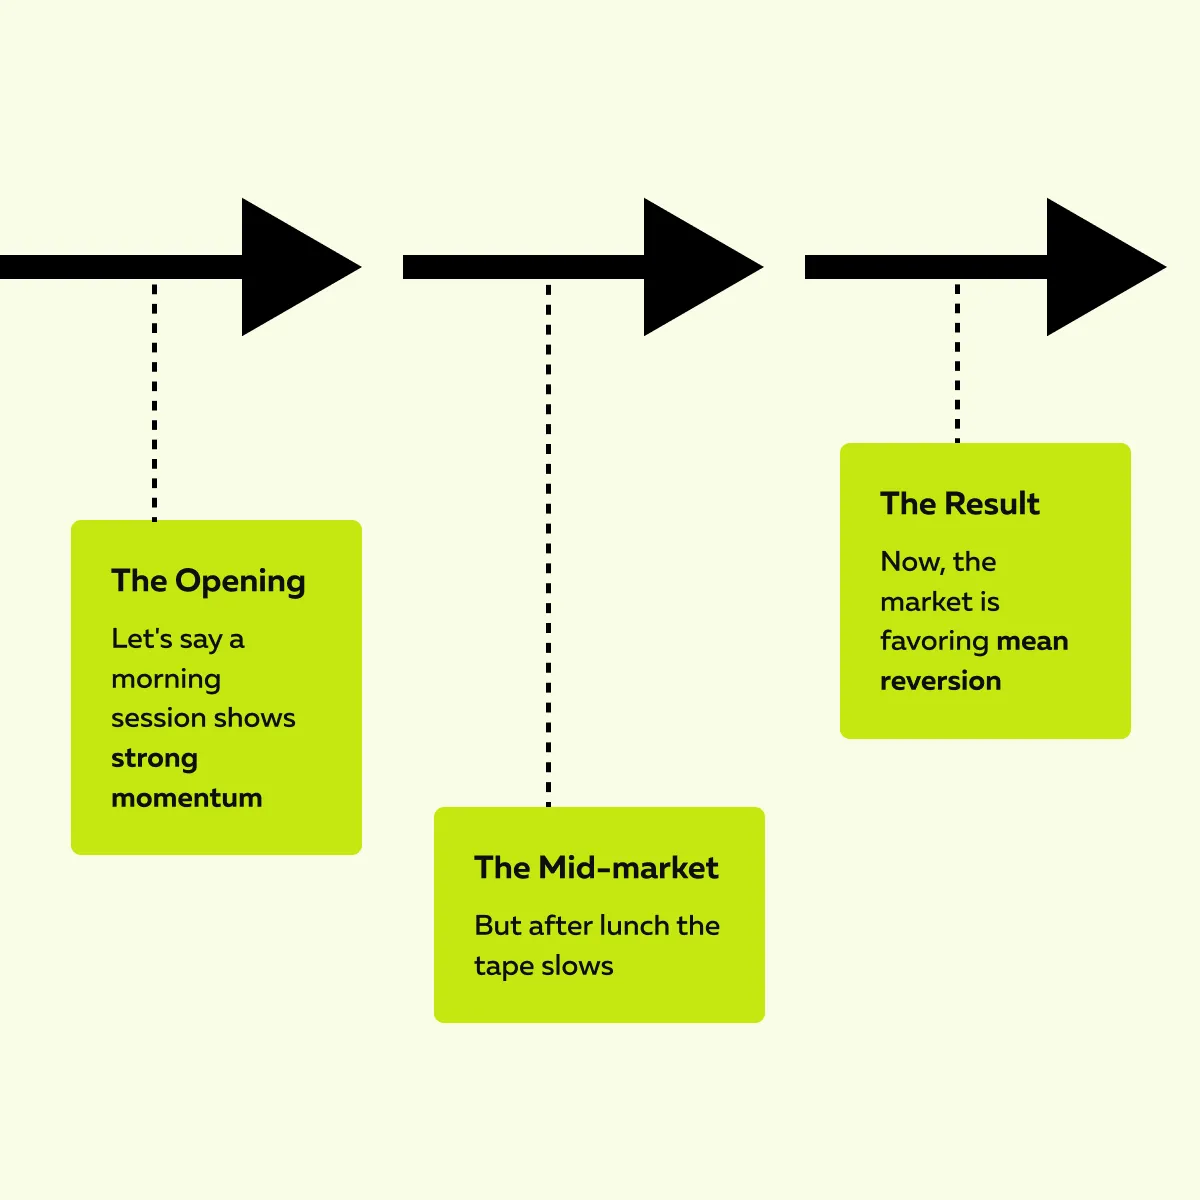
What should you, as a trader, do? Don’t cling to an early bias! You must keep checking if aggressors are still in control. This can be easily done on Bookmap, where you can easily visualize:
- When buyers or sellers give up,
- When they re-enter,
- Whether conditions are changing.
This knowledge lets you stay flexible and align with the active regime.
Practical Tips for Each Regime
Trading momentum vs mean reversion requires different approaches. This is how you can adapt to each regime:
If Mean Reversion
In a mean reversion market, the price bounces between the edges of a range. It does not trend strongly! Now, the middle is where traders often get chopped. Thus, you should always focus on extremes. Try to spot signs of passive control, like large orders sitting firm or absorption at highs or lows. That shows the market is rejecting continuation.
Additionally, size down your trades and wait for the tape to slow or stall before entering. Once in, aim for realistic targets like VWAP or the center of the value area (as that’s where price often drifts back).
If Momentum
In a momentum regime, you shouldn’t chase too early, as that can be risky. And at the same time, fading is even worse. Thus, don’t guess breakouts! You should wait for the move to confirm with strong follow-through. Now, after confirmation, look for pullbacks where liquidity fails to reappear. It signals there’s still room for continuation.
Need one of the best signals? It’s a volume continuation. It shows aggressive orders hitting bids or lifting offers.
Conclusion
So, till now, you must have understood that learning the difference between momentum and mean reversion is more than just theory! Instead, by observing both these regimes, you can learn how the market behaves in real time.
If we talk about how these concepts differ, momentum is a single direction of price increase/decrease, along with disappearing liquidity + aggressive order flow. On the other hand, mean reversion happens when the price goes back to the average. You can spot it through stable liquidity and slowing tape. What’s the benefit of recognizing these behaviors?
- You prepare the right strategy,
- You avoid unnecessary losses, and
- You trade with confidence.
Always remember that you gain a trading edge when you stop guessing and follow the regime the market is showing. Want to make this process clearer? You can start using the real-time market analysis tool, Bookmap.
By using Bookmap, you can easily visualize liquidity, volume, and order flow. Such a visualization lets you see exactly when price movements are due to momentum or when mean reversion is likely. Tired of guessing the market regime? Let Bookmap show you who’s in control.
FAQs
1. What’s the best way to identify a mean reversion market?
A mean reversion market shows prices failing at the same levels again and again. There are three major signals to identify such a market:
- Large orders sit and block moves (acting like walls).
- Volume slows down.
- Trades bounce back and forth instead of breaking out.
When you observe these clues in the market, you must realize that the price is more likely to return to the middle than trend strongly.
2. Can a market switch from mean reversion to momentum mid-session?
Yes! A market can flip quickly if something big happens, like:
- Economic news,
- A sudden volume spike, and
- A stop run.
These events remove barriers and create urgency! Also, they change the conditions from sideways to trending. By watching how liquidity behaves + how fast trades hit the tape, you can spot this switch in real time.
3. Why do traders struggle with choppy conditions?
Traders struggle in choppy conditions because they use trending strategies in a sideways market. In most cases, it has been observed that they:
- Buy too early,
- Get trapped in false breakouts, or
- Exit trades emotionally.
But please realize that in mean reversion, the price keeps bouncing instead of running. Without recognizing this, as a trader, you might end up chasing the wrong side + get caught in repeated small losses.
4. How does Bookmap help with identifying a regime?
Bookmap shows what’s happening under the surface! Using it, you can see:
- If liquidity is sitting or pulling,
- How fast the tape is moving, and
- Whether buyers or sellers are in control.
By visualizing absorption, aggression, and flow, Bookmap makes it easier to tell if the market is trending or reverting in real time.
5. Should I only trade trending markets?
No! Both momentum and mean reversion can be profitable. However, you must adapt your approach.
- In trending markets, you follow the flow.
- In mean reversion, you fade extremes and target the middle.
Need some tips? You must learn to recognize early which regime you are in. Next, you must adjust your entries, targets, and size to fit that behavior.
Sign Up Now