See aggressor exhaustion more clearly in real time.
Compare plans to access deeper market visibility for aggressor exhaustion.
Education
August 8, 2025
SHARE
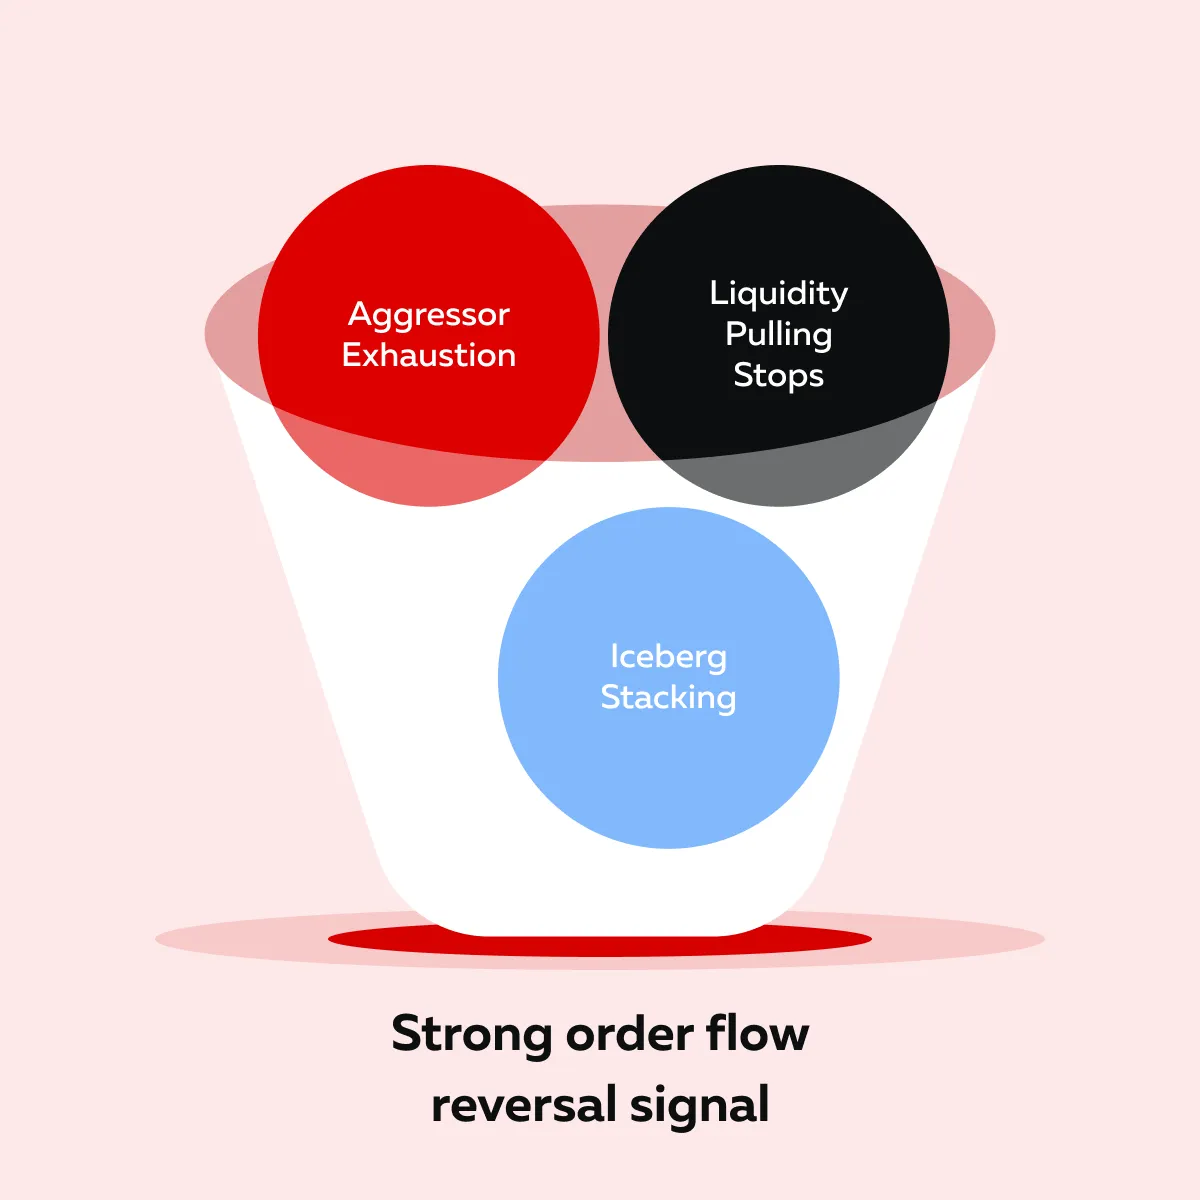
Order Flow Patterns That Precede Big Reversals: From Aggressor Exhaustion to Iceberg Stacking
The market rarely shouts its intentions. But in the order flow, it quietly reveals everything! Have you ever noticed? Yes, most pro traders study order flow to spot market trends! Want to be in their league?
In this article, you will study how to spot reversals before they happen. Not with guesswork, but by reading the market’s own “tells.” You’ll also learn to identify aggressor exhaustion, recognize iceberg stacking patterns, and interpret liquidity shifts. Be aware that they are all powerful clues that smart traders use to stay ahead.
Additionally, you will understand how to use our advanced real-time market analysis tool, Bookmap, to make confident trade entries and avoid traps. So, want to gain knowledge that can give you the edge of timing? Read this article till the end!
What Aggressor Exhaustion Really Looks Like
Aggressor exhaustion is a powerful clue that a trend is running out of steam, even if it doesn’t appear that way at first glance. It happens when the side that is actively pushing the market, such as buyers during a rally or sellers during a drop, starts throwing heavy orders, but the price stops responding.
Let’s understand better through an example:
-
- You’re watching an uptrend.
- Prices are increasing.
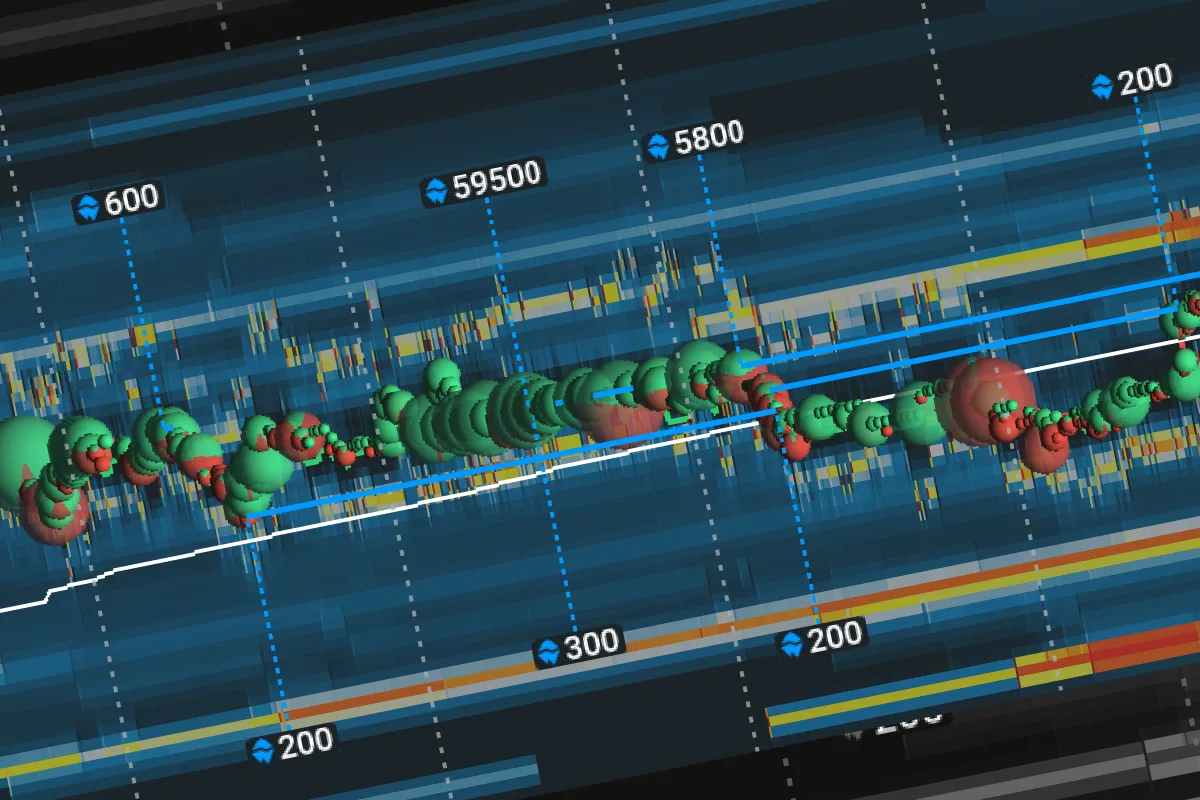
- With our advanced market analysis tool, Bookmap, you suddenly see large green volume dots.
- These dots show that aggressive buyers are hitting the offer.
- That’s usually a sign of strength!
- But, despite all those aggressive orders, the price barely moves.
-
- It keeps hitting a level (say, 4300 in ES futures) but can’t break through.
- It’s like hitting a wall repeatedly!
This is a textbook sign of aggressor exhaustion trading. The aggressors, in this case, buyers, are trying hard, but they’re getting no reward. The order flow is heavy, but there’s no follow-through. Eventually, the market gives up and reverses sharply!
This kind of behavior is one of the most reliable order flow reversal signals. It tells you the effort is there, but the momentum is gone.
The Visibility of Iceberg Stacking Patterns
Sometimes, you might also spot “iceberg stacking patterns” during such stalls. In this case:
- Hidden liquidity repeatedly absorbs those aggressive orders
and
- Such an absorption keeps the price pinned.
This is another layer of confirmation that someone is defending that level. So, do you want to spot aggressor exhaustion? Watch out for these signs:
By recognizing aggressor e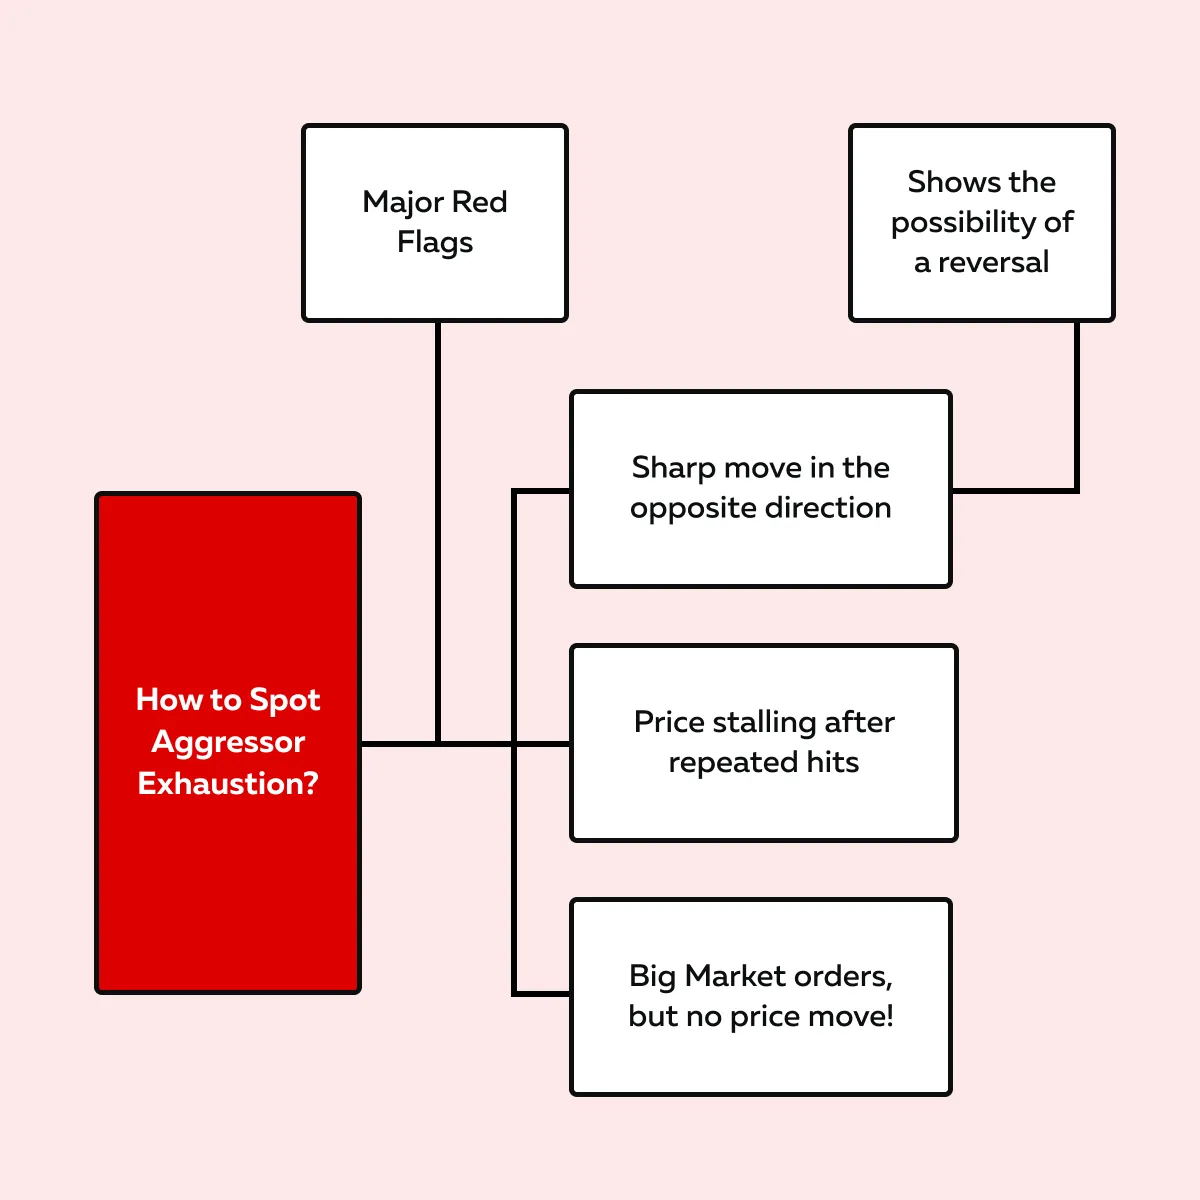 xhaustion, you can step aside before a trap or even ride the reversal when the market flips!
How Iceberg Stacking Signals Big Reversals?
Iceberg orders are like hidden giants in the market! You can’t see them directly on the order book. Why? Because they only show a small portion of their size. However, they quietly absorb a huge amount of market orders at a specific price level.
As a trader, when you notice iceberg stacking patterns, you must realize that smart money is stepping in quietly. And, they usually step in right before a reversal!
Want to spot it? Let’s learn how through the example below:
- A stock, like NVDA, is trying hard to break above $1000.
- You see a series of large, aggressive buy orders coming in.
- On our platform, Bookmap, you can see them as “green volume dots.”
- Now, logically, you’d expect the price to pop through.
- But it doesn’t!
- The price keeps hitting $1000, again and again, but doesn’t move higher.
That’s your clue; something unusual is happening. Even though our advanced market analysis tool, Bookmap’s heatmap, shows no visible liquidity at that level, the price just won’t break! This means a hidden limit order, like an iceberg, is soaking up all that buying pressure.
Gradually, as you keep observing, it becomes clear that the market isn’t strong enough to push past it. And then? The price reverses hard.
This behavior is a classic order flow reversal signal. It tells you that a big player or several big players are likely doing any of the following:
- Defending a position,
- Taking profits, and
- Setting up a short.
Either way, they’re absorbing the flow and stalling the move! When iceberg stacking is spotted during a stall like this, it must give you a high-confidence signal that:
- Momentum is fading
and
- A reversal is right around the corner.
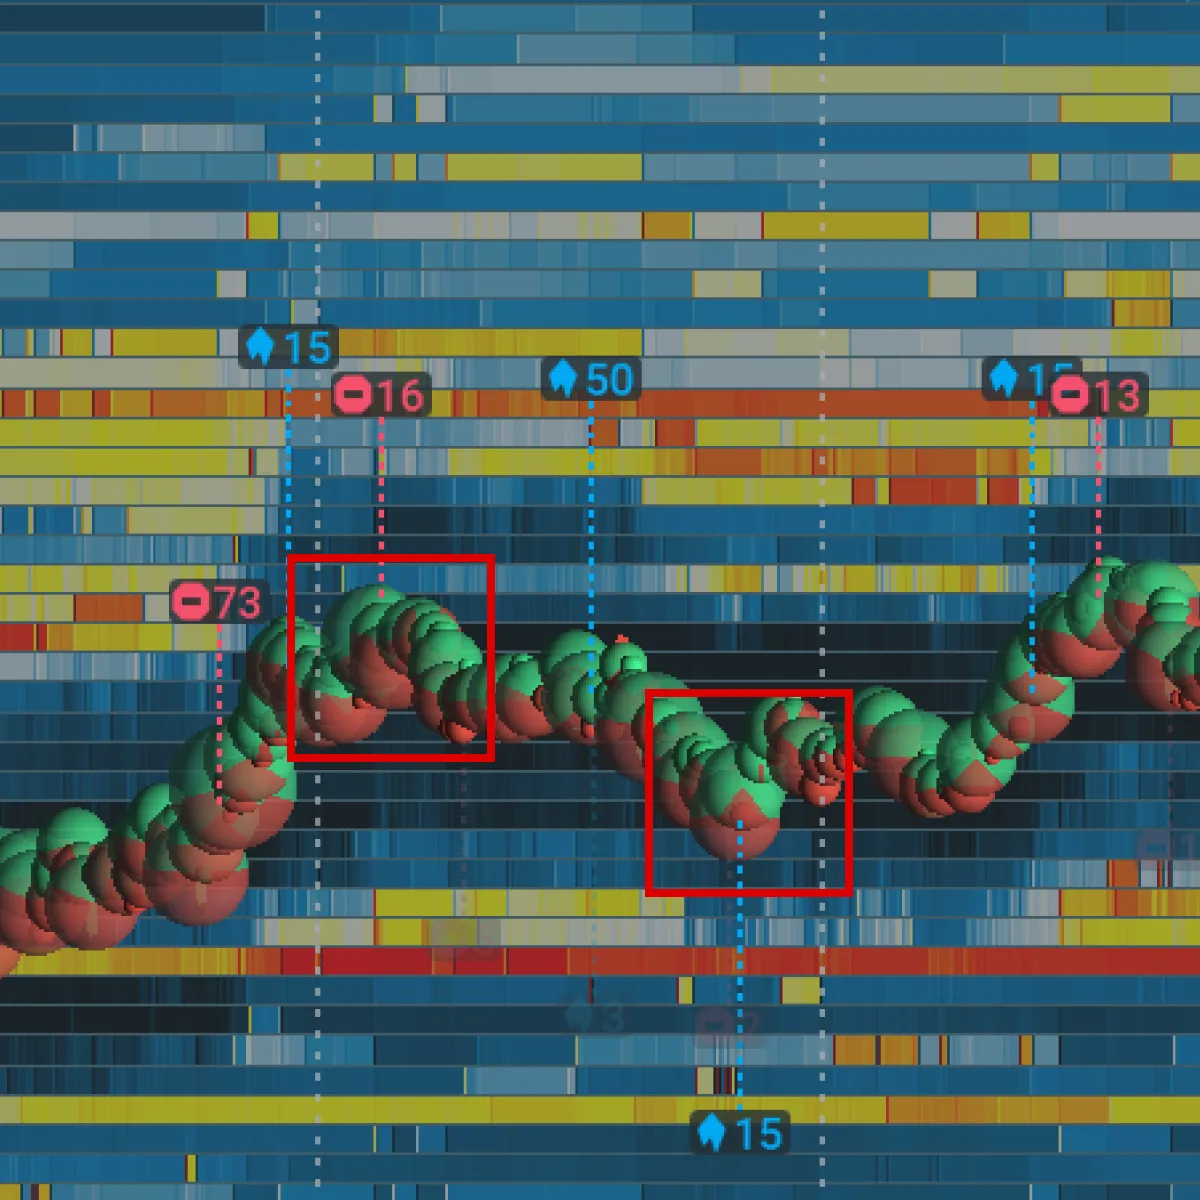
For more clarity, check out the graphic below to learn how you can spot iceberg stacking patterns and predict a reversal:
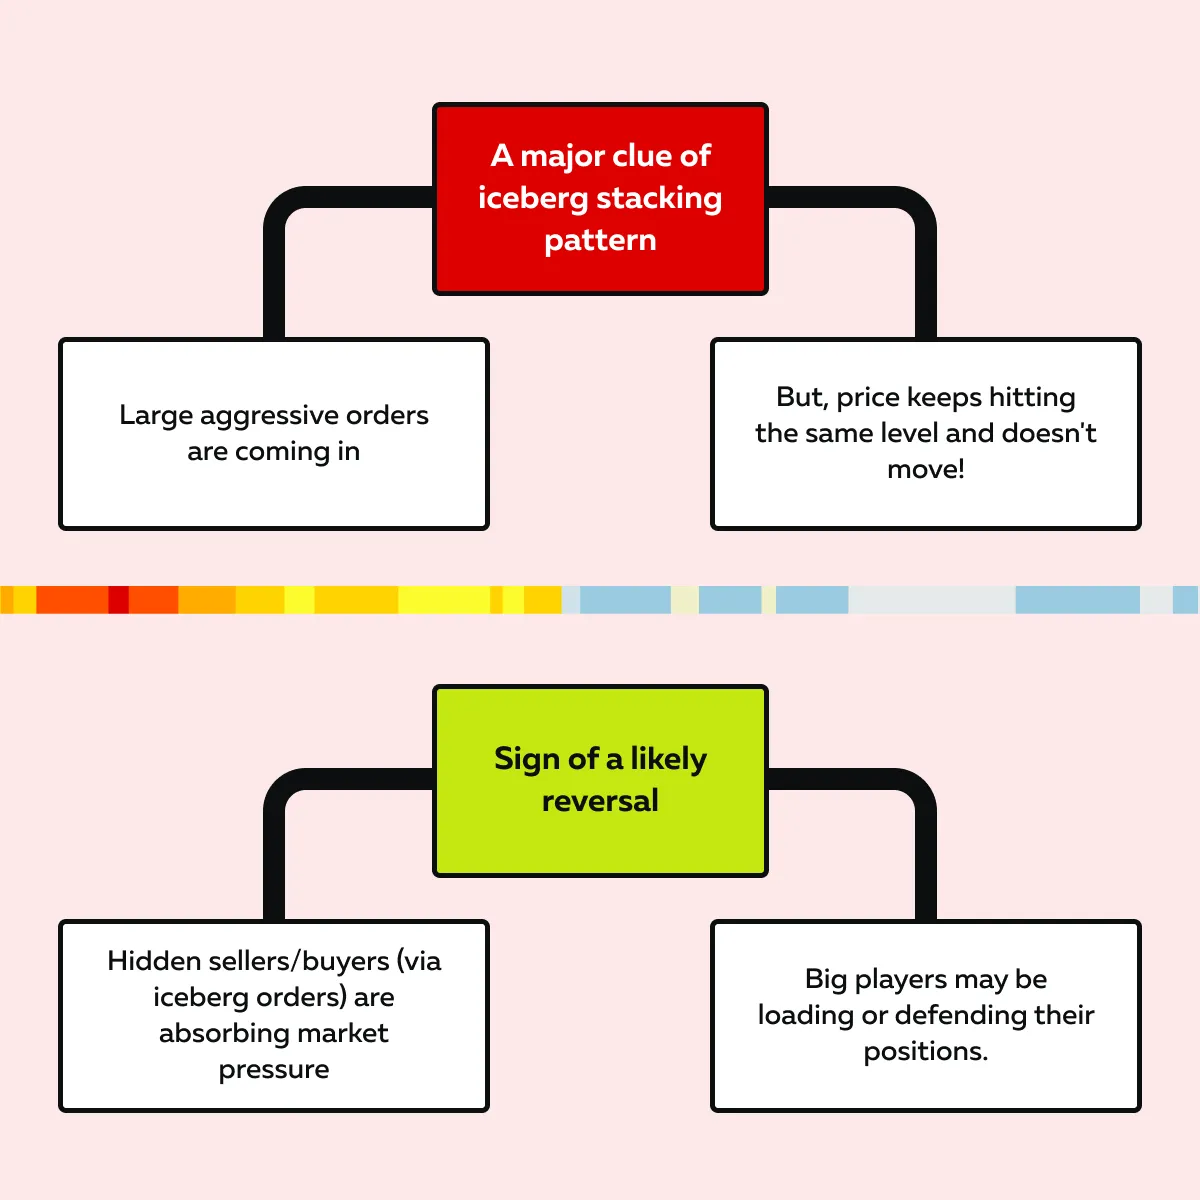
By spotting iceberg stacking patterns, you can see what others can’t! You get to know the real-time intent behind the price action.
Liquidity Clues That a Reversal Is Brewing
Before a price reversal actually happens, the order flow and liquidity behavior often start whispering hints. But you must know where to look! By reading some clues related to “liquidity shifts,” you can predict that:
- The current trend is losing strength
and
- A turning point may be near.
Want to learn about these clues? Study them below:
Clue I: Resting Liquidity Appears Against the Trend
One of the first signs is that resting liquidity, such as large passive orders sitting in the book, starts stacking against the direction of the current move.
For example, you observed the following:
| In a rally | In a sell-off |
|
|
Now, what does the signal mean? It shows that bigger players are preparing to:
- Absorb the flow
and
- Reverse the trend.
It often works hand in hand with iceberg stacking patterns, where those orders are hidden but still actively holding the line. Improve your reversal timing with order flow—compare Bookmap packages today.
Clue II: Heatmap Walls Form Where Price Keeps Failing
Our advanced modern market analysis tool, Bookmap, shows “heatmaps.” Through them, you can visually spot where liquidity is sitting. Let’s learn how to use it through the graphic below:
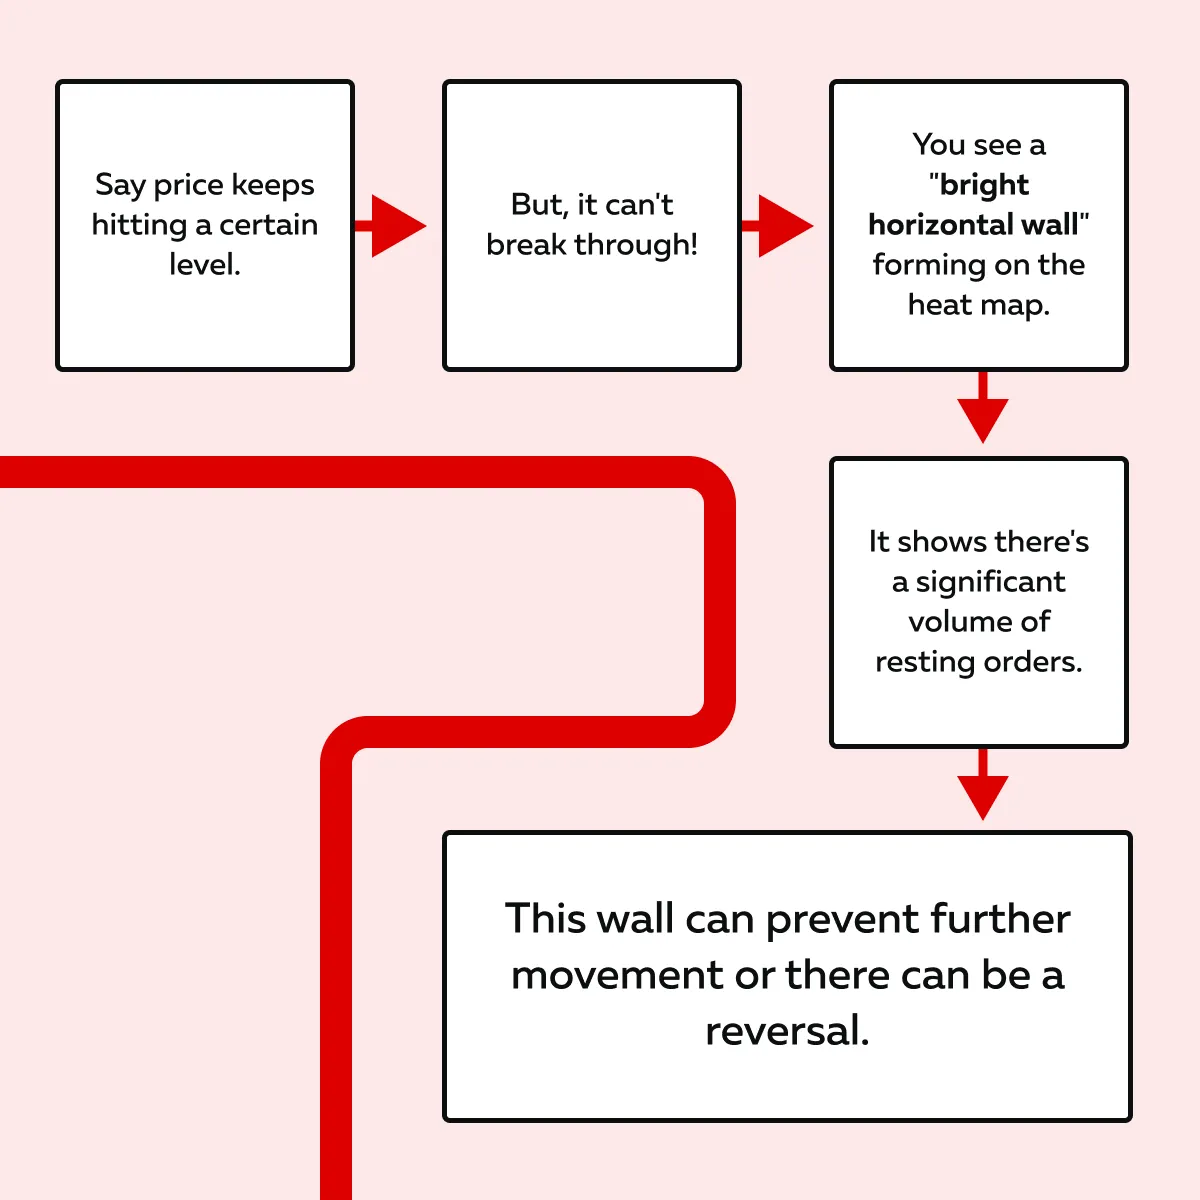
Please note that in this situation, you often also see aggressor exhaustion trading. In it, aggressive orders keep hitting that wall again and again, with no reward. As a result, the price stalls and then fades!
Clue III: Liquidity Pulling Halted
Another major clue is when liquidity stops pulling! Sometimes, in a rally, sellers remove their orders to stay safe. They don’t want their orders to get filled too early. Why? They think the price might go higher, so they get out of the way!
Similarly, in a sharp drop, buyers sometimes pull their bids. They also do not want to catch a falling knife!
Now, when this happens alongside aggressor exhaustion or iceberg stacking, it strengthens the overall order flow reversal signal. It’s often a pre-reversal clue! Check out the graphic below:
For More clarity, let’s study a Real-Life Example:
-
- The crude oil price is climbing steadily.
- However, you notice that at $85.50, a large block of offers appears.
- You find that aggressive buyers are attacking that level (big green dots).
- But, still, the price can’t break it!
- No more offers are being pulled.
- As a result, the rally loses momentum!
Now, what does this tell you? Big players are likely selling into the rally, using strong liquidity walls to cap the price.
Clue IV: Reversals Need Fresh Liquidity
Actual reversals aren’t just about price! Instead, they’re about commitment from larger players. As a trader, you must watch for:
- Liquidity shifting against the move,
- Walls that hold price back, and
- Signs that buyers/ sellers are standing firm.
All of these offer high-quality order flow reversal signals that go beyond what charts alone can tell you. Ready to spot reversals faster? Bookmap’s heatmap and volume tools reveal the flow behind every move.
How to Combine These Signals for Reversal Timing
Did you know? Catching a market reversal is one of the most profitable and most difficult skills in trading. Why tough? You must recognize how multiple signals come together!
Please note that professional traders don’t rely on just aggressor exhaustion or one iceberg stacking pattern. Instead, they look at the sequence of events in the order flow!
Want to become a trading pro? Check out the points below:
One Signal Is Enough! Always Look for Alignment
A single sign isn’t always reliable! But when multiple signals line up? That’s when you have a high-probability order flow reversal signal.
Let’s study how you can combine multiple signals:
| Combination I | Combination II |
| Aggressor exhaustion (lots of aggressive buying or selling with no price progress) + iceberg absorption (hidden orders soaking up the flow)
= This duo is a powerful sign that momentum is dying and a reversal is near. |
Liquidity stacking (resting orders appear in the opposite direction) + failed break (price can’t push through a key level) + absorption.
= This pattern often appears just before major turns. You can interpret it as:
|
Understand the Reversal Sequence
To truly time a reversal, watch for this 3-step sequence in the order flow:
| Sequence | Steps | Explanation |
| I) | Effort |
|
| II) | Stall |
|
| III) | Control Shift |
|
Please note that this pattern plays out again and again across timeframes and instruments. When you combine:
- The effort (aggressive volume)
+
- The stall (absorption or iceberg action)
+
- The shift (new liquidity against the trend)
=
- You’re no longer guessing! Instead, you’re reading the market’s internal mechanics.
Some Practical Tips to Trade It Better
- Tip I: Don’t jump too early!
-
-
- Just because price stalls don’t mean it’ll reverse right away.
-
- Often, the first stall is just a pause.
-
- You must wait for signs of:
- Absorption
- You must wait for signs of:
or
- Liquidity rebuild.
- This lets you confirm that large players are stepping in!
- Tip II: Use replay tools
-
- By using our avant-garde market analysis tool, Bookmap, you can replay past actions.
- You can:
- Study big reversal days (e.g., FOMC events, earnings reactions, or macro news spikes) and
- Watch how the aggressor exhaustion, iceberg stacking, and liquidity behavior lined up before the move.
This method of using aggressor exhaustion trading, iceberg stacking patterns, and liquidity shifts together is what separates reactive traders from strategic ones. Be aware that’s how professionals spot reversals before the crowd catches on!
Conclusion
Reversals aren’t random or magic! They always give out clues before the price actually turns. If you learn to read the order flow, you’ll start seeing signs like aggressor exhaustion, iceberg stacking, and halts on liquidity pulling.
These signs warn you that a change is coming! Also, these signals show when strong buying or selling is losing power and when big players are stepping in to defend a level. By watching these patterns together, you can avoid getting caught in fake moves and time your entries with more confidence.
Want to get better at spotting these setups? Don’t trade blindly into reversals—see real-time liquidity shifts with Bookmap.
FAQ
1. What is aggressor exhaustion?
Aggressor exhaustion happens when one side, like buyers in an uptrend or sellers in a downtrend, keeps placing big market orders to push the price further. But despite all that effort, the price stops moving.
You can interpret this as:
- The push is failing
and
- Momentum is dying!
It’s a sign that the aggressive side is running out of power. When this happens, the market often pauses or even reverses. Why? Because there’s no more energy left to continue the move!
2. How can you spot an iceberg order?
An iceberg order is a large hidden order that doesn’t fully show up in the order book. You can spot it by watching how the price reacts.
- For example, the market keeps hitting the same price.
- Also, there is strong buying or selling pressure.
- But the price doesn’t break through!
- Now, that’s a clue.
Additionally, suppose you also don’t see visible resting orders at that level on our advanced market analysis tool, Bookmap’s heatmap. In that case, it often means a hidden iceberg is absorbing the pressure.
3. Do reversals always show these patterns?
Please note that every reversal will not show these exact signals! However, most strong reversals do leave some kind of trail in the order flow. It could be:
- Aggressor exhaustion,
- Hidden iceberg absorption, and
- Liquidity stacking against the trend.
You don’t need all the signs at once! But when you see more than one together, it increases your confidence that a reversal is forming. That’s why combining signals is better than relying on just one pattern.
4. Can Bookmap help me trade reversals better?
Yes, absolutely! Our advanced real-time market analysis tool, Bookmap, gives you tools to see beyond price charts. Let’s see how:
- Its heatmap shows where liquidity is sitting
and
- Volume dots show aggressive market orders.
By using these features, you can detect icebergs and identify large hidden orders. Also, these features allow you to understand:
- Who’s in control of the market
and
- When that control is starting to shift.
By watching these signals in real-time, you can spot likely reversals earlier and avoid getting caught on the wrong side of the trade.
Sign Up Now