See meme stocks more clearly in real time.
Compare plans to access deeper market visibility for meme stocks.
Stocks
June 26, 2025
SHARE
Why Meme Stocks Are Back—And What Order Flow Says About Staying Out of Trouble

In 2025, meme stocks are back! And, they brought their usual hype and heartbreak. Did you think we moved on from the GME and AMC madness? Think again! Social media is buzzing, and short interest is rising. Also, retail traders are trying hard to make quick profits from meme stocks.
Feeling motivated? But here’s the catch! Not all spikes end in gains. Many ends in traps. Want to win most of the time? In this article, we will understand why meme stocks 2025 are moving, how these rallies form, and most importantly, how to avoid meme stock traps (using our powerful real-time market analysis tool, Bookmap).
You will also learn how to track order flow, spot liquidity shifts, and recognize when a move is losing steam. Read this article till the end to perform better in the next wave of meme market mania.
Why Meme Stocks Are Surging Again in 2025
In 2025, meme stocks like GME, AMC, and BlackBerry (BB) made headlines again. These stocks have gained fresh attention (particularly in the second quarter of the year).
So, what’s causing this sudden surge?
- One big reason is the return of Roaring Kitty (a well-known figure in the meme stock world). His recent posts on social media have fired up online communities.
- At the same time, there’s new talk about high short interest. This means a lot of traders are betting these stocks will fall.
This mix of hype and tension has brought trading meme stocks back into the spotlight.
Another major factor? – The market is in a “risk-on” mood. Nowadays, investors are more willing to take chances as the overall economy feels calm and stable. During times like these, meme stocks with low float (fewer shares available to trade) can shoot up quickly when retail traders pile in.
But here’s the catch!
Many of these price spikes have nothing to do with the company’s actual performance. The stock might be rising, but the business behind it hasn’t changed. Let’s see what usually happens in such hype-based trading:
So, if you’re getting involved in meme stocks in 2025, be cautious. It’s very simple to get caught up in the hype. If you’re not careful, you might fall into one of the many meme stock traps (buying high, only to watch the stock crash shortly after). Thus, you should pay close attention to order flow in names like GME and AMC, as it can show you where the buying and selling pressure is moving.
Know when the hype is fading—watch liquidity vanish in real time using Bookmap’s heatmap.
The Anatomy of a Meme Stock Trap
The meme stock craze is back, but so are the risks! Many traders jumping into meme stocks in 2025 are falling into the same trap. But do you know this trap follows a predictable pattern?
Let’s understand it:
Step 1: Initial Hype + Spike
It all starts with a sudden surge in price. This often happens because of social media buzz, like:
- Post from Roaring Kitty
or
- Hype on Reddit.
Mostly, stocks like GME and AMC with low float and high short interest are perfect targets. Usually, these stocks move fast with just a bit of buying pressure.
Next, traders see the price shooting up and jump in quickly. They try to:
- Chase the “green candles” (fast price gains)
and
- Rely on “DD” (due diligence) from forums.
This is when trading meme stocks feels exciting, and FOMO (fear of missing out) kicks in.
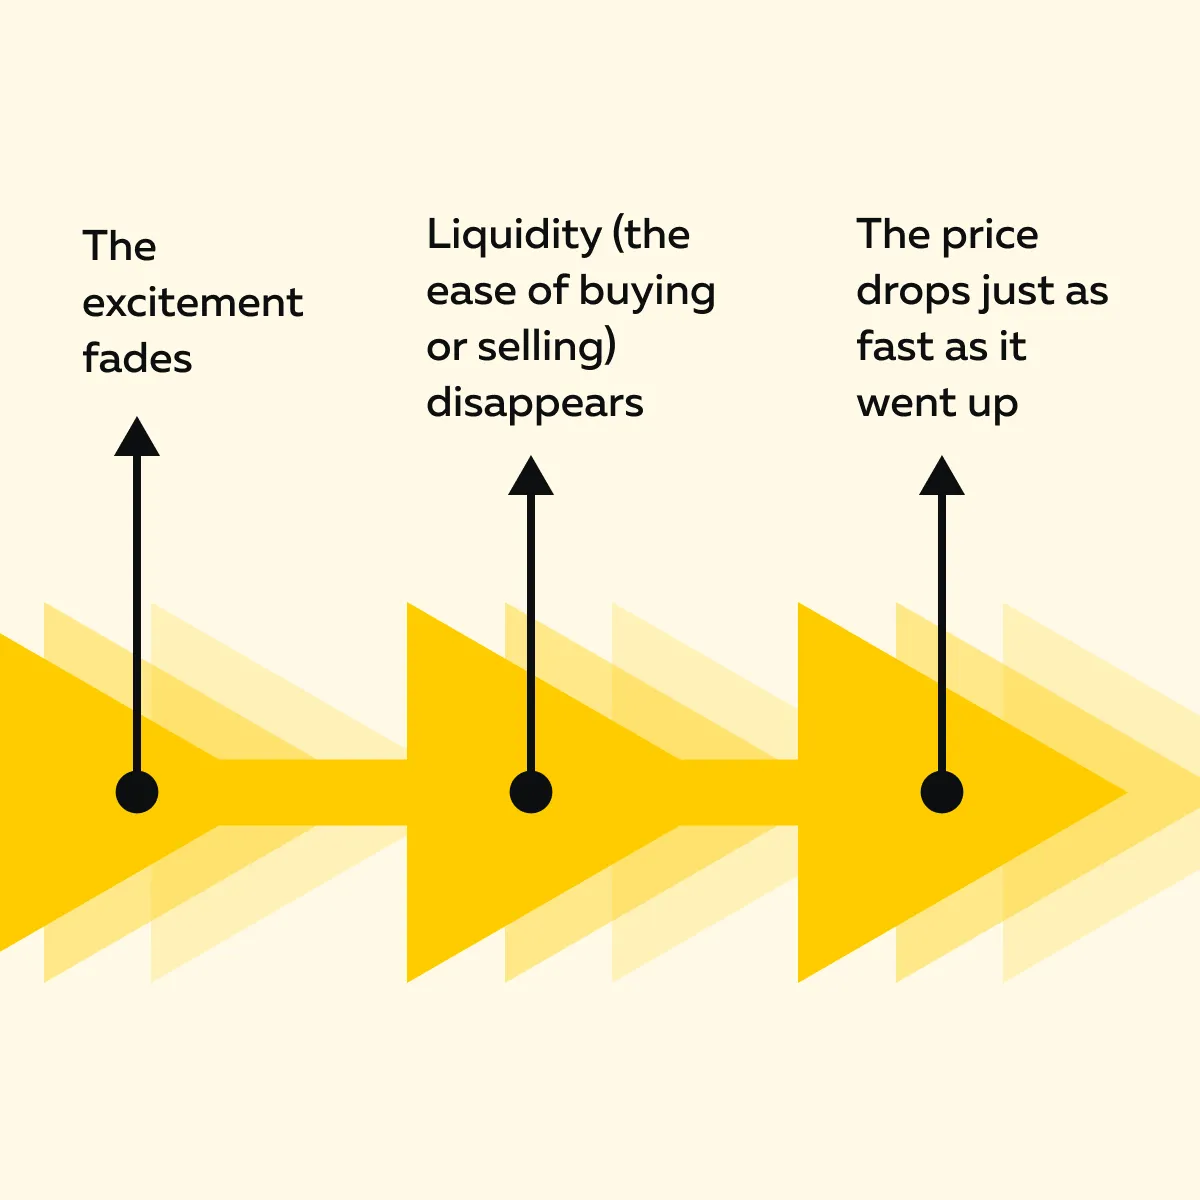
Step 2: Liquidity Disappears
After the initial run-up, things start to shift:
- The strong buying slows down
and
- Suddenly, there aren’t many new buyers.
Sellers aren’t flooding in either, but the important part is that the bid side of the order book (where buyers sit) gets weak. Now, there is no one left to keep the price up! This is where you need to watch the order flow closely. Remember that if the bid depth collapses, the price fall is not far.
Step 3: Aggressive Selling Into Air
Please note that without strong support from buyers, even a small amount of selling can crash the price. In response, the traders who bought in late started to panic. Some try to sell, but with so few buyers, they push the price down even more.
Let’s understand how this creates a chain reaction:
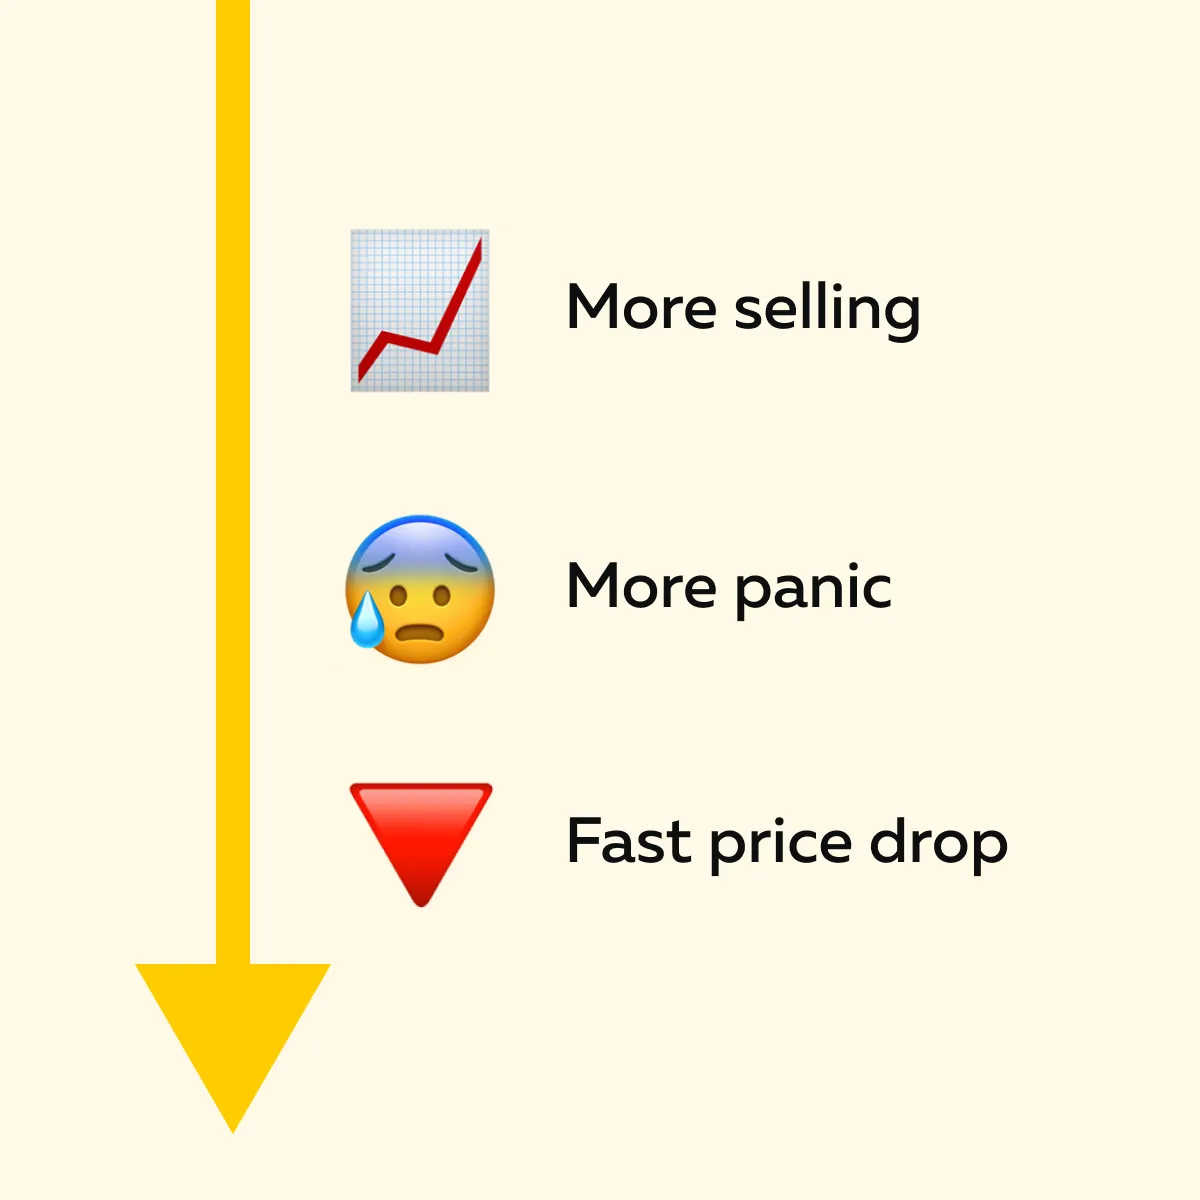
This is the classic meme stock trap. The move is often disconnected from the company’s real value, as it is all about:
- Momentum,
- Emotions, and
- Thin liquidity.
Want to avoid meme stock traps? Please don’t just follow the crowd! Instead, watch for signs of:
- Fading momentum,
- Drying liquidity, and
- Weak order flow.
Particularly, watch for these signs in stocks like GME and AMC that have seen these patterns before.
How Bookmap Helps You Avoid Meme Stock Meltdowns
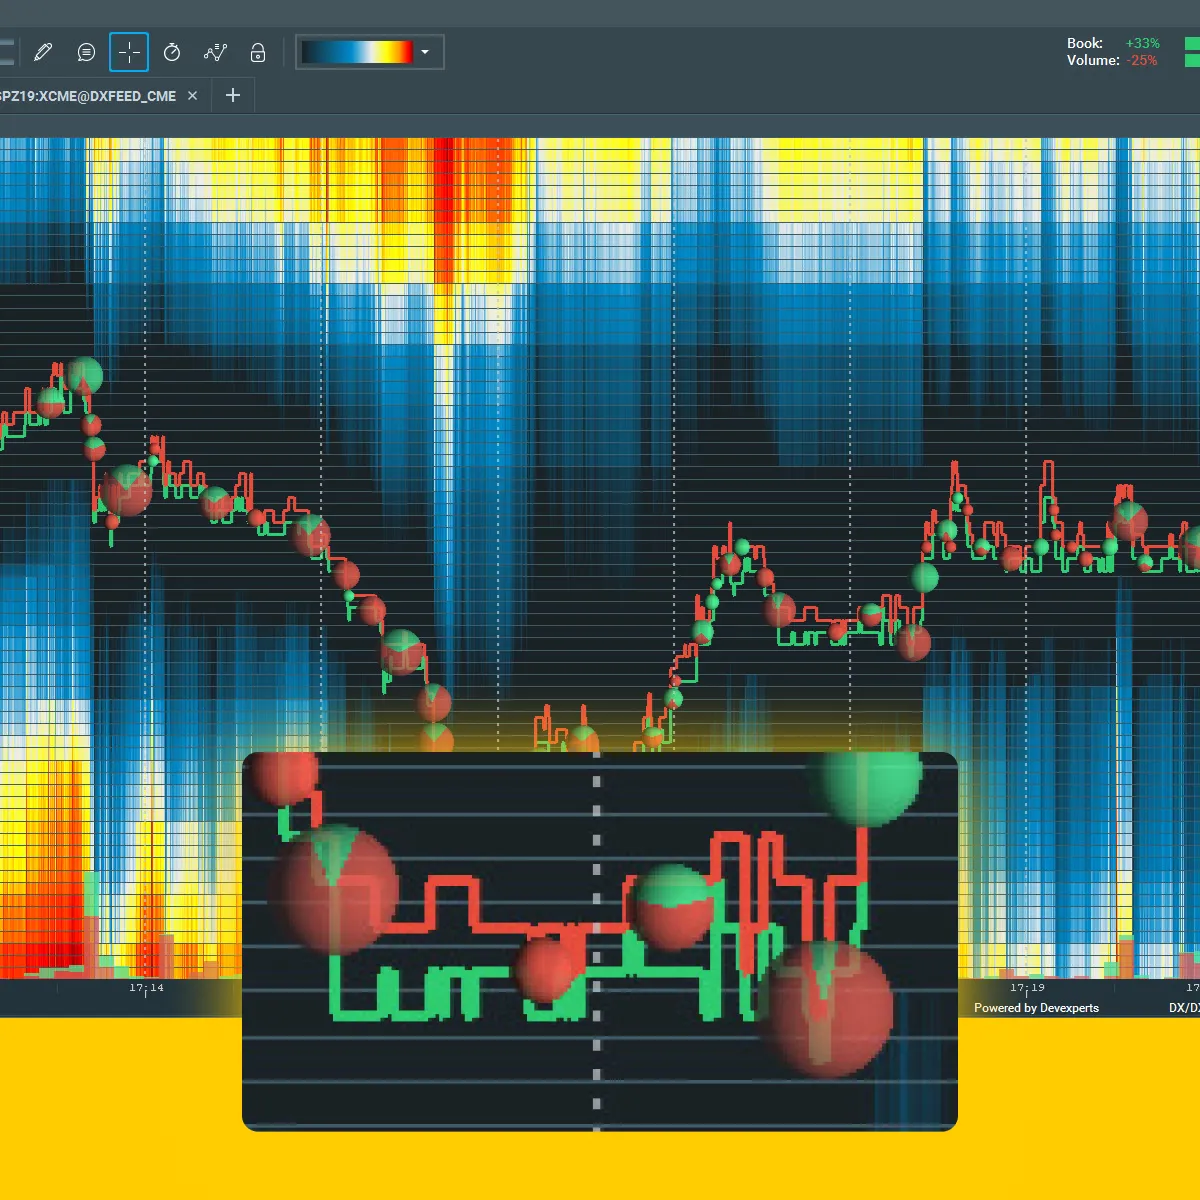
When meme stocks like GME and AMC are fluctuating rapidly, it can be hard to tell if the rally is real or if it’s about to crash. That’s where our advanced real-time market analysis tool, Bookmap, comes into play.
Our advanced market analysis tool, Bookmap, shows more than just price! It shows you what’s happening behind the scenes with liquidity and volume in real-time. Remember that these are key clues when you’re trading meme stocks (especially during wild spikes).
For more clarity, let’s understand how it works:
| The Heatmap | Volume Dots |
|
|
Additionally, when meme stocks spike, you must pay attention to these two unique cases:
- On Bookmap, you notice that liquidity below the price disappears:
-
- Now, this is a red flag.
- It means buyers may be backing away.
- The stock might not have strong support anymore (a common setup in meme stock traps).
- Our Bookmap shows a lot of aggressive buying, but the price doesn’t go higher:
-
- That’s another warning.
- This means someone could be selling a large position quietly.
- They are using the hype to unload shares.
In these cases, you must not chase momentum or listen to social media hype. Instead, you should use our market analysis tool, Bookmap, to see the order flow clearly. Through it, you can understand if:
- The move is strong and real
or
- It is likely to collapse (as often happens with meme stocks in 2025).
By reading the heatmap and volume flow, you’ll be better prepared to avoid a meltdown.
Common Signals That the Meme Stock Move Is Over
While trading meme stocks, your goal should not be to predict the top perfectly! Instead, you must spot the signs that the hype is slowing down. If you’re trading names like GME, AMC, or other meme stocks in 2025, you must know when the move is fading. This knowledge can save you from big losses!
Below are some simple and real-time signs that the rally is about to end:
1. Liquidity Starts Pulling Away
For the unaware, liquidity means how easily a stock can be bought or sold without significantly affecting the price. Please note that strong support usually shows up as “big bid walls.” These walls are made up of large orders sitting below the current price. These are buyers ready to buy if the stock dips!
But when these bid walls start to disappear, it’s a warning. This means that large players or market makers are no longer willing to support the price. This is often the first sign that the rally is losing strength.
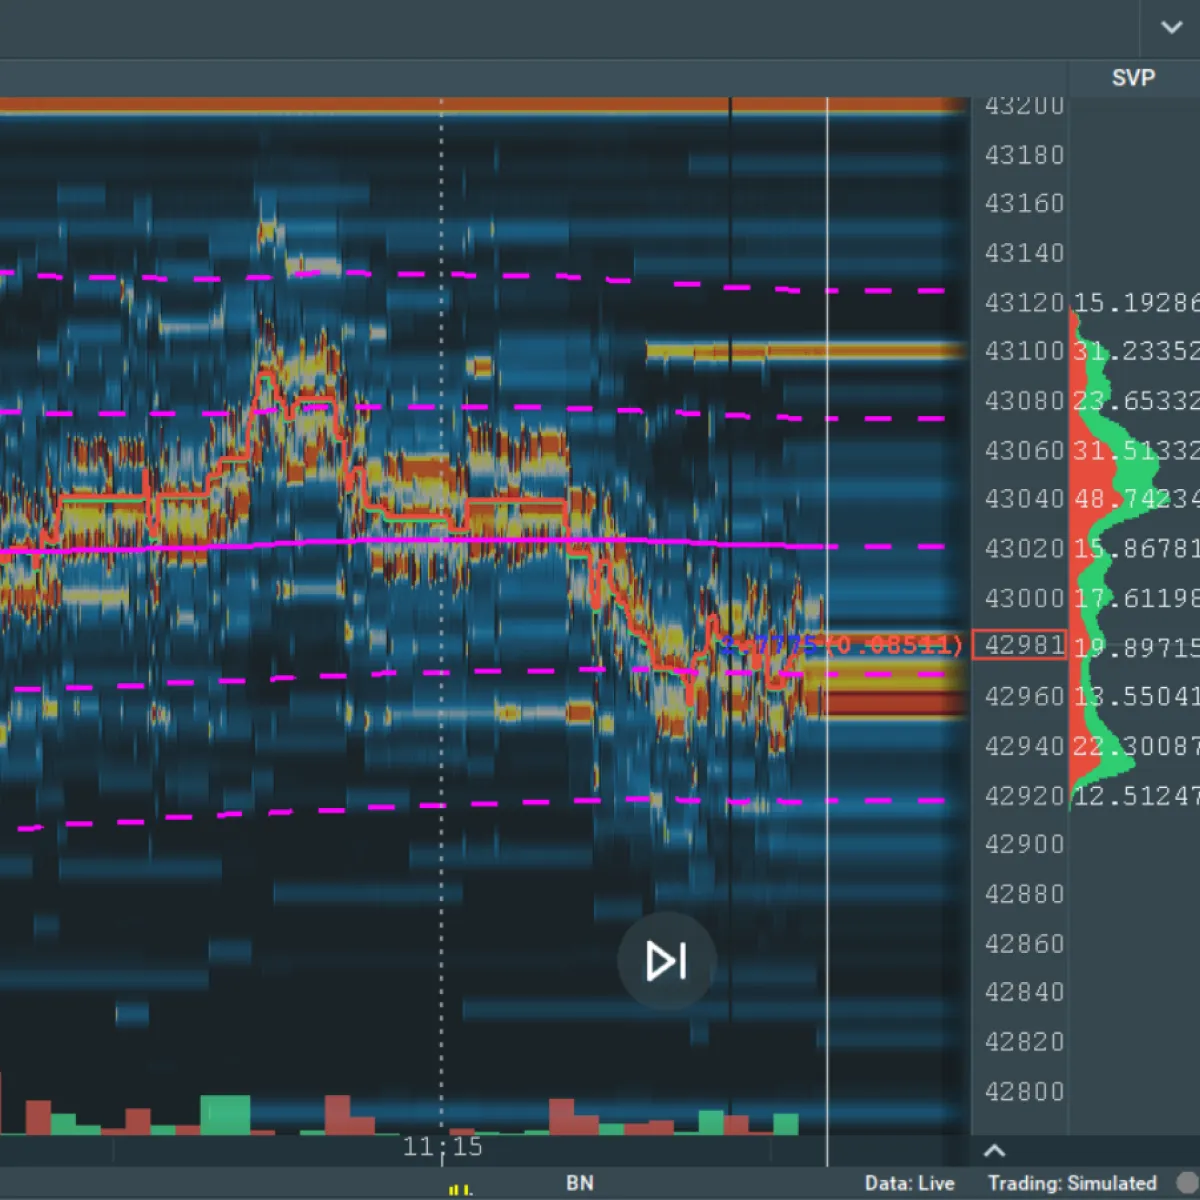
How Does This Appear on our Bookmap?
You’ll see the heatmap under the price go from bright orange/ red to pale yellow or even disappear. That’s a clear sign that the:
- Liquidity is drying up
and
- Stock is vulnerable to a drop.
2. Volume Surges, But Price Stalls!
Another red flag is when buy volume increases, but the price doesn’t go any higher. This usually means absorption is happening. Smart traders or institutions are selling into the buying frenzy. They’re using the hype to exit their positions quietly.
Also, it shows that even though retail traders are still buying, the big sellers are stronger. Once those buyers are gone, there’s nothing left to support the price. And, it often drops fast!
This is a classic sign of a meme stock trap:
- On the face of it, the momentum looks strong
but
- Under the surface, the stock is being offloaded.
Get ahead of retail traps—learn how Bookmap helps you navigate volatility with confidence.
3. Repeated Failures at the Same Level
For example, a stock like AMC keeps hitting $6.00 but can’t break above it (even with decent volume). If it tries multiple times and fails each time, that’s a clue that momentum is fading!
But why does this happen? Often, sellers place limit orders just above the highs to trap breakout traders. Once those traders are stuck, the price falls quickly.
If you see this happening more than once, it’s a strong sign that the rally is about to end.
4. No New Liquidity Appears to Support Higher Prices
In a strong uptrend, support moves up as the price climbs. This happens because the new buyers step in higher and higher (due to increasing confidence).
But if the price goes up and there’s no new liquidity forming below it, that’s a problem! It means:
- The rally isn’t attracting fresh support
and
- The move may not last.
On our avant-garde market analysis tool, Bookmap, you will notice the bid side stays flat or weak (even as the stock pushes higher). That’s a signal that the move may be unsustainable.
Bonus Tip: VWAP Breakdown Signals Loss of Control
One of the most useful tools when trading meme stocks like GME or AMC is the VWAP (Volume-Weighted Average Price). It’s a line on the chart that shows the average price a stock has traded at. This line is based on both price and volume.
Why is it important? Because VWAP is a key reference point for both retail traders and big institutions. During a meme stock rally, the price often stays above VWAP. When this happens, it shows that:
- Buyers are in control
and
- They are willing to pay above the average just to stay in the trade.
What Should You Look for?
If the stock has been trading above VWAP for 30 minutes or more, that’s usually a good sign for bulls. It means buyers are pushing the price higher and keeping it there.
But if the price drops below VWAP and stays there (particularly without strong buying interest to hold it up), that’s a clear warning sign!
Why? Because it suggests:
- That momentum is gone
and
- Traders have started to lose confidence.
Furthermore, be aware that many day traders and algorithms use VWAP as a trigger. When the price drops below it, they often exit.
How to Visualize This on Bookmap?
On our advanced market analysis tool, Bookmap, you can see this in action with real-time data. Let’s learn how through the two cases below:
| Case I | Case II |
|
|
This kind of behavior often marks the end of a move. It’s one of the ways meme stock traps get triggered.
Conclusion
Meme stocks are making a comeback in 2025! But that doesn’t mean you have to fall for the same traps. Remember that names like GME and AMC can fluctuate rapidly, but those moves can fade just as quickly.
So, want to trade smarter this time? You need more than social media hype. You need real data. Through our modern real-time market analysis tool, Bookmap, you get a clear view of what’s happening beneath the surface. You can track liquidity, see where big buyers or sellers are sitting, and watch how volume flows in real-time. This knowledge lets you spot warning signs before a move collapses.
Moreover, instead of blindly chasing momentum, you can use our advanced market analysis tool, Bookmap, to confirm whether a meme stock move is strong or weak. Want to avoid getting caught when the crowd runs for the exit? Don’t chase meme stock moves blindly—see the real-time order flow with Bookmap.
FAQ
1. Why are meme stocks moving again in 2025?
Meme stocks like GME and AMC are getting attention again because retail traders nowadays are looking for high-risk and high-reward plays. Additionally:
- Social media influencers, like Roaring Kitty, are posting again, which creates hype.
- Due to high short interest, you get strong price spikes in these meme stocks, which makes them attractive.
These setups attract day traders and speculators who hope to profit quickly. These factors are bringing meme stocks back into the spotlight in 2025.
2. What’s the biggest risk with meme stocks?
The biggest risk is getting caught in a meme stock trap. In this trap:
- Prices shoot up due to hype.
- However, often there’s no real support underneath.
- Next, the early buyers exit or stop buying.
- Due to this, liquidity dries up and the price crashes just as fast.
Now, if you, as a trader, are late to the trade, you could end up holding the stock as it collapses. This will lead to losing money before you even get a chance to react.
3. How can I spot a meme stock reversal in real-time?
To catch a reversal early, you can watch for these signs on our advanced market analysis tool, Bookmap:
- Disappearing liquidity below the price,
- Heavy volume with no follow-through, and
- Price dropping below VWAP without support.
These signals mean buyers are stepping back. If no new demand shows up, the move could be over. By paying attention to these signs, you can exit before a sharp drop traps you in a losing trade.
4. Are meme stocks good trades?
Meme stocks can be profitable, but they’re very risky! They fluctuate strongly and often ignore fundamentals. The best way to trade them is with:
- Small position sizes (never risk more than you can afford to lose)
and
- Use our real-time market analysis tools, Bookmap, to confirm if the move has real strength.
Also, don’t rely on social media hype alone. Trade with discipline, make a clear plan, and know your exit points.
Sign Up Now