See market analysis tool more clearly in real time.
Compare plans to access deeper market visibility for market analysis tool.
Education
June 26, 2025
SHARE
Tech Breakouts or Bull Traps? What Order Flow Says About the Summer Rotation

Not every green candle is your friend. Some are just bait! Particularly during the summer, what looks like a clean breakout can turn into a trap before you even blink.
After a monster rally in AI and mega caps, signs are emerging that the tide may be turning. Additionally, institutions are quietly rotating into safer sectors. The result? You retail traders might just be chasing shadows! That’s why relying solely on price action isn’t sufficient anymore in 2025. You need to see what’s really happening under the surface, where volume is going, where liquidity is building, and who’s actually stepping in to buy.
But how? Our avant-garde market analysis tool, Bookmap, can let you spot those subtle shifts. So, want to avoid getting caught in a tech stock breakout trap or a bull trap during sector rotation. Read this article till the end to learn how to trade smarter by watching the flow, not just the show!
Why Tech Stocks Are Facing a Summer Reality Check?
In the first part of the year, tech stocks (particularly those connected to AI) surged. Companies like NVIDIA (NVDA) led the rally. But now, in the summer, things are changing!
Let’s see what’s going on:
| Tech stocks are falling | Slowing economy | Major strategic changes by big money |
or
|
|
|
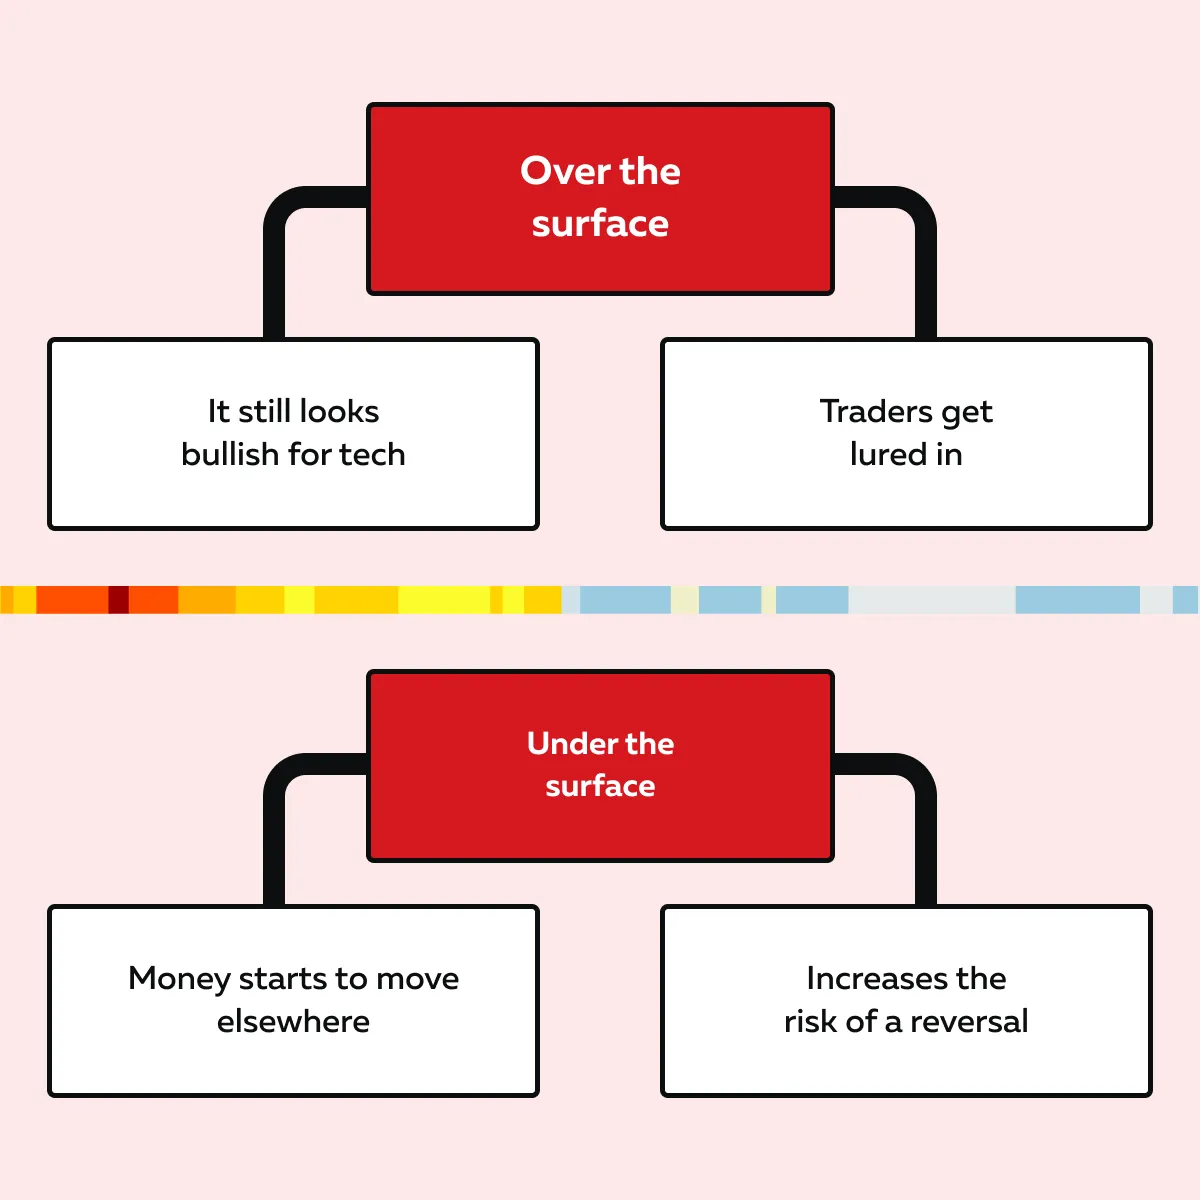
Currently, these changes create a risky environment for tech traders. Because of this, a stock might look strong on the chart. But if liquidity (the number of shares available to buy or sell) and volume (the number of shares being traded) are falling, there’s less real support behind the move.
This is where a tech stock breakout trap can happen. A breakout above the resistance might lure in buyers. However, if large investors don’t keep buying, the move can fail quickly! Check out the graphic below for more clarity:
Track where real support is building (or disappearing)—Bookmap helps you avoid summer bull traps.
How does Sector Rotation look in Futures and Order Flow?
When big investors shift from one group of stocks to another, it shows up in:
- Futures markets
and
- Order flow.
By watching these signs, you can easily spot real strength or a bull trap. Let’s understand in detail:
Watch for Shifts in Volume and Liquidity Support
When you trade Nasdaq futures (NQ), the price might go up, but that doesn’t always mean buyers are strong. You need to look deeper, specifically at liquidity and volume.
These are two events you must watch:
| The Real Support | The Bull Trap |
|
and
|
Let’s understand better through an example:
-
- NQ breaks above a previous high.
- It looks like a breakout.
- But when you check on our advanced market analysis tool, Bookmap, no new bids are showing up under the price to support it.
- Instead, you start seeing large sell orders (offers) just above the current level.
- That tells you buyers might be walking into an order flow bull trap.
- Here, it is possible that:
- The breakout could fail
and
- Price could fall fast.
This is how summer sector rotation shows up in futures. Check out the graphic below to gain more clarity:
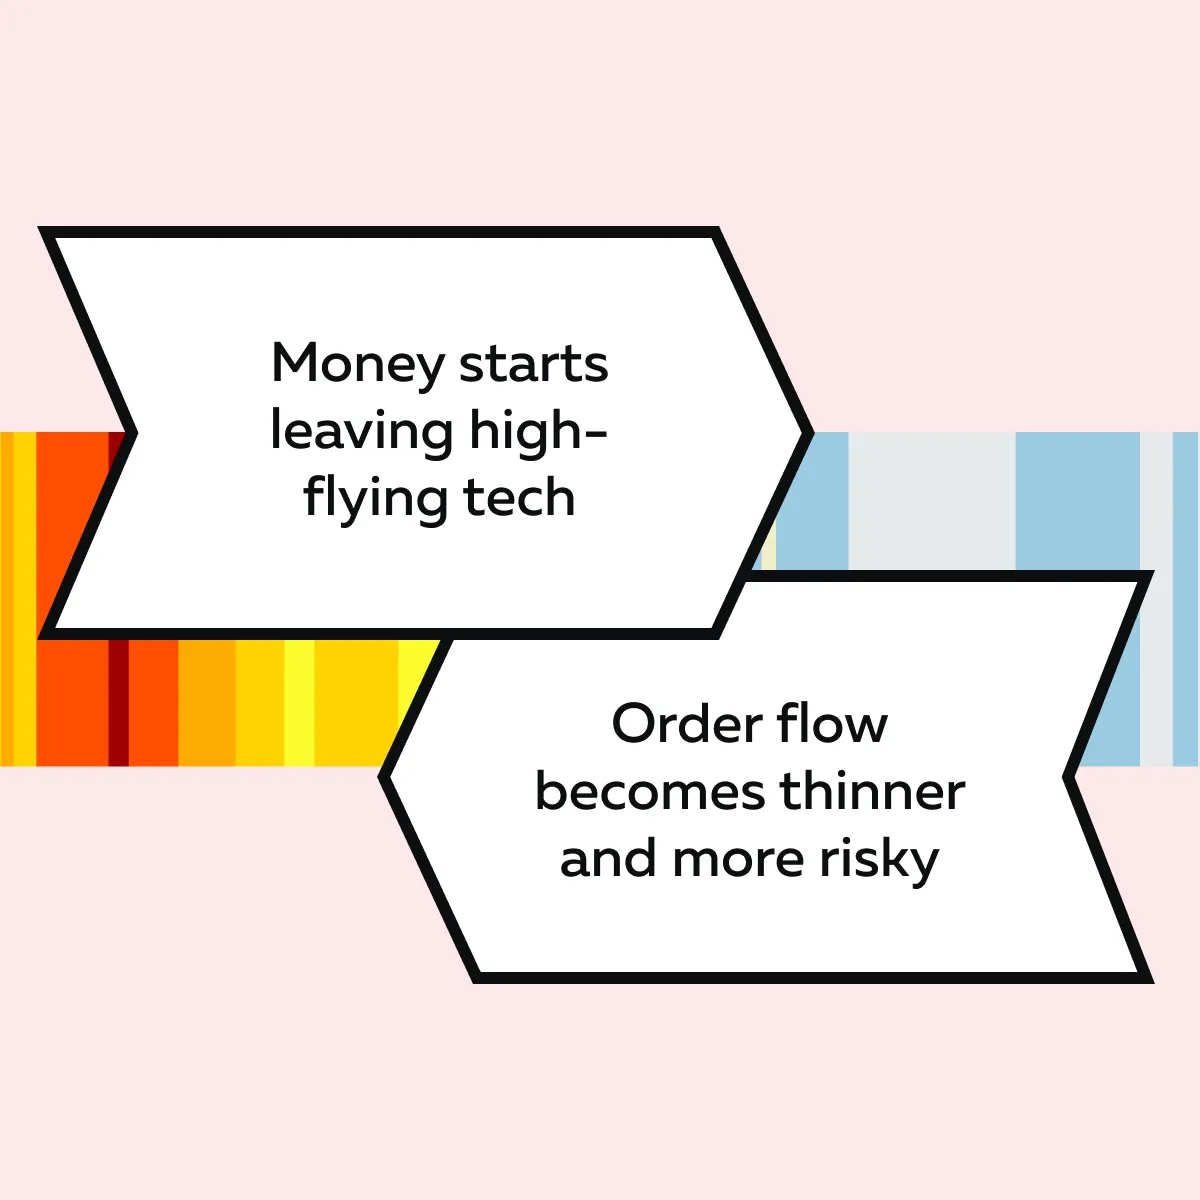
By watching these details, you, as a trader, can avoid false breakouts.
Rotation Shows Up in Divergences
You can often spot sector rotation by comparing the order flow in different futures markets, like:
- Nasdaq (NQ)
and
- S&P 500 (ES).
These two don’t always move the same way! Observing the differences between them can give valuable clues. Let’s see how it works:
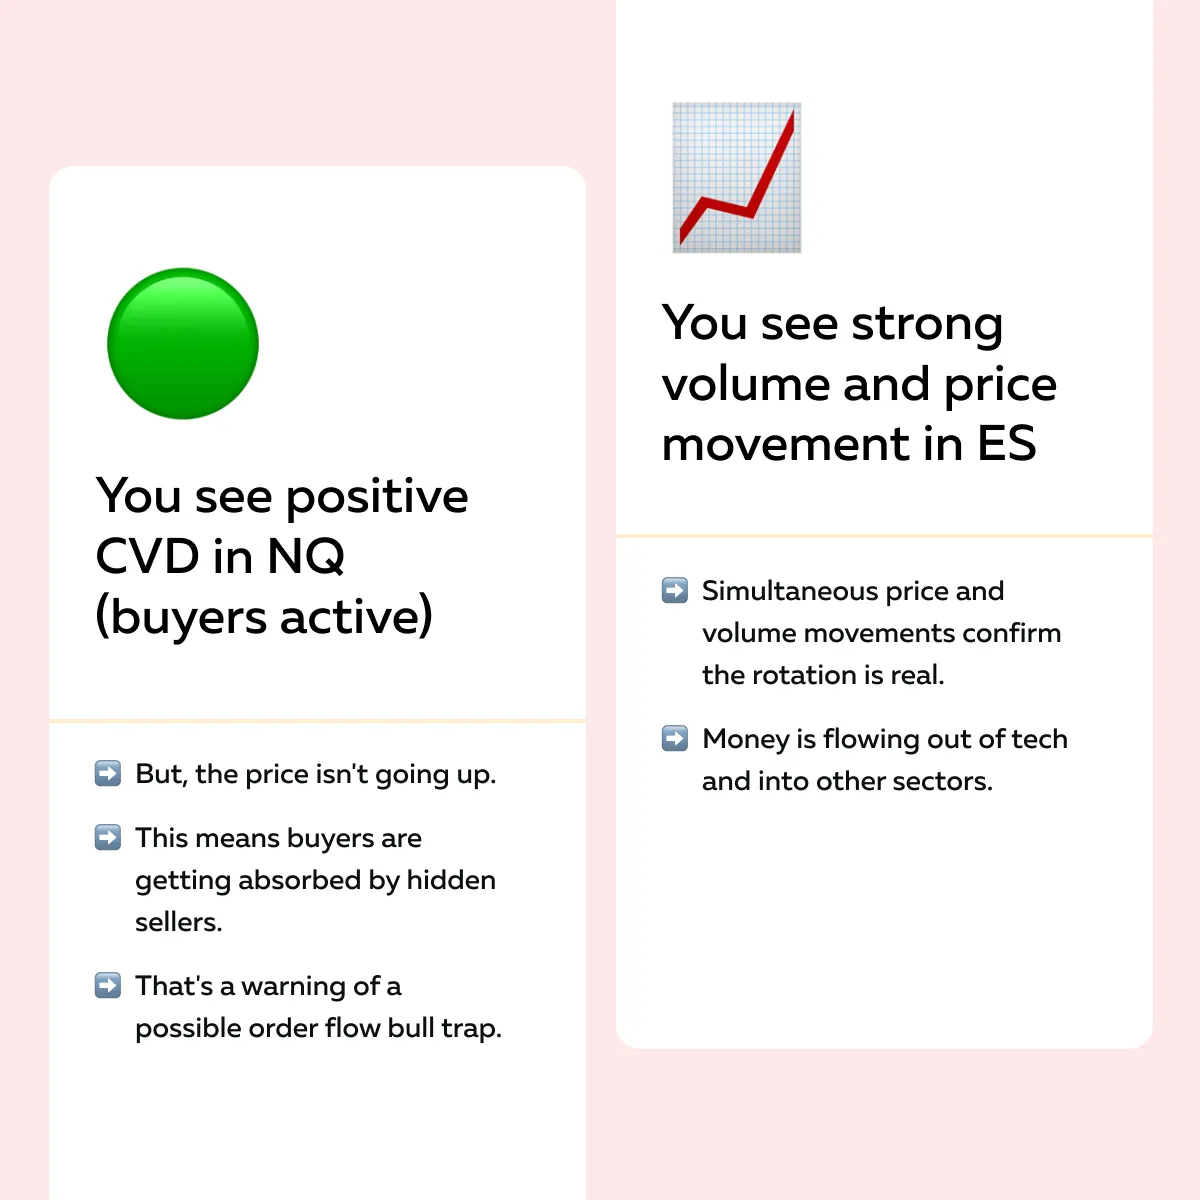
- Say ES futures, which include sectors like energy, healthcare, and industrials, are showing strong bid support.
- There are lots of buyers lined up below the price.
- Also, there is a steady buying volume.
- That’s a sign of strength in those sectors.
- Now, NQ futures (focused on tech) are going up.
- However, they are not showing strong volume or follow-through.
- This means buyers might be struggling.
- That’s a possible signal that:
- Investors are shifting away from tech
and
- Moving into other areas.
- This is one way that summer sector rotation appears in futures.
Want to see this more clearly? You can start using the following advanced features of our market analysis tool, Bookmap:
| A) Volume Delta | B) Cumulative Volume Delta (CVD) |
|
|
Now, let’s see how you can use these features practically:
Spot tech rotation in progress—see how futures flow reveals sector shifts.
Mega Caps vs. Broader Index Behavior
Sometimes the overall index, like the Nasdaq (NQ), looks calm or flat. But that doesn’t mean everything is alright beneath the surface! As a trader, you must look at what’s happening inside the index, particularly with the mega-cap stocks like:
- NVIDIA (NVDA)
or
- Tesla (TSLA).
These big names often drive the index, so their behavior matters. Let’s check out some crucial signals you should watch for:
| Signals | Explanation |
| Aggressive Selling in Mega Caps While the Index Stalls. |
|
| Failed Breakouts in Leaders Like NVDA and TSLA. |
|
| Thin Order Books Above Price. |
|
| Liquidity Pulls at the Highs. |
and
|
These signals, especially when they appear in mega caps, lead to rapid declines. Also, they trigger a wider move in the index later!
Bull Trap Red Flags You Can Spot With Bookmap
Bookmap is our real-time, advanced market analysis tool. Using it, you can see:
- Real-time order flow
and
If you know what to look for, it can help you spot a bull trap! Our advanced market analysis tool, Bookmap, helps you easily identify the setup where the price seems like it’s going to break out but then quickly reverses and traps late buyers.
To make a precise identification, below are three signs you should watch for:
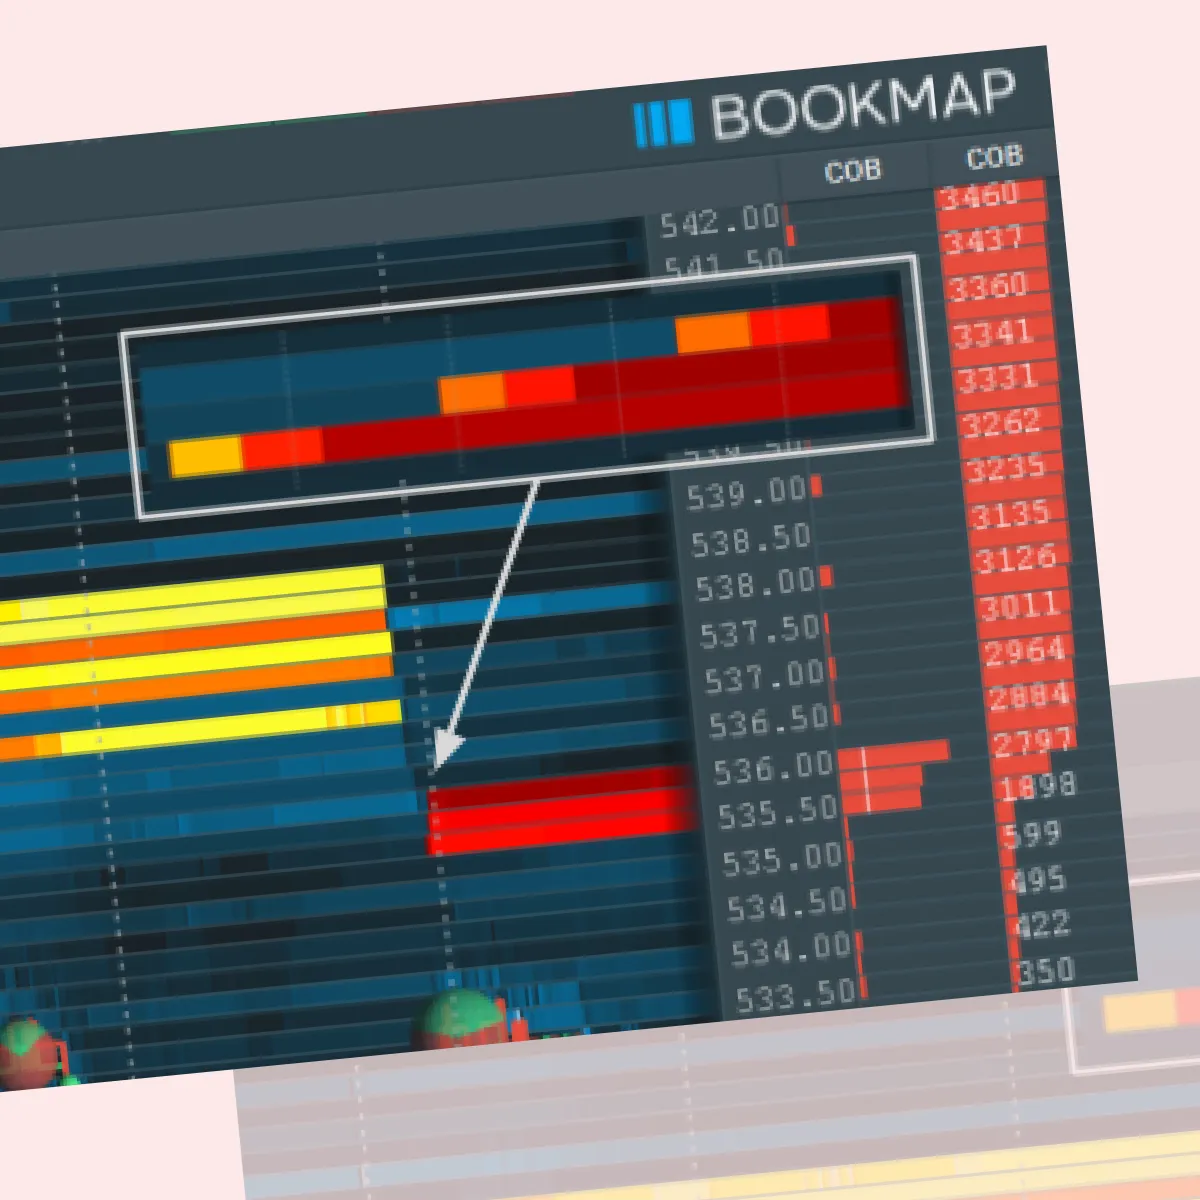
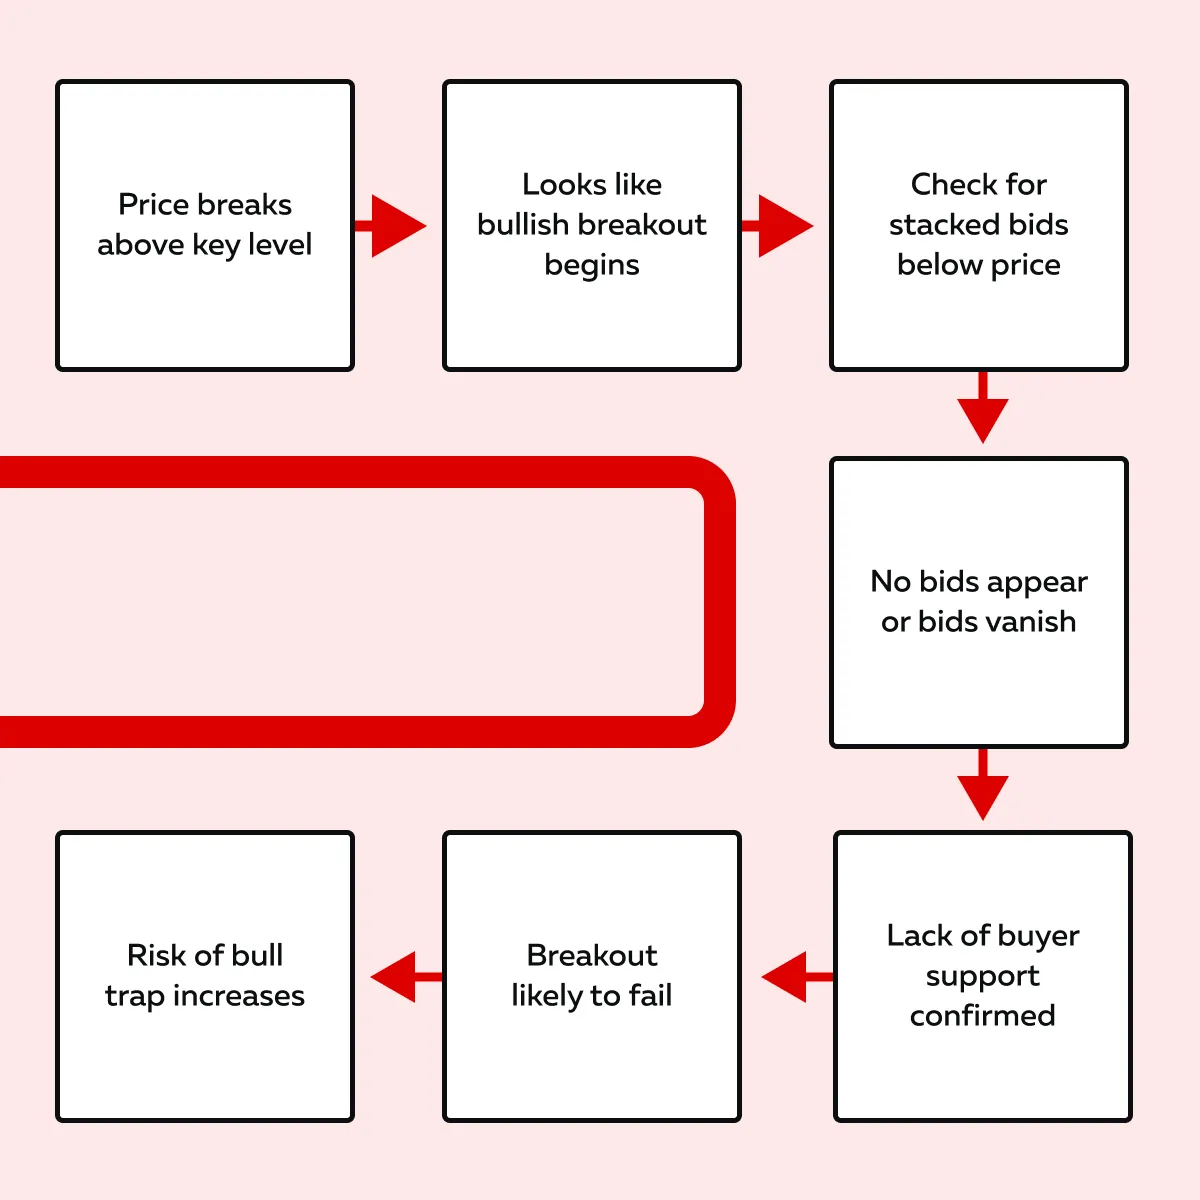
1. Price Breaks Above Resistance, But Liquidity Doesn’t Follow
When the price breaks above a key level (like a recent high), that might look bullish. But for a real breakout, you want to see new bids stack up underneath the price. These are buyers placing large orders to support the higher level.
If those bids don’t appear, or if they suddenly disappear, that’s a problem! It means there’s no solid buying interest to hold the move. The breakout is likely fake. This is a typical setup for a tech stock breakout trap. Understand this trap better through the graphic below:
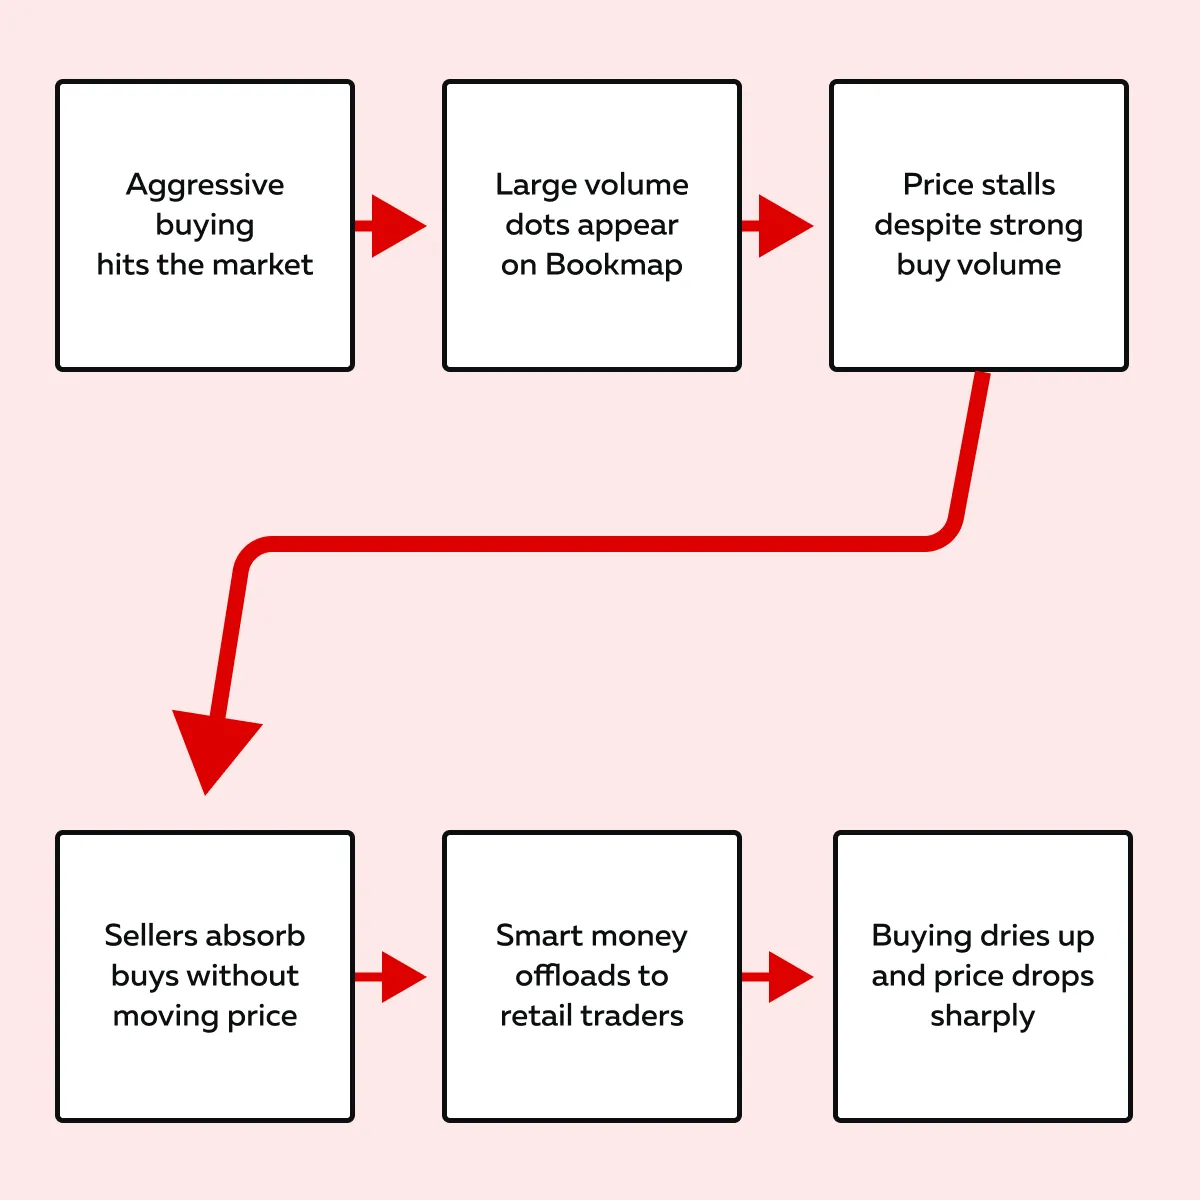
2. Aggressive Buyers Keep Hitting Offers—But Price Stalls
Sometimes, you’ll see a lot of buy volume hitting the market! On our advanced market analysis tool, Bookmap, this shows up as large volume dots on the chart. It looks like buyers are in control.
But if the price isn’t moving higher, you can’t make this conclusion. Due to “absorption,” sellers sometimes take all the buy orders without letting the price rise. Often, this means large sellers (institutions or smart money) are selling to retail traders chasing the move.
This kind of order flow bull trap often leads to a sharp drop after the buying dries up. Understand this absorption trap better through the graphic below:
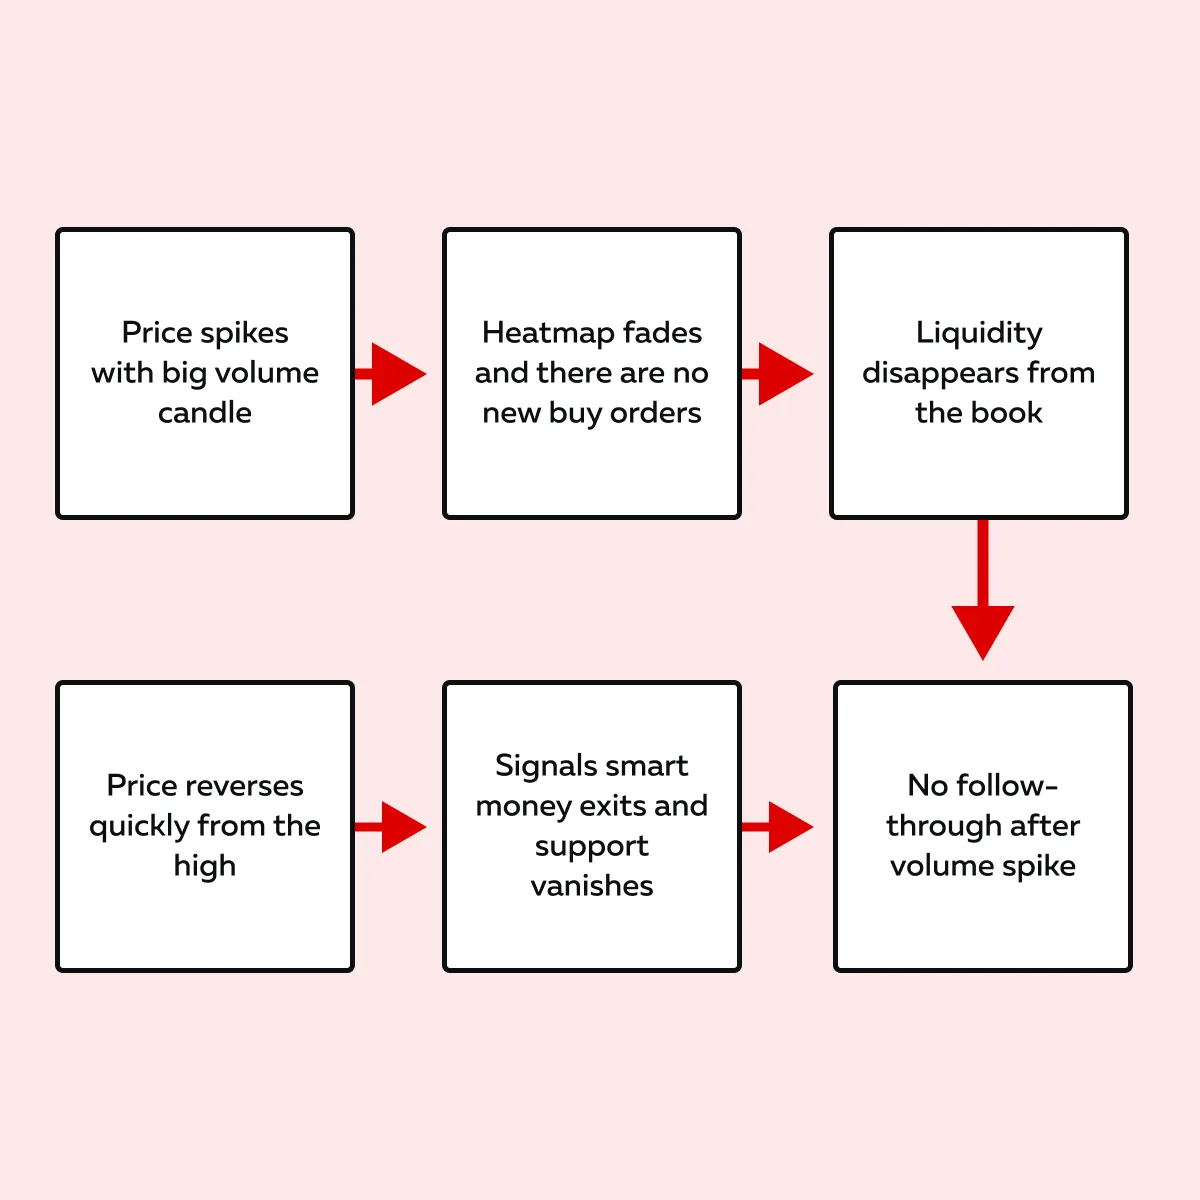
3. Volume Spikes at Highs, Followed by Liquidity Pulls
If the price suddenly jumps, and you see a big volume candle at the high, it might look like strong buying. But what happens next is more important!
Say there’s no follow-through and our Bookmap’s heatmap fades. Now, this means buy orders vanish from the book (that’s a red flag). It shows buyer exhaustion. The large volume may have been the last push before smart money pulled out. Please note that without support, the price often reverses fast!
Understand this event better through the graphic below:
How to Trade Tech Breakouts (Without Getting Trapped)?
Tech stocks move rapidly during breakout setups! These moves can turn into traps if you jump in too early. Let’s understand how to trade them with more care, by using our avant-garde market analysis tool, Bookmap, and paying attention to the bigger picture:
A) Wait for Confirmation
-
- Don’t buy just because a stock or index like NQ breaks above a resistance level.
- A breakout means nothing unless:
-
- Volume increases
and
- Bids start stacking up below the new price.
- That’s how you know real buyers are supporting the move.
- Without that support, the breakout can fail quickly.
B) Size Down in Rotational Environments
-
- When big investors start shifting money from one sector to another (e.g., moving out of tech and into defensives), markets usually become unstable.
- This is called sector rotation, and during this time, volatility increases without warning.
- That’s why it’s smart to reduce position size.
- By executing smaller trades, you can stay in better control if the market suddenly reverses.
C) Use the Tape to Confirm the Flow
-
- Our avant-garde market analysis tool, Bookmap, shows you the real-time order flow:
- Who’s buying,
- Who’s selling, and
- How aggressive they are.
- Our avant-garde market analysis tool, Bookmap, shows you the real-time order flow:
- Watch the tape (the flow of trades) to see if real buyers are stepping in.
-
- Say volume is heavy, but the price isn’t moving up.
- This is a sign of absorption.
- Here, large sellers are offloading into retail buying.
- That’s how order flow bull traps start.
Bonus Tip: Set Alerts for Mega Caps
Set alerts on our advanced market analysis tool, Bookmap, for major tech names like
- AAPL,
- TSLA, and
- NVDA.
Usually, these stocks lead or drag the whole Nasdaq. If the index (NQ) is pushing higher but these leaders are failing at key levels, it may mean the rally is losing strength. When the biggest names can’t hold up, the breakout often runs out of fuel and reverses!
Conclusion
In summer markets, not every breakout leads to a real trend! Some of the cleanest moves can turn out to be bull traps (particularly in tech stocks). Please realize that just watching the price isn’t enough. You need to look at what’s happening underneath, like volume, bid support, and liquidity.
Our modern market analysis tool, Bookmap, can let you see if real buyers are behind the move or if big players are stepping back. That can help you avoid false breakouts and spot where the money is actually going during sector rotation.
Want more knowledge about these setups? Check out the Bookmap Learning Center. It’s full of helpful guides on reading order flow. You can also track the market live on Bookmap during earnings season or rotation weeks to get a clearer picture of what’s really moving the market. Don’t chase fake breakouts—watch real-time liquidity and volume with Bookmap.
FAQ
1. Why are tech stocks vulnerable this summer?
Tech stocks had a big rally earlier in the year. Now, many of them are slowing down! As a result, big investors are:
- Taking profits
and
- Moving money into safer areas like energy or healthcare.
This shift is called sector rotation. It can leave tech stocks with less support and make them more likely to drop (even if prices still look strong on the surface).
2. How can I tell if a breakout is real or a trap?
A real breakout usually has:
- Strong buying volume
and
- Big buy orders are stacked under the price.
That means buyers want to support the move. If the price goes up but there are no new buyers or orders to hold it up, it’s likely a bull trap! A move that looks good at first but fails quickly!
3. What’s the benefit of using Bookmap for sector rotation?
By using our modern market analysis tool, Bookmap, you can see what’s happening beneath the price! You can watch in real-time:
- If buyers are showing up
or
- If liquidity is disappearing.
This tells you whether money is really moving into or leaving a sector. This kind of analysis is critical when tech is weak and other sectors are gaining strength.
4. Should I trade tech breakouts right now?
You can still trade them, but you need to be careful. Don’t buy just because the price goes up! Instead, look for signs that real buyers are supporting the move (like volume and stacked bids). If you don’t see that, it might be a tech stock breakout trap. Also, wait for confirmation before entering.
Sign Up Now