See volume more clearly in real time.
Compare plans to access deeper market visibility for volume.
Education
September 24, 2025
SHARE
How Volume Clusters Reveal the Next Market Move
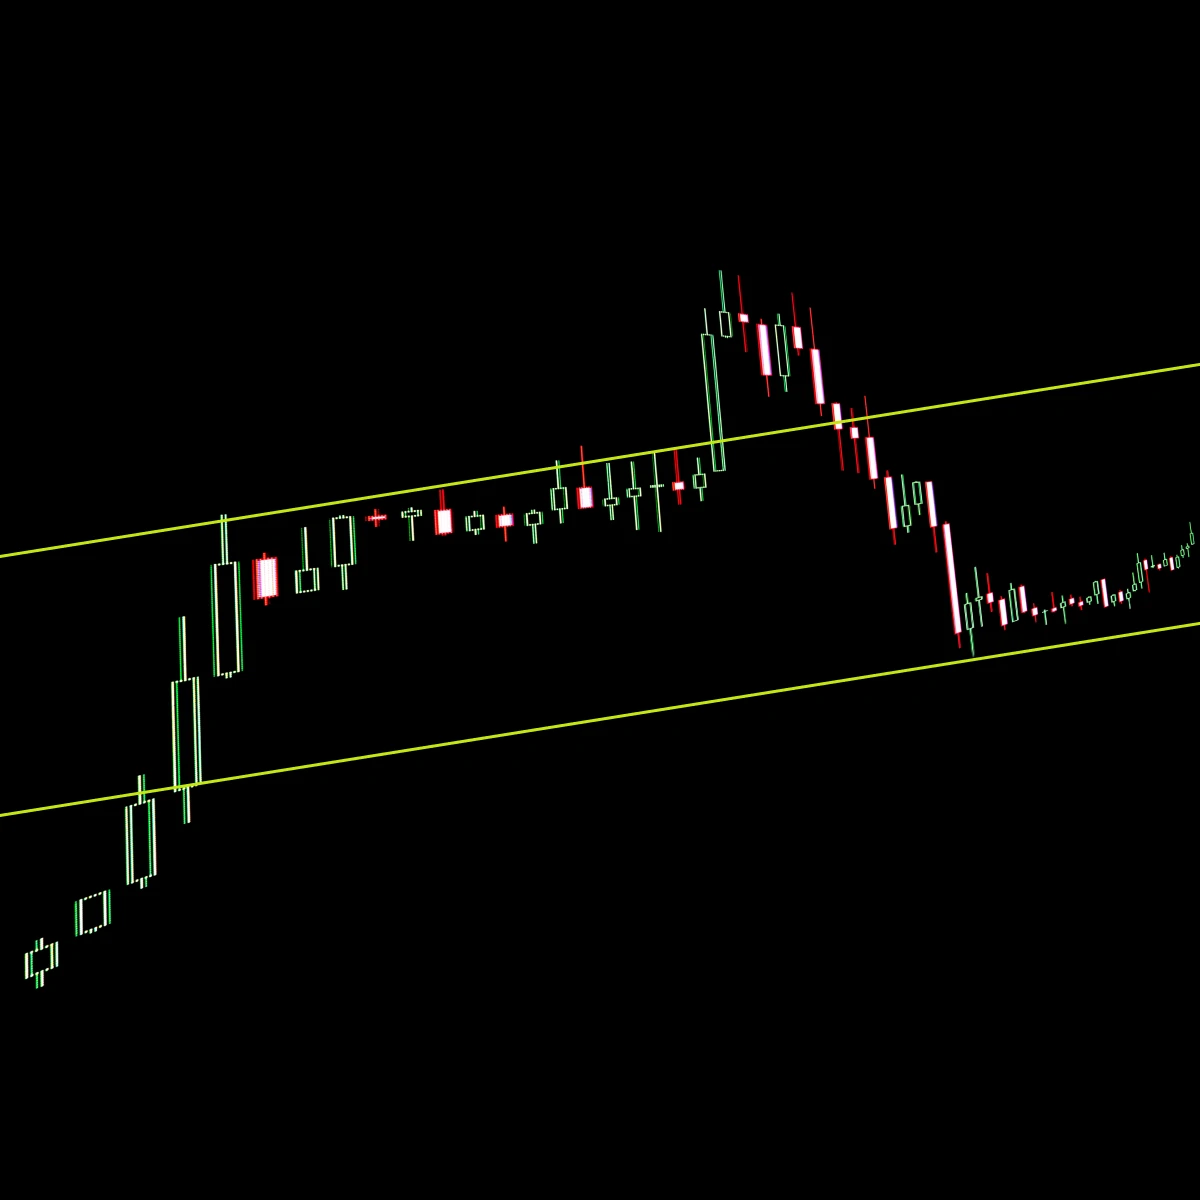
Price action tells you where the market has been. But volume tells you where it wants to go! And that is exactly where the story of volume clusters begins.
How many times have you noticed a price level where thousands of trades fire off in seconds? Do you think it is just noise? Nope! It is a battle between buyers and sellers. They leave behind footprints of their intent, and by analysing those footprints, you can easily predict the next big move.
Want to learn how? In this article, you will learn about volume clusters, their significance, and how to use them. You will understand how to do order flow analysis and analyse trading volume patterns. Read this article till the end to sharpen your market prediction game!
What Are Volume Clusters?
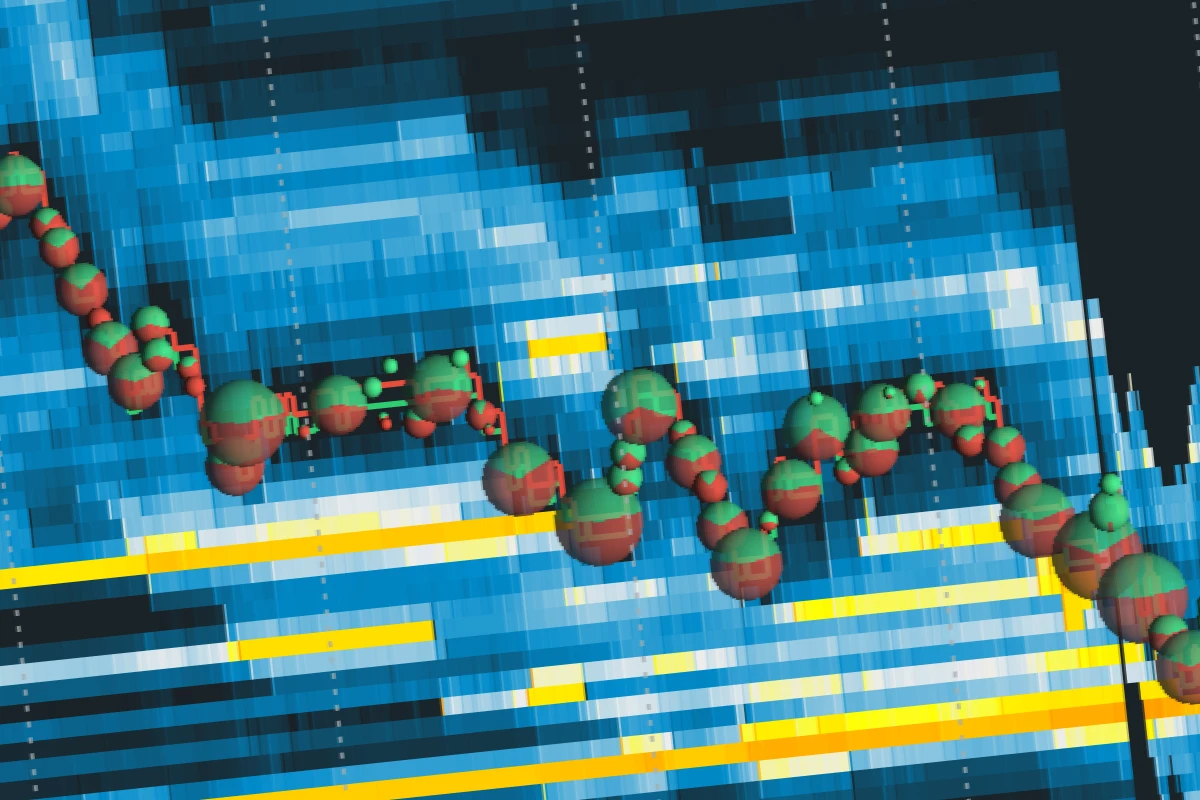
The Volume cluster is a hotspot on the price chart. It is the zone where a large number of trades take place in a very short span of time, and that too within a tight price range. Moreover, it is not just a random activity! Instead, it shows where buyers and sellers are battling it out with high conviction.
Usually, these clusters appear at critical turning points or during strong continuation moves. Thus, for most traders, they are highly valuable for market prediction.
How They Differ from Volume Profile
A volume profile gives you the big picture! Yes, it shows how trading volume was distributed across all price levels for the entire session. For example, a high-volume node means that the price level attracted heavy interest throughout the day.
In contrast, a volume cluster zooms in on a “specific moment.” It shows you intense trading activity that happens quickly, but does not reveal short-term pressure points.
But, You Can’t Miss Clusters!
Clusters leave behind footprints of aggressive order flow. They represent strong commitment from buyers or sellers, and that is why the market often “remembers” these levels. When price revisits them, it usually reacts again by either:
- Stalling and bouncing
or
- Breaking through with force.
Most traders use these insights as part of their volume trading strategies and order flow analysis. This allows them to anticipate moves.
Let us understand better through an example:
- Say ES futures are trading at 4520.
- Suddenly, 15,000 contracts get executed in under 3 minutes.
- Price rallies afterward, but later comes back to 4520.
- Now, at this point, the trading slows.
- Also, the market hesitates before breaking lower.
- Why? That hesitation happened because of the earlier volume cluster.
The Market Psychology Behind Clusters
Do you really want to understand volume clusters? You must look at the psychology driving them. Yes, as a trader, you should note that these are not just random spots where trading happens. Instead, by analysing them, you can learn how aggressive traders and institutions interact.
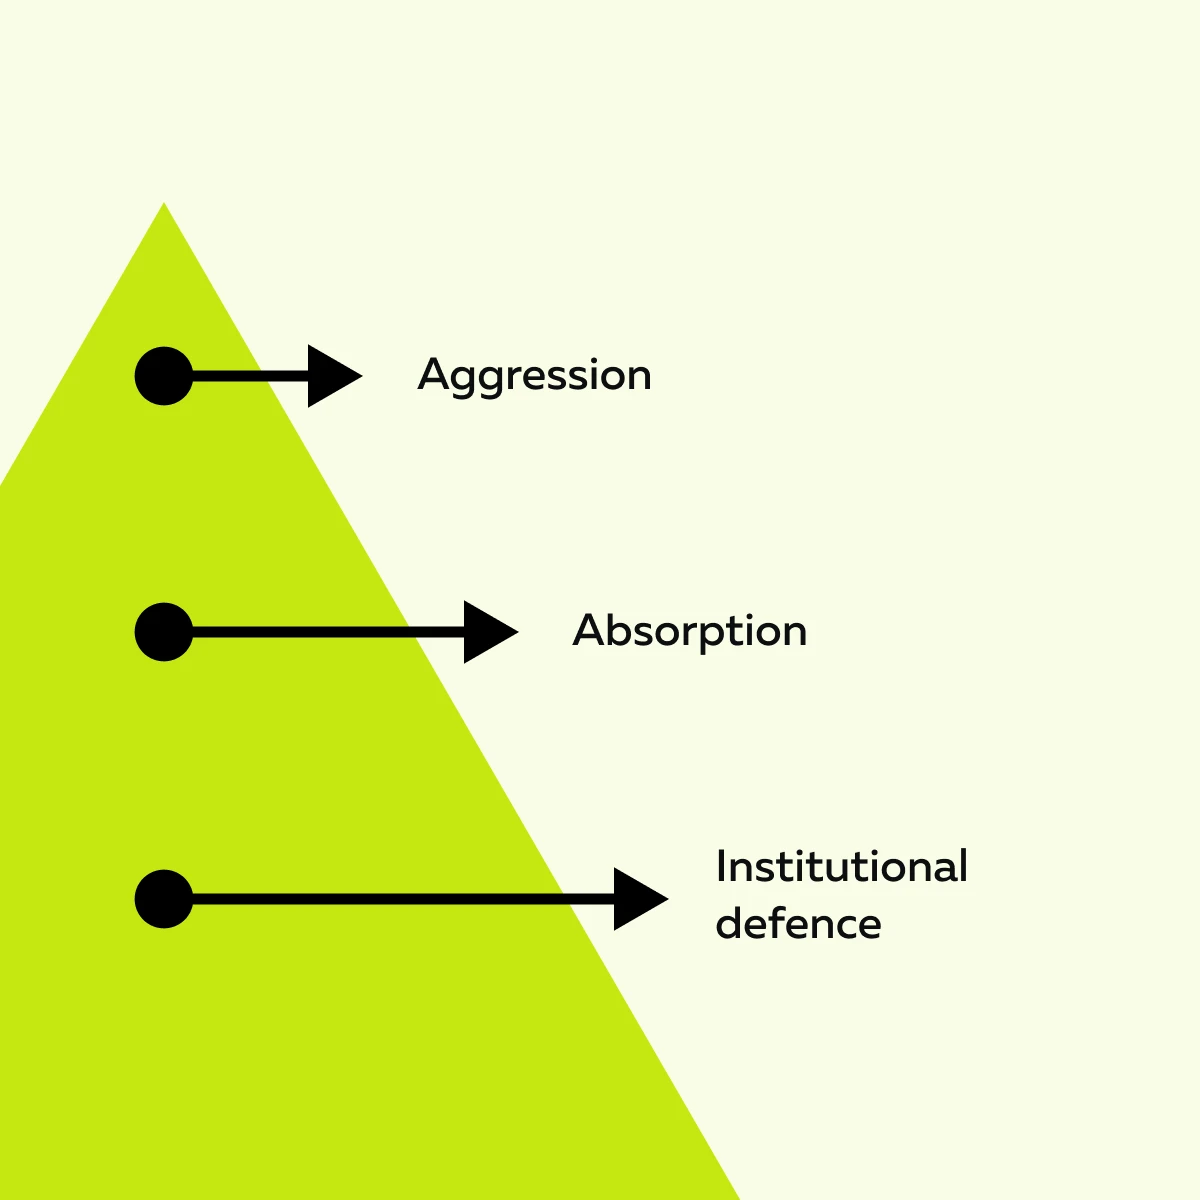
Why do clusters form?
Let us check out some important concepts:
Aggression vs. Absorption
A cluster often forms when aggressive traders repeatedly hit the market. This frequent hitting forces trades into resting liquidity. Now, two things can happen:
| Absorption Wins | Aggression Wins |
|
|
That is why most traders analyse clusters as they can mark breakouts or strong directional moves. See how Bookmap helps traders identify market-moving volume clusters before the crowd reacts.
Position Building and Defense
Large institutions often use clusters for position building. For example,
-
- They try to scale into a big, long position at a cluster level.
- Next, they spread their orders over time.
- Later, if the price returns to that area, they try to defend it.
- How? They buy again to protect their earlier entry.
- Now, this defense often shows up as another cluster.
Why Price Remembers These Areas
When heavy positioning takes place, it leaves behind “memory points.” Traders who got involved there have skin in the game! So, when the price returns to these levels, they usually act in one of the two ways:
- Defending their level
or
- Cutting their losses.
This repeated activity creates trading volume patterns. Most traders read them using popular market prediction tools, like our marketing tool, Bookmap, to forecast reactions.
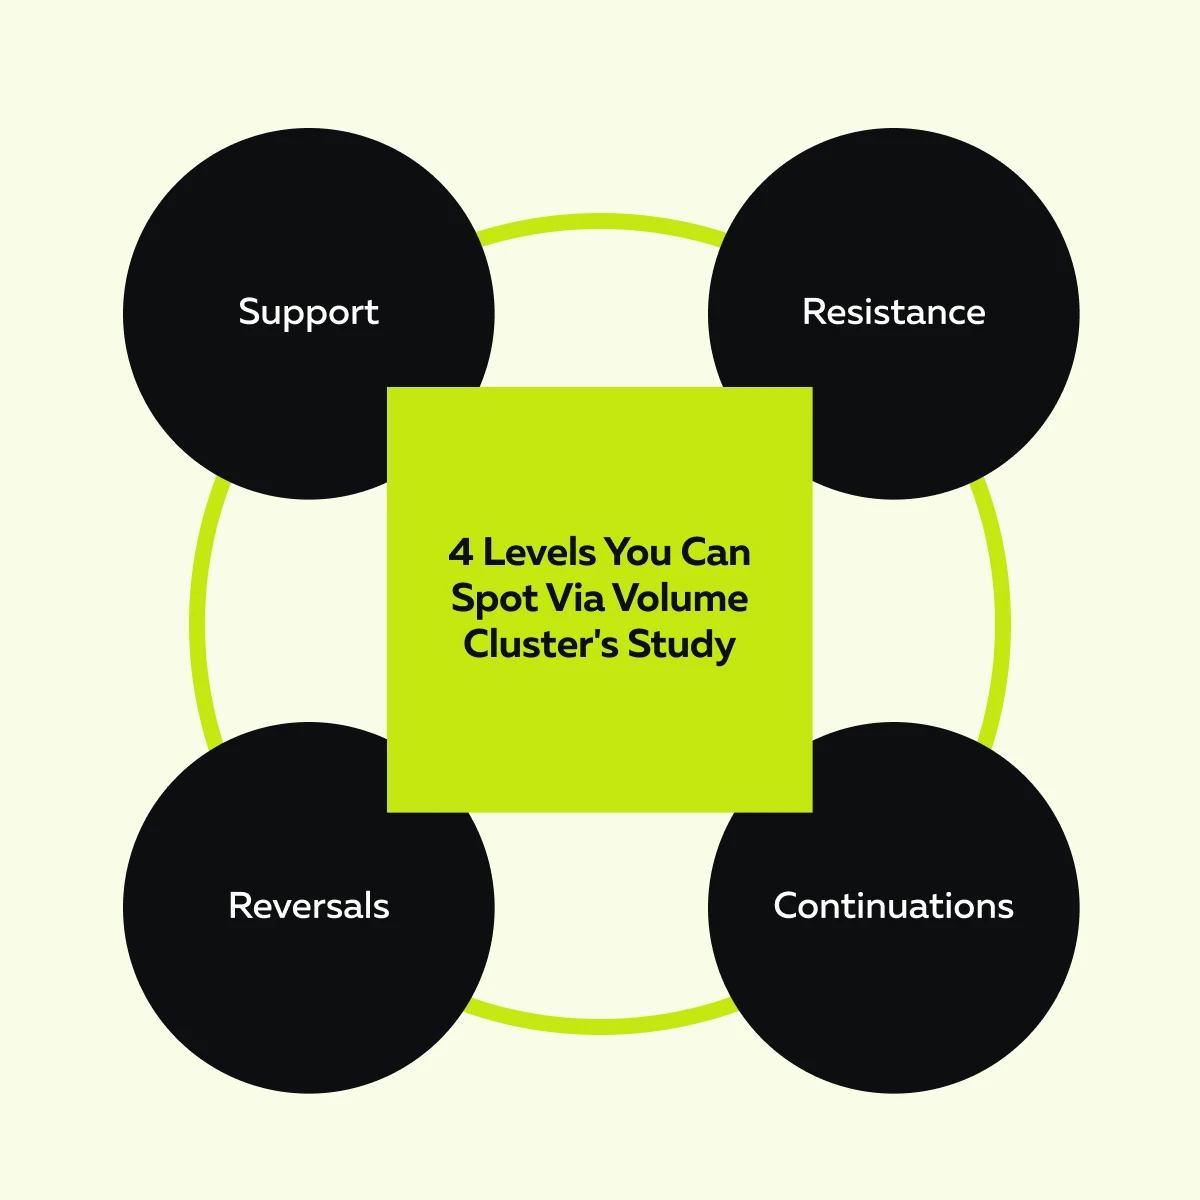
How Volume Clusters Can Predict the Next Market Move
Want to know one of the biggest reasons why traders pay attention to volume clusters? That is because they often leave clues about where the price might head next! As a trader, you should study these trading volume patterns through order flow analysis. Let us see how they can help you:
Compare Bookmap packages and start tracking high-volume levels today.
Support and Resistance Formation
When a cluster shows strong buying, that area often becomes “support.” For those unaware, it is a level where price tends to bounce. If sellers dominate a cluster, it acts as resistance. This caps further rallies. Once price breaks through such zones, they frequently flip roles with old resistance turning into new support, or vice versa.
Magnet Effect
High-volume clusters often act like magnets! Why? That is because they represent areas of unfinished business, which are sometimes called “unfinished auctions.” At these levels, price usually revisits them. This retest can happen within the same session or even days later. It all depends on the cluster’s time frame.
Now, let us check out two types of signals that you can track:
| Continuation Signals | Reversal Signals |
|
|
Identifying Clusters in Real Time
Want to know a secret? Try to spot volume clusters while they are forming! Yes, it is one of the most powerful ways traders can use order flow analysis for market prediction. These clusters reveal where heavy battles between buyers and sellers are happening.
Need a tool? Our advanced real-time market analysis tool, Bookmap, makes them much easier to see. Below are some key signs you can check out to recognize a cluster in action:
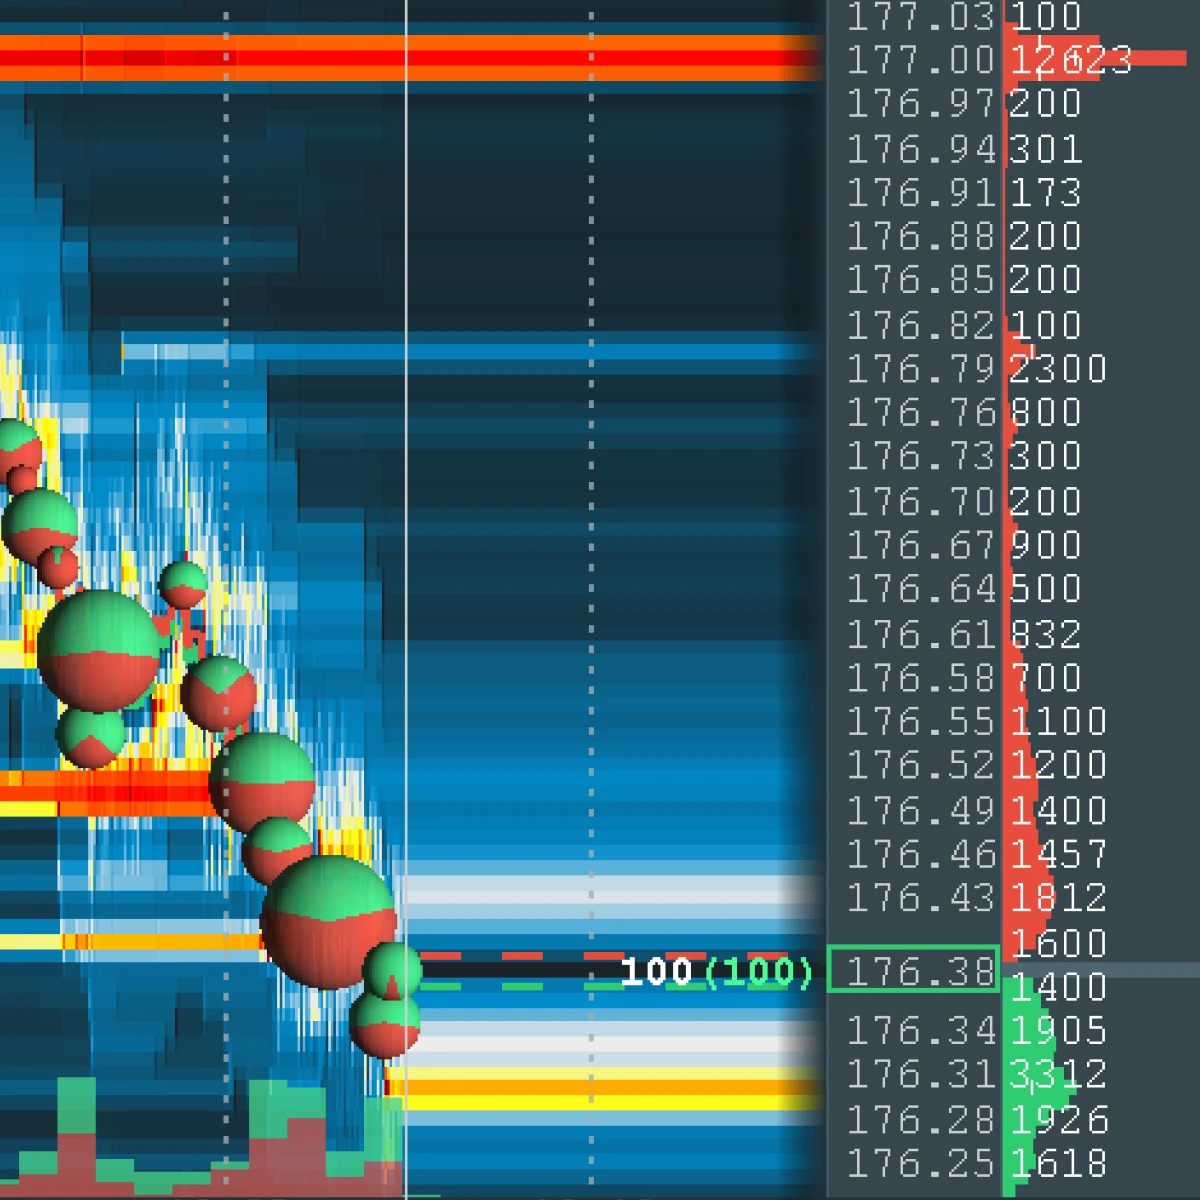
Sign I: Executed Volume
Try to see a dense concentration of executed volume:
- At one price level
or
- Within a very tight range.
On our trading platform, Bookmap, these show up as large volume dots. They are often stacked around a liquidity band. By analysing the order flow, you can learn how repeated executions happened at the same price levels. This indicates that traders are continuously engaging there.
Sign II: Context Filters
Not all clusters carry the same meaning! It also depends on context. Let us see how:
| Session Timing | Volatility |
|
|
Watch clusters form in real time with Bookmap’s market visualization tools.
The Pro Bookmap Tip

You can start using our marketing tool, Bookmap, and easily spot clusters in real time. Follow these tips for maximum benefit:
- Adjust the volume dot size so heavy trading stands out clearly.
- Watch how clusters interact with the heatmap liquidity bands. If liquidity and executed volume align, it strengthens the signal for your volume trading strategies.
- Track repeated executions at the same price levels. This confirms real cluster formation.
- Pay attention to clusters forming near session highs/ lows, as they often signal turning points.
- Combine cluster analysis with order flow imbalance. This lets you see which side (buyers or sellers) is in control.
Trading Strategies Around Volume Clusters
By now, you should have a good understanding of how to identify volume clusters. Now, the next step is to actually trade around them. Most traders use volume clusters as reference points while trading. Let us see some of the best trading strategies to trade around clusters:
Breakout and Retest
When price breaks out above or below a cluster, that same area often acts as a retest zone. As a trader, you can use this point to enter in the direction of the breakout. Why? Because it shows strong conviction! Need more details? A great resource is to read this article in full – Breakout or Fakeout: The 3-Point Checklist for Confirmation.
Fade at the Edge
Say price approaches a dominant cluster from the opposite side but fails to break through. Now, this signals exhaustion. Most traders often take this as a short-term reversal play and try to fade the move back away from the cluster. This means they try to trade against the failed attempt.
For example:
- Let us say the price goes up into a strong cluster.
- However, it cannot break higher.
- Now, traders may sell (short).
- Why? Because they are expecting the price to drop away from that cluster.
Cluster-to-Cluster Moves
Markets often behave like they are traveling between “islands” of activity! Once price leaves one cluster, it gravitates toward the next one. This makes established clusters natural target zones for:
- Intraday
and
- Swing setups.
Risk Control
When trading clusters, you should place stop-losses outside the cluster zone. The benefit? It prevents getting stopped out by normal retests. Be aware that such retests happen frequently around these levels.
Furthermore, do not trade blindly into a fresh cluster unless you understand who is in control (buyers or sellers). Otherwise, you are stepping into the middle of an unfinished battle.
Conclusion
Volume clusters act like the market’s memory, highlighting the exact area where buyers and sellers have engaged in intense competition. And these areas matter! Why? Because they often guide the next reaction. By analyzing them, you can learn whether it is support, resistance, or a breakout zone.
If you are simply watching candlesticks, you are not doing enough! Ideally, you should analyze clusters by looking into the real battle of supply and demand.
Need a tip? Try to combine order flow analysis and trading volume patterns. By forming your volume trading strategies around them, you can gain an edge in market prediction.
The good news is that you do not have to track this manually! Our avant-garde real-time modern tool, Bookmap, allows you to see clusters in real time and visualize liquidity. So, want to spot opportunities with 100% clarity? Spot the battle lines in the market with Bookmap’s live heatmap and volume dots.
FAQ
1. What is the main difference between a volume cluster and a high-volume node in a profile?
A high-volume node comes from the volume profile, which shows trading activity across all price levels for the entire session. It tells you where the market spent the most time and volume.
On the other hand, a volume cluster focuses on a specific moment. It shows short bursts of intense trading at one level over a short time.
So, Profile = big picture and Clusters = short-term battles.
2. Do clusters always act as support or resistance?
Not always! Many times, clusters do become support or resistance zones. This happens because traders remember these levels and act again when the price returns.
However, this depends on market context:
- Let us say buyers were in control when a cluster formed. Now, it may hold as support.
- In comparison, if sellers dominated, now, it could act as resistance.
3. Are volume clusters useful in fast markets like crypto?
Yes, clusters work in any market with active order flow:
- Stocks
- Futures
- Crypto
Confused about crypto? In crypto, clusters work because the market moves quickly and trades 24/7. In this market segment, clusters can still highlight areas of heavy trading interest.
However, the challenge is that reactions happen faster. Thus, as a trader, you need to be more responsive.
4. How can I spot clusters without Bookmap?
You can use regular volume-at-price tools or platforms with volume profile indicators. These show where more trades happened at each price. However, they do not give the same real-time clarity as our trading platform, Bookmap.
On Bookmap, clusters appear as large volume dots right on the chart. This makes them easy to see instantly. Without them, spotting clusters is harder and less precise.
Sign Up Now