See market more clearly in real time.
Compare plans to access deeper market visibility for market.
Education
August 8, 2025
SHARE
The Market Isn’t Out to Get You: Understanding Liquidity, Not Conspiracies

Do you ever feel like the market has a personal grudge against your stop loss? — You’re not alone, and you’re not wrong. But you’re also not the target! Sometimes, price behaves the way it does, and it often feels like the market is “out to get you.” But that’s not true, as there are no grudges!
Want to see the market with more clarity and confidence? In this article, you will learn how liquidity in trading works, what role stop outs and market makers play, and whether or not the market is rigged.
We’ll also explain how our avant-garde real-time market analysis tool, Bookmap, can let you see market structure in real time so that you can avoid common traps like false breakouts and premature entries. Let’s begin.
Why Price Moves the Way It Does
Feeling the market is out to get you? It is a common feeling when your stop loss gets hit. But, please realize that price doesn’t move to target individuals specifically. Instead, price moves as part of a constant search for buyers and sellers!
You can think of it like an auction, where the goal is to match people:
- Who wants to buy
with those
- Who wants to sell.
In this auction, big players like institutions or market makers usually try to buy or sell a massive amount instantly. To do that, they need enough people on the other side of the trade. So, price often moves to areas where that “volume” or liquidity in trading is likely to exist.
Want to know about these areas? Check out the graphic below:
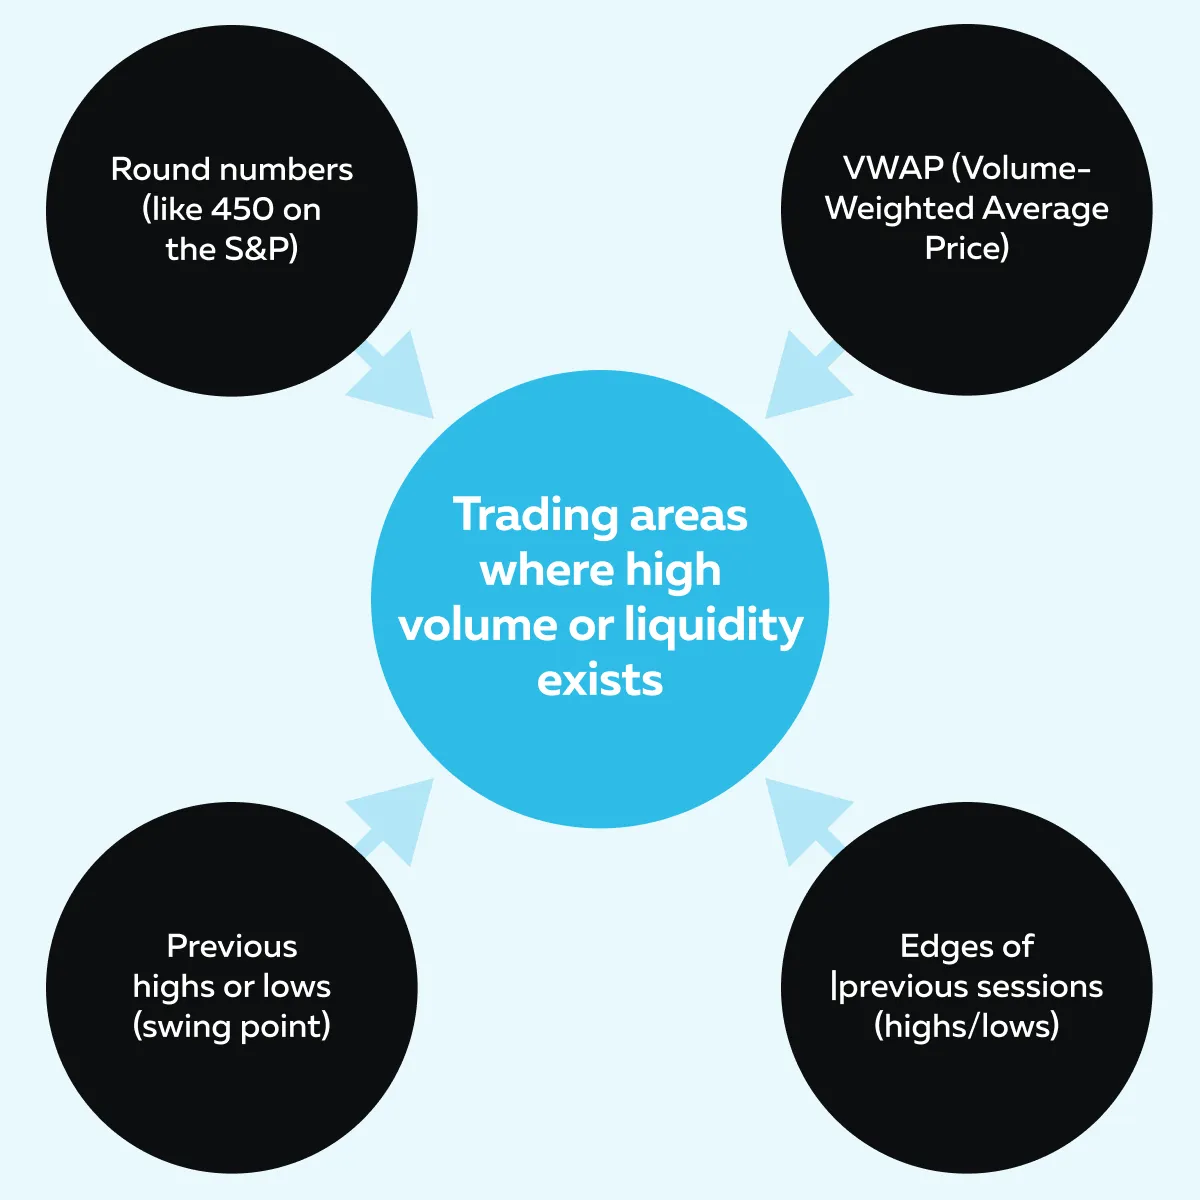
However, just because the price reaches those levels doesn’t mean it will keep going in that direction. Sometimes, the market just probes those areas! This is often called “slosh” behavior. For those unaware, it means price moves around looking for interest but doesn’t fully commit.
Usage of Liquidity Around “Obvious Stop Zones” by Large Players!
Now, here’s something really important:
- When a group of traders is forced to exit, that creates energy.
- For example:
- Say stop-loss orders get triggered or breakout traders get trapped.
- This causes fast moves or sharp reversals.
- This process is sometimes linked with stop-outs by market makers.
- But please note that the market is not rigged.
- Instead, large players use liquidity around obvious stop zones to get better entries or exits.
The Return of Price to its Value Area
In another case, sometimes, price will break above a key level like yesterday’s high, and traders think, “It’s a breakout!” But if new buyers don’t show up, the price won’t “accept” above that level. It just falls back. Why? That’s because the market didn’t find enough reason or liquidity to stay up there.
When that happens, the price often returns to its “value area.” It is a concept from auction market theory. It is just a fancy way of saying “the zone where most trading happened before.” Let’s understand better through an example:
- Say ES futures break above the previous day’s high.
- This move:
- Triggers stop orders (stop outs)
and
- Excites breakout traders to buy.
-
- But if no real buying support comes in, the price can’t hold.
- It falls back.
- Why? Because the market didn’t accept those higher prices!
- So, it just returns to where trading was balanced earlier – the value area.
Common Situations That Feel Like “The Market Got Me”

Sometimes it feels like the market is watching your screen! Your stop gets hit, and then the price goes exactly where you thought. But most of these painful moments are just how liquidity in trading works.
Let’s study some classic examples:
The False Breakout
You see a strong level, maybe yesterday’s high, and the price breaks above it. You jump in, expecting a big rally! But instead, the price spikes up, then quickly snaps back down.
You’re left wondering – Was that a trap?
Let’s understand what happened:
-
- Many traders had stop orders or breakout entries just above that level.
- Large players know this!
-
- Thus, they push the price just enough to trigger those orders.
- Once they get the liquidity they need (your stops), their job is done!
- As a result, the move reverses.
This is a classic case where it might feel like the market is rigged. However, it’s just the market doing what it always does—”seeking out liquidity.”
The Reversal After Your Stop Gets Hit
For example, a trader sets their stop carefully! But price tags it, stops them out, and then, like magic, moves exactly in the direction they originally planned. Is this pain relatable?
Let’s understand why this happens:
- The stop was likely placed near an obvious liquidity zone, a place many others also used.
- Market makers or large players absorb those stops to fill big orders.
- Once they’ve “collected” enough volume, they let the price move in the intended direction.
So, it’s not personal. It’s just how the market finds buyers and sellers!
The Premature Entry
Let’s assume you anticipate a breakout or reversal and enter early. But price fakes you out! It dips the other way before finally making the move you expected. Is this bad luck? No! Its structure.
Let’s understand this structure through the graphic below:
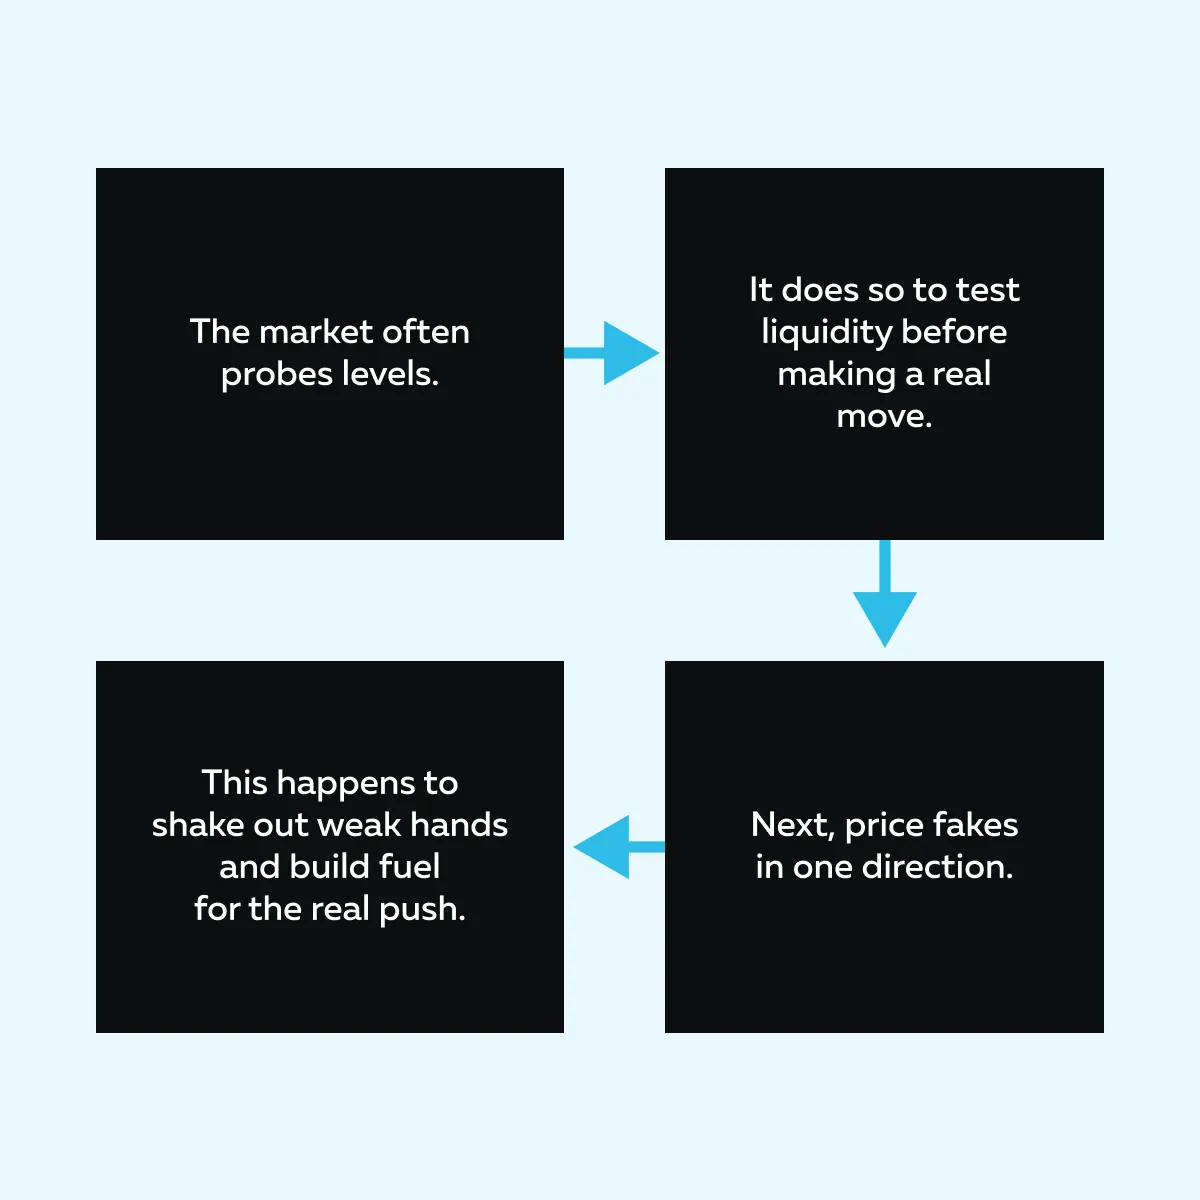
Please understand that the above process is normal in auction-based markets. That’s how the market finds commitment from bigger players.
These moments feel unfair, but they aren’t a sign the market is rigged. Instead, they’re symptoms of how liquidity in trading works. Understand the real drivers behind price moves—compare Bookmap plans today.
What Liquidity Looks Like in Real Time
Firstly, you must understand what liquidity is. Liquidity simply means orders waiting in the market to be filled. These are called “resting orders.” They sit on the order book and are ready to buy (bids) or sell (offers) at certain prices.
When there are a lot of these orders at a price level, that area has “high liquidity.” It’s like a magnet for price, because that’s where big players can get trades done!
What You See on Bookmap

In our advanced real-time market analysis tool, Bookmap, you can spot high liquidity through these observations:
| Major Bookmap Observations | Meaning |
| Resting liquidity shows up as bright zones on a heatmap. | These are clusters of limit orders. |
| Aggressive market orders appear as volume dots. | These are traders trying to buy or sell right now, at any price. |
Together, they show the battle between buyers and sellers in real time! Now, let’s see how a false breakout and reversal appear in real-time on our advanced market analysis tool, Bookmap.
On a False Breakout
For example, the price is moving up toward a known resistance level. Now, on your screen:
- You see bright heatmap lines (resting sell orders) at that key level.
- As the price hits that zone, a burst of volume dots appears.
- This shows aggressive buyers are trying to break through.
But here’s the catch! If those buyers fail to keep pressure after the breakout, meaning no new liquidity support forms below the level, the move dies.
Result? Price snaps back! It creates what feels like a trap or manipulation. But you must realize that initially, it was just the market reacting to where liquidity was available. Later, the market rejected the move when new buyers didn’t show up.
On a Reversal
For instance, the price is falling fast into a support zone. Now, you’ll see large resting buy orders at the low. Please note that it’s liquidity waiting to absorb the drop. As the price hits that level, there’s a flush of sell stops (people getting out).
Once those sell orders are filled and new buy orders start to appear, the market changes direction. For those unaware, this change is called a “liquidity flip.” Due to this flip, the buyers are back in control.
It is significant to mention that this kind of reversal is very common around:
- Stop outs
and
- Major support zones.
Again, it’s not that the market is rigged. Instead, market makers and larger players used that moment of panic to get in. Stop blaming the market—start seeing liquidity shifts in real time with Bookmap.
How to Avoid Feeling “Targeted”

Every trader knows this feeling:
- You set a stop loss.
- The market hits it perfectly.
- As a result, you get stopped out.
- Then the price shoots off in the direction you originally planned.
Yes, it’s frustrating! It starts to feel like the market is rigged against you. But in reality, it’s not personal—it’s structural. These moves are part of how the market works around liquidity in trading.
Let’s understand in detail:
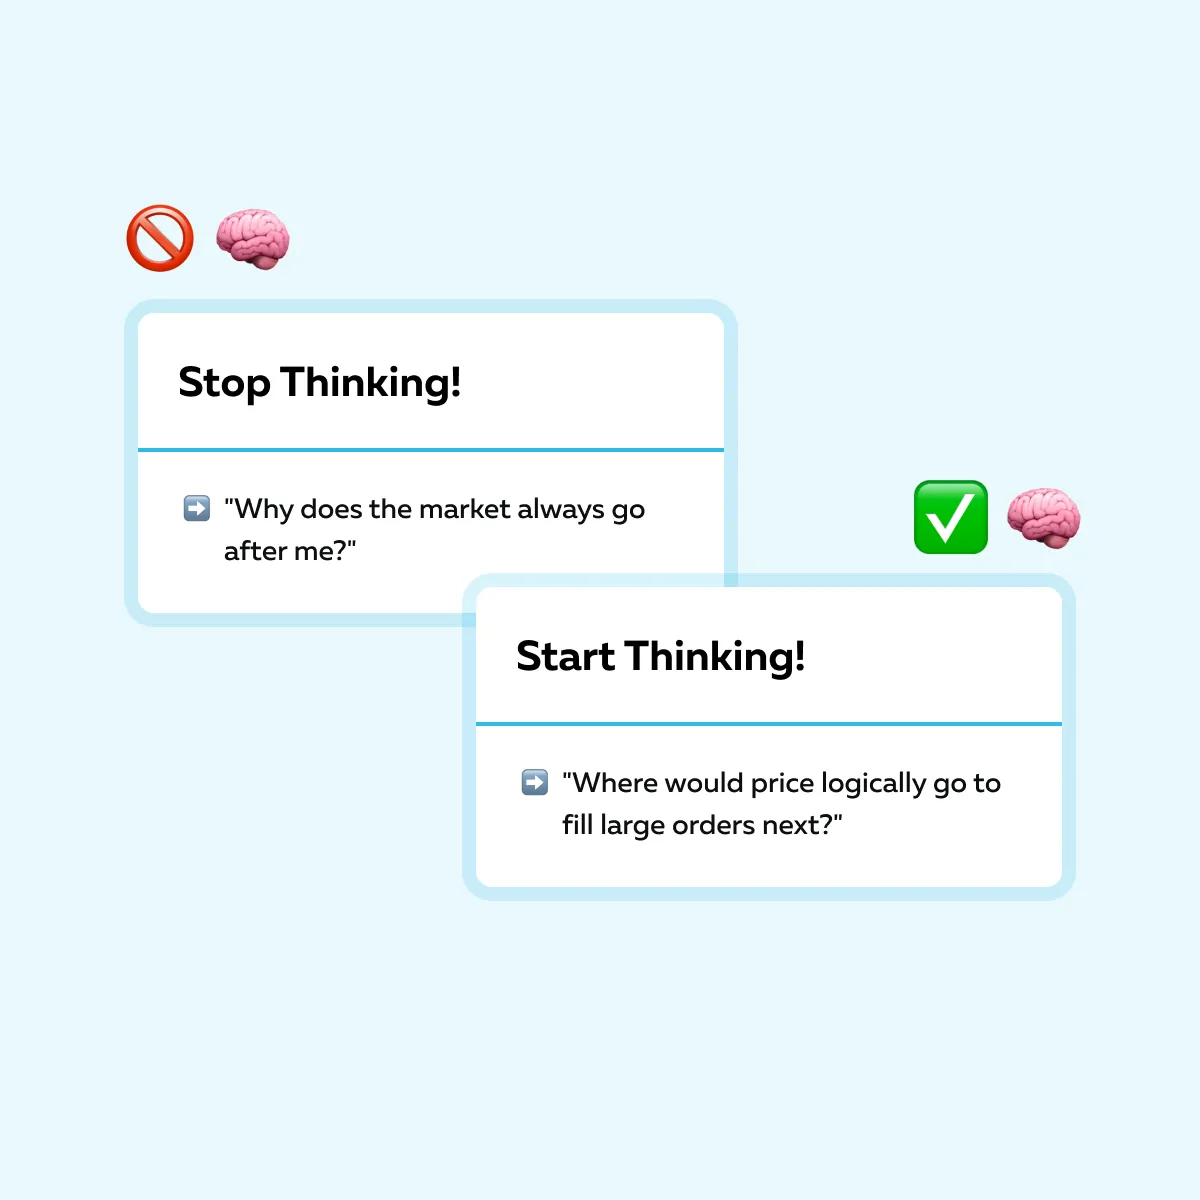
Think Like Liquidity
Price doesn’t “hunt” your stop just because you placed it. Price moves toward where orders are sitting, and that’s usually where liquidity has built up. Large players like institutions, funds, or market makers need those resting orders to enter or exit big trades.
So, what should be your approach? Read the graphic below:
For more clarity, let’s study an example:
Let’s say price is creeping toward a round number like:
- 4500
or
- A prior high from yesterday.
You know, traders often place stop losses there or breakout buy orders. Now, that creates a liquidity pocket:
- Stop losses = sell orders
and
- Breakout entries = market buys.
This attracts large players! Not because they want your stop, but because that’s where they can find volume. Once price clears that level and consumes the liquidity, it may:
- Reverse (if the breakout fails)
or
- Move freely (if a new interest comes in).
Either way, that area was never about you! It was about the structure of the market and how it handles large orders.
How to Avoid Getting Caught
Before entering any trade, do this simple checklist:
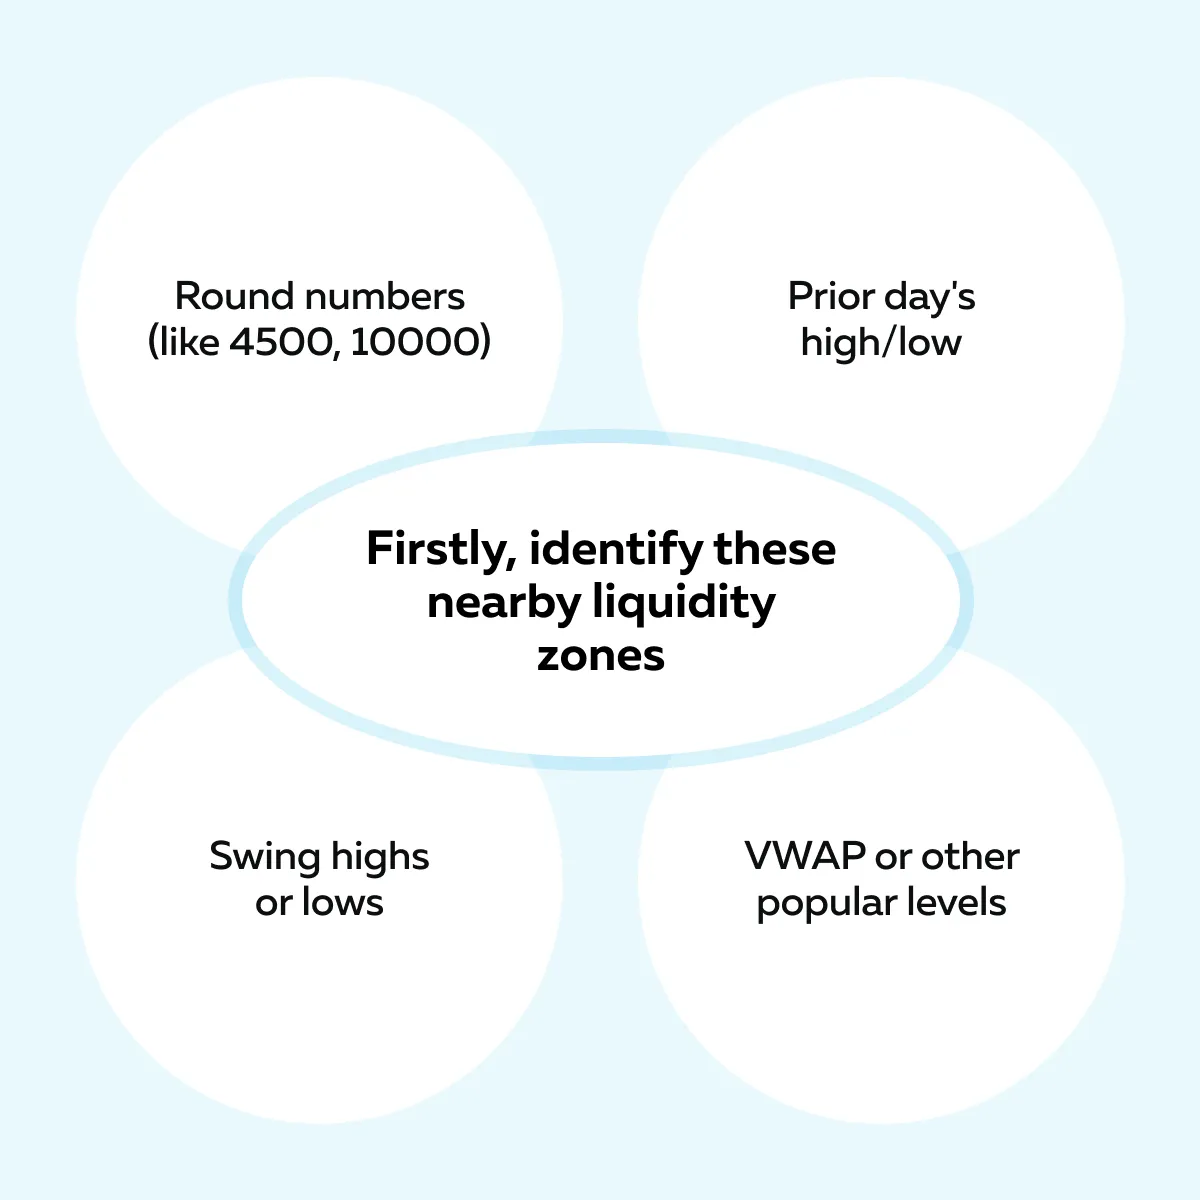
Next, ask yourself – “If I enter here, am I placing my trade into a liquidity pool — the kind that attracts price just to clear out stops?”
Lastly, adjust your entry or stop to avoid being right where everyone else is. Sometimes, even waiting for the flush and entry on the other side can drastically improve your results!
Don’t Put Stops at Obvious Levels
Most traders set a stop right below a swing low. What happens next?
- The price dips,
- They get stopped out, and
- Price then reverses.
But why? This happens because that area is where liquidity pools. Traders tend to place stops in the same spots:
- A few ticks below a swing low,
- Just above yesterday’s high, or
- Near round numbers.
These are known as obvious levels. Since so many orders are there, they create liquidity in trading. Price naturally moves to these zones because:
- It needs volume to execute large trades
and
- It can fill multiple orders quickly in one area.
So, when your stop sits in that zone, it’s not that the market is rigged! Instead, it’s just that your stop is in the same place as thousands of others. For more clarity, let’s study an example:
-
- You put a stop two ticks below yesterday’s low.
- Looks logical, right?
- But here’s what really happens – Price dips just enough to trigger your stop!
- In doing so, it hits many other stops too.
- This creates a wave of sell orders.
- Now, big buyers step in and absorb that liquidity.
- Then, the price reverses hard in the other direction.
Please realize it wasn’t about your trade. It was about where liquidity had gathered.
How to Adjust Your Stops
Want to avoid getting caught in these common stop outs? Follow these three techniques:
| I) Place your stop just beyond where the crowd’s likely to be | II) Use structure-based stops | III) Manual exits (if the setup allows) |
|
|
|
Wait for Confirmation
Another way traders get trapped is by jumping in too quickly, particularly at big levels. You see a price break high and think, “It’s going now!” But without confirmation, you might just be buying into a stop run.
What Confirmation Means
Don’t trust a move just because price poked through a level. Instead, wait to see if the breakout is real. Let’s see what confirmation looks like:
| Sign I: Price holds beyond the level | Sign II: Liquidity stacks behind the move | Sign III: Aggressive order flow continues |
|
|
|
For a better understanding, let’s study an example:
- Let’s say ES futures break above a prior high.
- On our advanced market analysis tool, Bookmap, you see green dots (buying pressure).
- You observe that new buy orders stack on the bid below the breakout.
- This shows that buyers keep coming in even after the break.
- Now, that’s confirmation!
- It is a sign the move has real intent (it’s not just a stop sweep).
However, if price breaks out and then liquidity vanishes, or aggressive flow stops immediately, that’s likely a fakeout. That’s only a move made just to clear out stop-outs and grab liquidity!
Your Ideal Behavior
Be patient! Pause for a few seconds or even a minute, depending on your market. It’s better to miss the first tick than to jump into a move that was only about clearing out stops.
Often, waiting for confirmation allows you to:
- Avoid false breakouts
and
- Align with the real direction.
Conclusion
Please realize that the market isn’t out to get you! Price moves are not to trap individual traders, but to find liquidity. It gets attracted to areas where enough buy or sell orders exist to fill large trades. When you understand that, things start to make more sense!
Most frustrating moments—false breakouts or getting stopped out before a reversal—are just part of how the market works. To better deal with them, you should learn how to read order flow and focus on how the price reacts around key zones.
Through these observations, you can stop taking trades personally and start making smart trading decisions. Our advanced real-time market analysis tool, Bookmap, can let you see all this in real time.
Using it, you can easily observe everything from resting orders to aggressive trades! Tired of feeling targeted? See what’s really behind stop-outs with Bookmap’s heatmap and volume tools.
FAQ
1. Is the market really targeting retail stops?
Never! The market isn’t hunting you specifically. Instead, it’s just going after liquidity! Big players need lots of orders to buy or sell. And, stop losses often sit in predictable places like below swing lows.
So, when price moves to those areas, it’s not personal. It’s just that your stop happens to be where many others are. This creates a great place for large trades to happen.
2. Why do my stops always get hit?
Your stops might be placed too close to obvious levels, like:
- Right below a support
or
- Above a resistance.
These areas usually hold a high concentration of stop orders, which attract big players looking to fill large trades. When price moves into those zones, it triggers your stop along with many others.
To avoid this, you need to better understand where liquidity pools are. Based on this understanding, adjust your stop placement slightly beyond those areas.
3. How can I avoid getting stopped out so much?
Start by avoiding the obvious! Don’t place stops at well-known levels like:
- Round numbers
or
- Just below prior lows.
Be aware that these are places where liquidity in trading builds up. They are specific targets! Instead, place stops just beyond those zones, where the market would truly show a change in trend.
Also, wait for confirmation before entering! Don’t jump into every breakout or breakdown until it shows real strength and commitment.
4. Can Bookmap help me see this better?
Yes, definitely! Our advanced market analysis tool, Bookmap, is a visual tool that shows you:
- Where large orders are sitting (called resting liquidity)
and
- Where aggressive buying or selling is happening.
This lets you see if a breakout has real power or is just clearing stops! Additionally, you can watch:
- How volume builds behind moves
or
- How volume vanishes after fakeouts.
This gives you a better chance to trade with the market’s real intention and not just its surface-level noise!
Sign Up Now