4th of July Sale
50% Off Bookmap Global+, Data & Add-Ons
Save on Global+, market data, and add-ons from July 3–13.
Market Analysis
January 14, 2026
SHARE
What If the Market Had a Memory? How Historical Liquidity Still Shapes Future Price

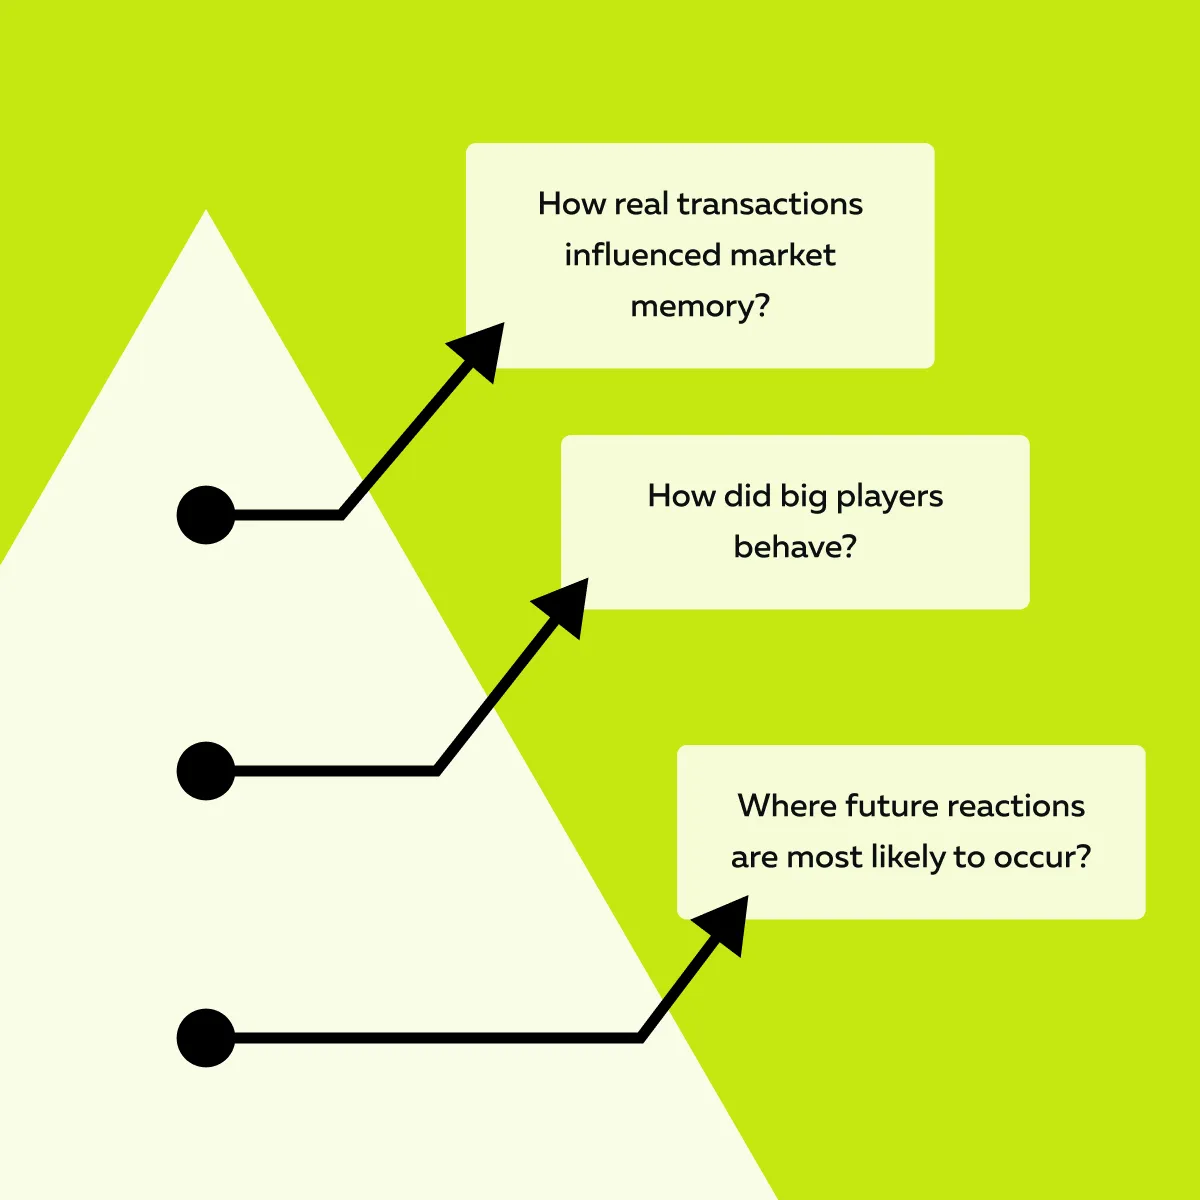
For most new traders, the price appears to move randomly! But in reality, price reacts to historical liquidity and market memory. Did these terms leave you scratching your head? What are these terms?
Historical liquidity refers to areas on the chart where significant buying or selling happened in the past. These are places where big players left a footprint. On the other hand, market memory is how the market “remembers” those zones. But how are they related to price? At these remembered spots, price may pause, bounce, or reverse. This behavior occurs because traders recall past reactions. And, don’t confuse them with some random lines on a chart. They are real liquidity zones that form due to absorption, stop runs, hidden orders, and high-volume nodes.
Read this article to understand how to spot these zones and how you can read the reactions instead of just the memory. Next, you will learn how to use order flow insights to make better trading decisions. Let’s get started.
The Concept of Market Memory in Trading
Do markets “remember” your trades? Literally, no! But their price behavior suggests they do. This idea is called “market memory”. It is the tendency of price to react around certain levels where important activity once took place.
You can think of it like this – Just as people remember where they felt pain or success, the market remembers where significant buying or selling happened. Now, these areas are built through historical liquidity. Let’s see what happens in these zones:
Next question! Do you know what happens when price revisits such zones? Traders often react again because they recall what happened there! Note that these zones are not like static support or resistance lines, which are drawn after the fact. In contrast, liquidity zones are active! They consistently change areas depending on where real buying and selling are happening.
That’s why they are formed through absorption, stop runs, or strong order flow. See how historical liquidity zones develop in real time with Bookmap’s heatmap and volume dots.
Key Types of Liquidity Zones That Create Market Memory
Not all price levels are equal. Some carry deep market memory because of how liquidity behaved there. These liquidity zones form when large orders interact with the price. Such an interaction leaves behind clues about where big players acted.
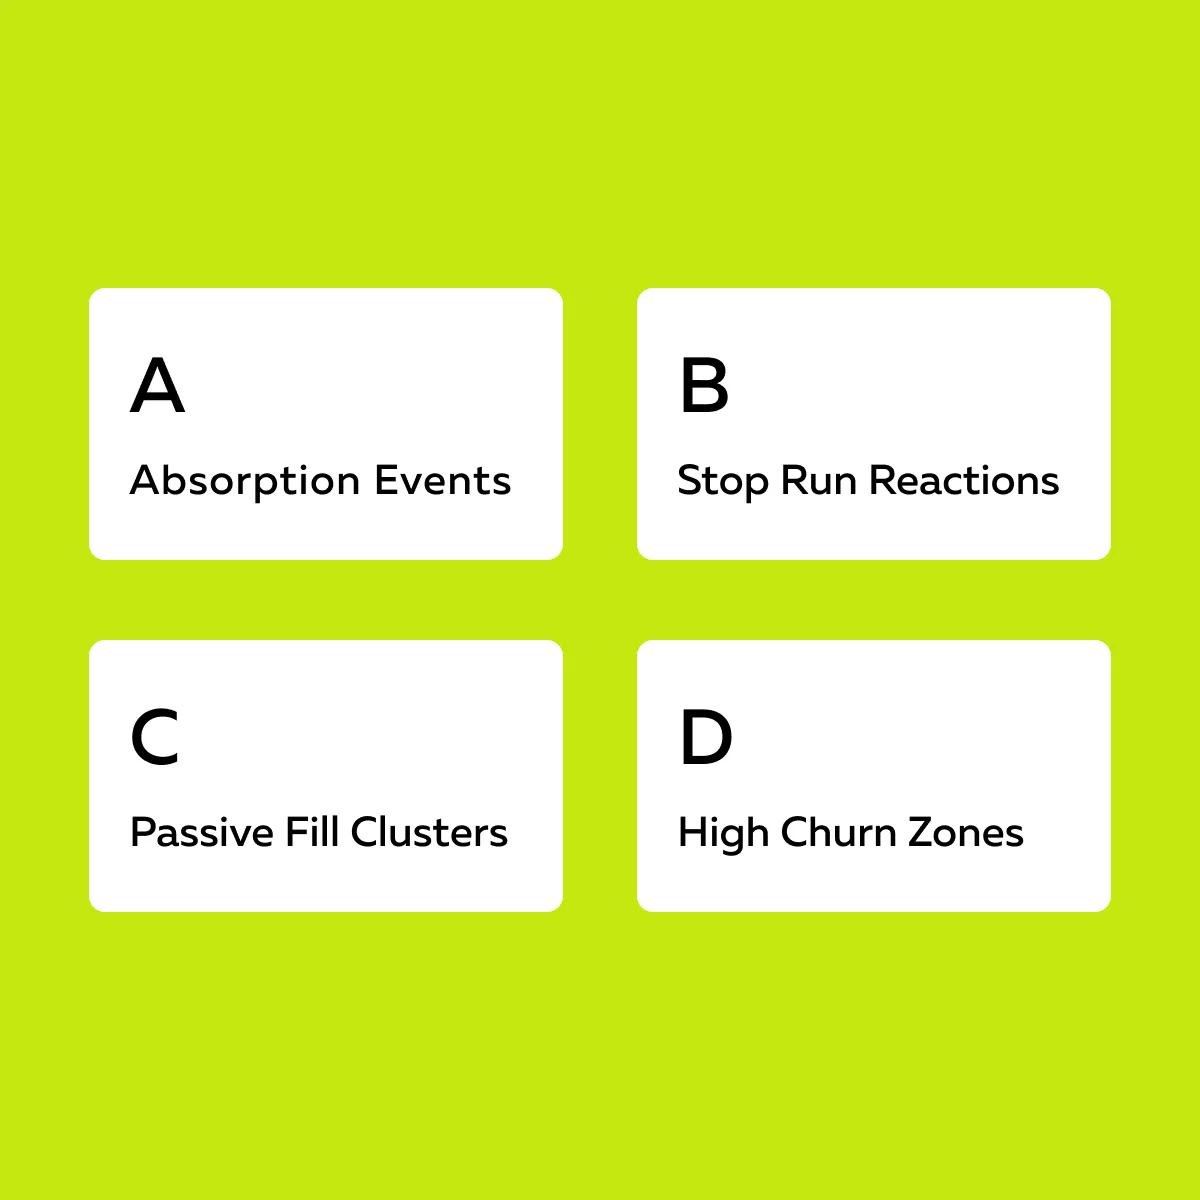
As a trader, when analyzing these zones, you can read the real intentions behind price action (not just chart patterns). Below are four major liquidity zones that the market usually remembers:
1. Absorption Events
An absorption event happens when strong buying or selling pressure hits the market, yet the price barely moves. But why does this happen? That’s because large passive orders are resting in the order book. They are absorbing the flow! If we make it simpler:
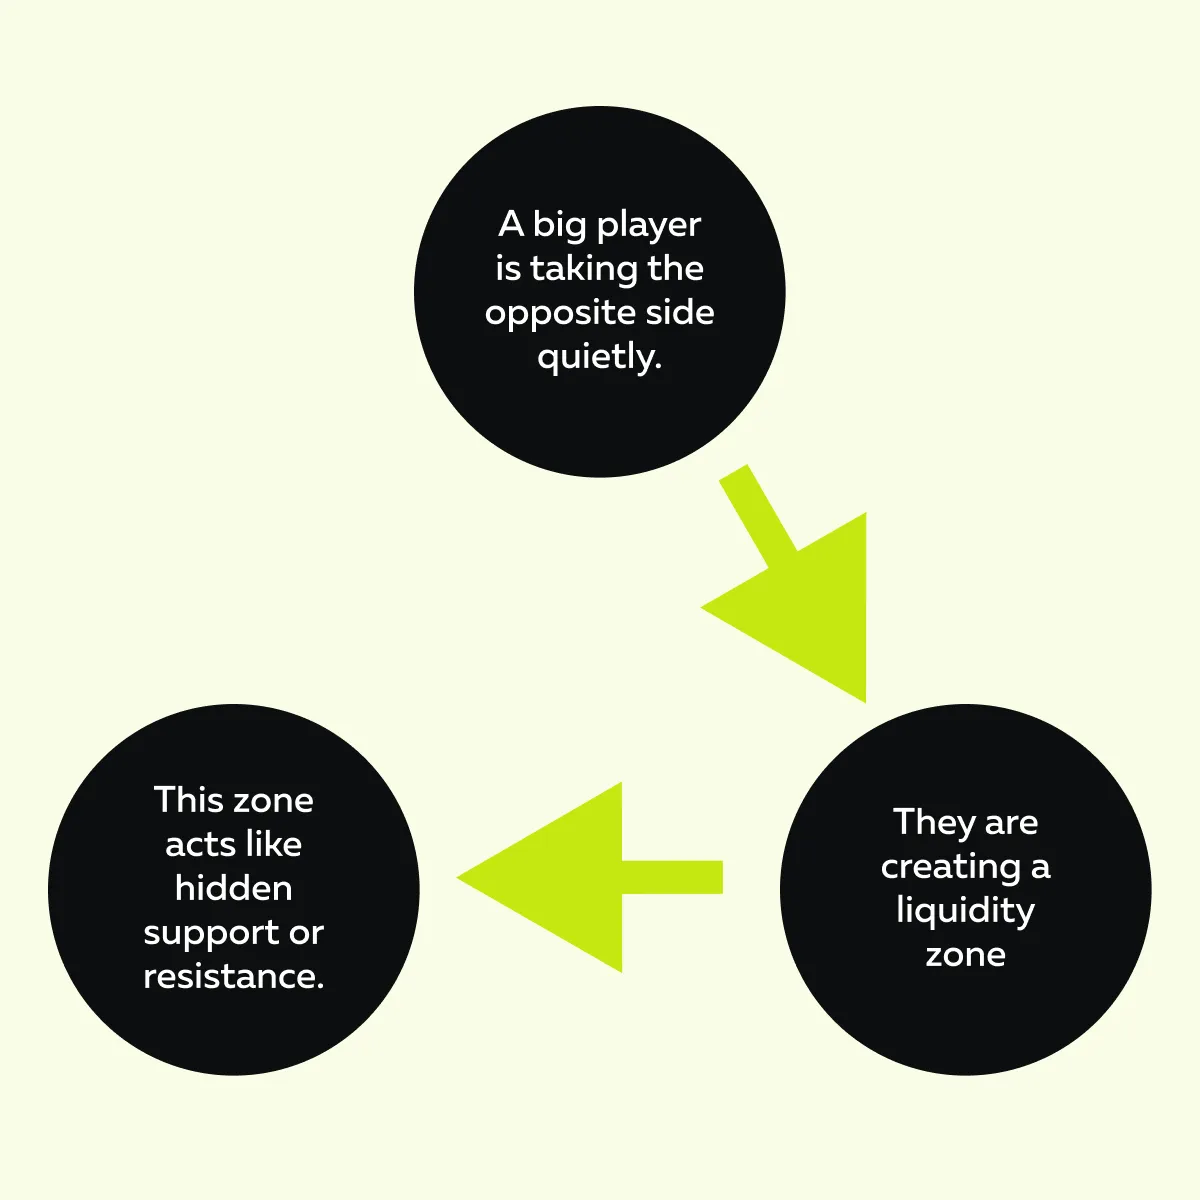
Now, realize that these areas build historical liquidity. They reveal where prominent participants defended or entered positions. Later, when prices return to these zones, traders expect a similar reaction, which could be:
- Another defense,
- A bounce, or
- A clear breakout (if that zone no longer holds).
Okay, but how can I spot this? On visual tools like Bookmap, you can see absorption like a cluster of bright dots (heavy trades). These dots accumulate at one price level with little price movement. That’s the footprint of a smart player and a zone the market will likely remember!
2. Stop Run Extremes
A stop run extreme happens when the price suddenly pushes:
- Above a swing high,
or
- Below a swing low.
Pushing the price this way triggers a cluster of stop-loss orders! This flood of orders creates a quick burst of liquidity. This burst is usually followed by a sharp reversal (particularly if there’s no real buying or selling interest behind the move).
Now again, these are moments of order flow memory. The market remembers where traders were trapped or stopped out. Such zones become emotional landmarks or “pain points” in these zones since traders hesitate or adjust their behavior the next time the price approaches.
Stop Run Level = Market Memory.
The level where the stop run happened often becomes a liquidity zone of market memory. Let’s see how:
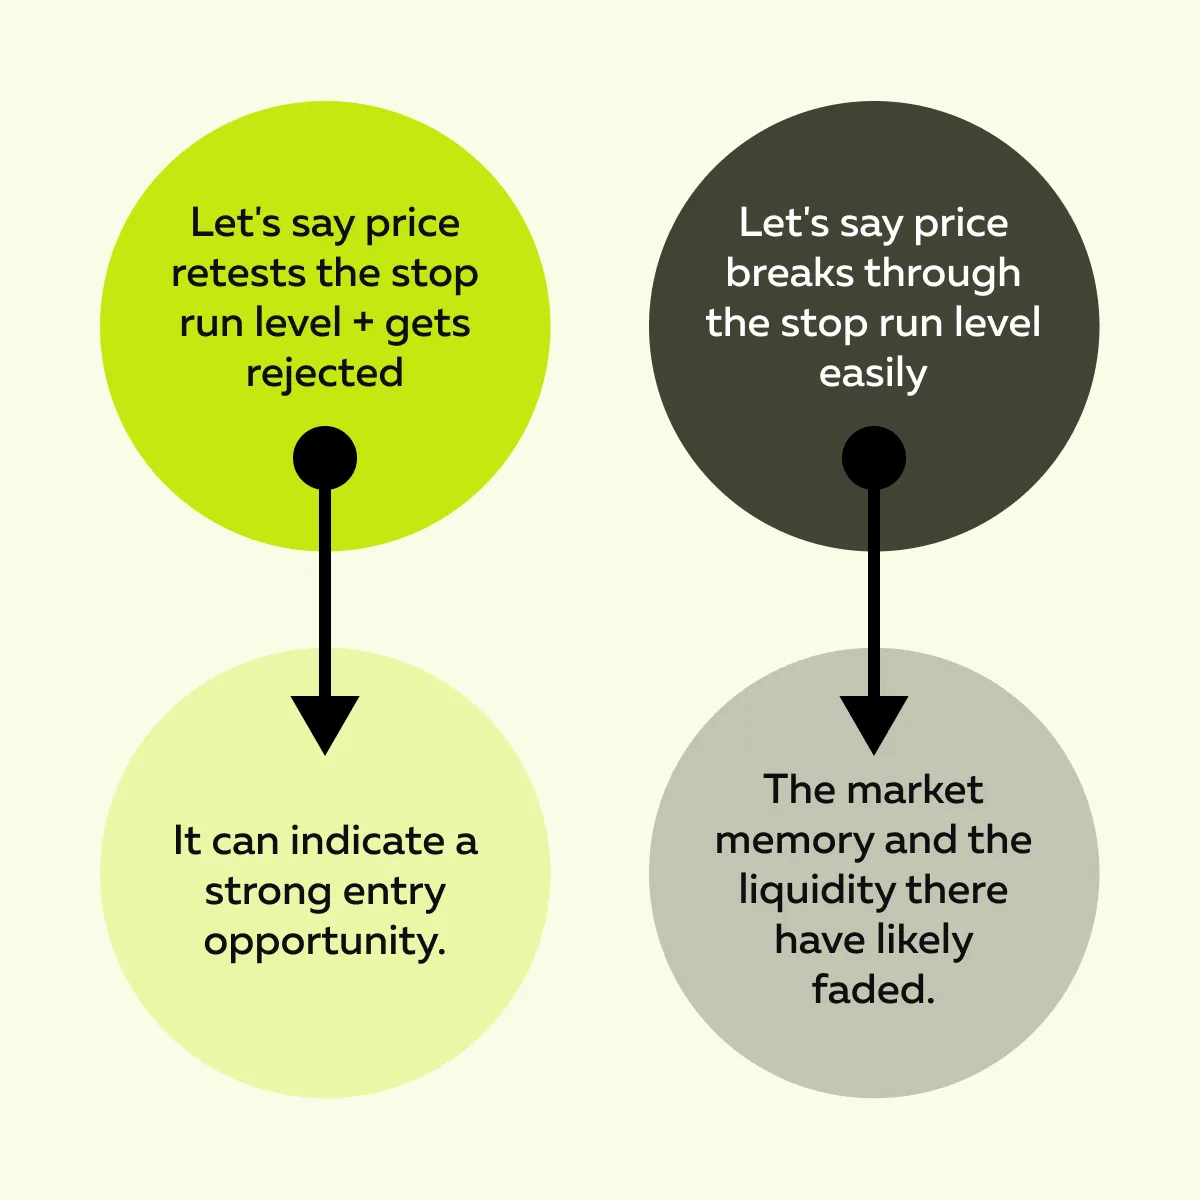
For example, let’s say price breaks above yesterday’s high. However, it quickly reverses. Now, that failed breakout becomes a key remembered zone.
3. Hidden Liquidity Zones (Icebergs and Passive Fills)
A hidden liquidity zone forms when big players place large orders but break them into smaller, less noticeable pieces. These pieces are often called iceberg orders. But why are orders placed this way? The goal is to hide the actual size and intent. You won’t see these as large resting orders. However, their presence can be sensed through order flow behavior.
Iceberg Orders Lead to Absorption
In these zones, you will notice prices hitting the same level repeatedly with strong buying or selling, yet not moving much. Now, that’s a sign of absorption! In these areas, hidden liquidity quietly takes the opposite side.
Even though these zones aren’t apparent on standard charts, they still build market memory. Later, when the price returns to these levels, it often reacts again. Why? That’s because historical liquidity still influences trader behavior.
Again, you can see these zones on Bookmap. They appear as clusters of aggressive dots at one price. On our market analysis tool, Bookmap, you can clearly observe constant fills without much movement, a classic signal of iceberg activity.
4. High Volume Nodes and Churn Areas
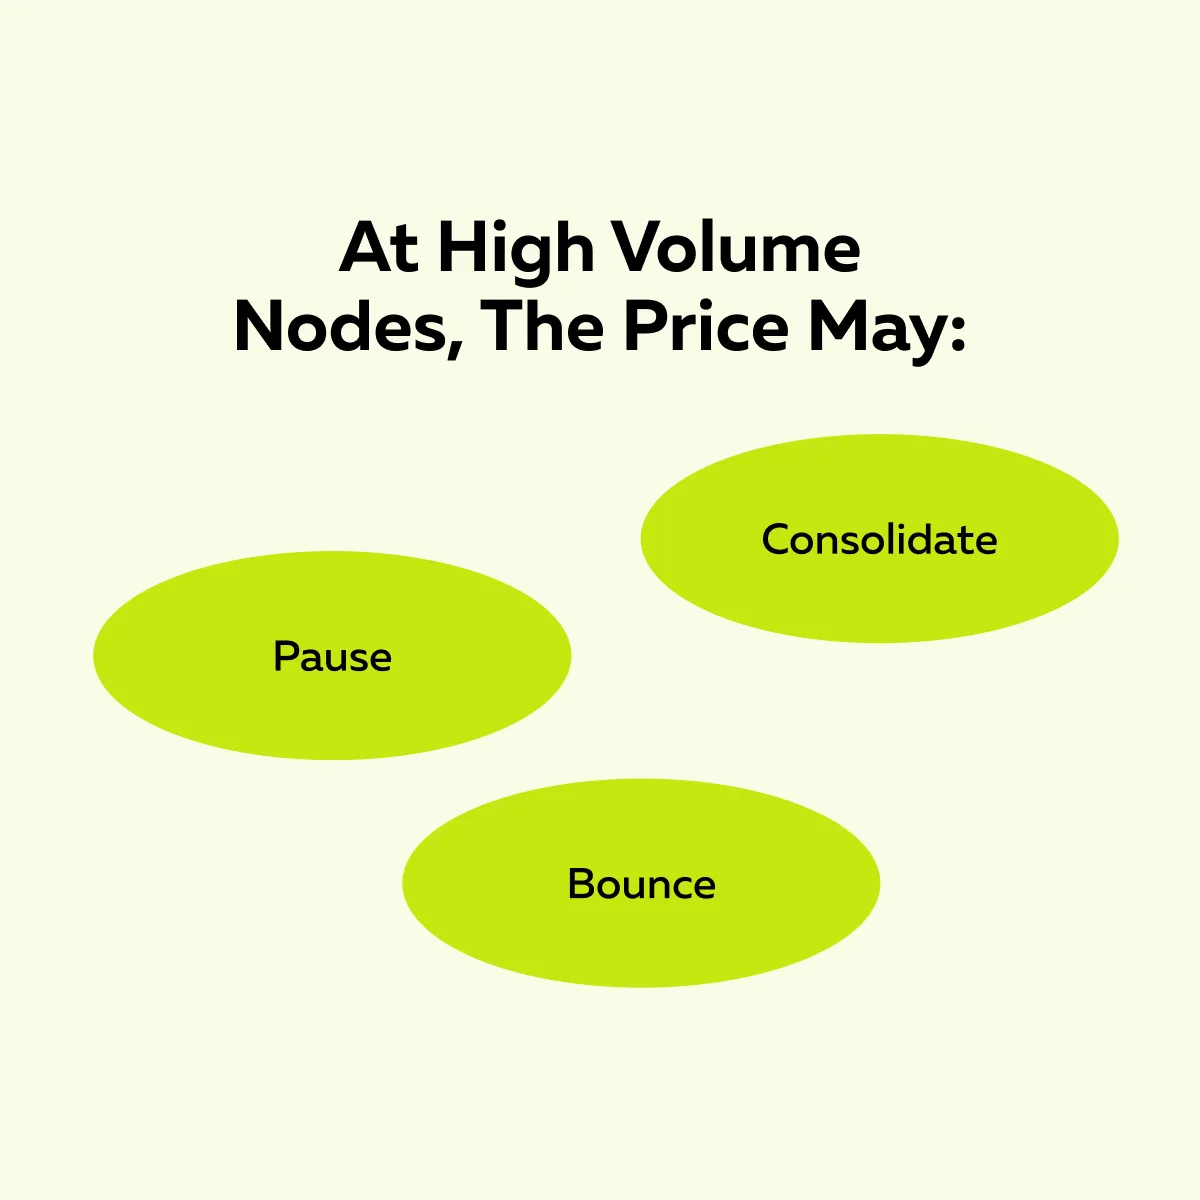
High-volume nodes (churn areas) are price zones where a lot of trading occurs. These represent “value areas” as the market saw those prices as fair and balanced between buyers and sellers. Since so much historical liquidity was exchanged there, these zones develop strong market memory.
How does it impact price?
When the market becomes uncertain or loses clear direction, the price often drifts back to these areas (almost like a magnet). That’s why traders watch these liquidity zones closely because they usually slow down sharp moves.
That’s why many traders also place new positions around these levels. They expect the market to “remember” the balance that once existed there.
Why Market Memory Alters Trader Behavior
Do you think market memory only shapes charts? Nope! It significantly influences the decisions of pro traders. Most veterans remember what happened at key liquidity zones, and that memory changes how they act the next time price visits those areas.
Let’s understand through an example.
- Let’s assume a stop run previously triggered losses.
- Now, traders may exit early or avoid holding positions near that level again.
- If a price level bounced before, many might try to fade it (expecting history to repeat).
This creates a behavioral feedback loop, where collective memory turns past reactions into future setups.
Even Institutions and Algorithms Track These Patterns
Yes, many automated systems analyze:
- Historical liquidity,
- High-volume nodes, and
- Failed breakout zones.
Such an analysis lets them identify high-probability areas for entries or exits. Thus, it’s not superstition. Instead, it is brought about by a combination of mathematics and memory. By using order flow memory, as a trader, you can assess how likely a level is to hold or break.
How to Use Historical Liquidity Zones in Your Trading Strategy
For most, trading is just about spotting patterns. This practice is wrong! Trading is about understanding where and why the market reacted. The answers to these questions can be obtained by studying historical liquidity zones. By spotting them, you can learn:
By identifying these areas, you can better plan your entries, exits, and risk levels.
Mark Liquidity Zones, Not Just Price Levels
As a tip, don’t limit your charts to:
- Swing highs,
- Swing lows, or
- Session extremes.
Instead, map out true liquidity zones! Try to identify areas where actual trading activity left a footprint. These zones usually witness:
As a trader, note that these areas mark where real order flow occurred (not just where candles moved).
Watch the Reaction, Not the Memory Alone
A price revisit to a market memory zone is an automatic trade setup = This is a wrong assumption! It might be true, but you need confirmation. And to get this confirmation, you should observe:
- How do volume and order flow behave this time?
- Are passive players defending again?
- Is new liquidity appearing, or has interest faded?
Clues like stalling volume, rejection wicks, or fresh absorption show whether the memory is still active or has lost relevance.
Replay to Build Your Own Visual Memory
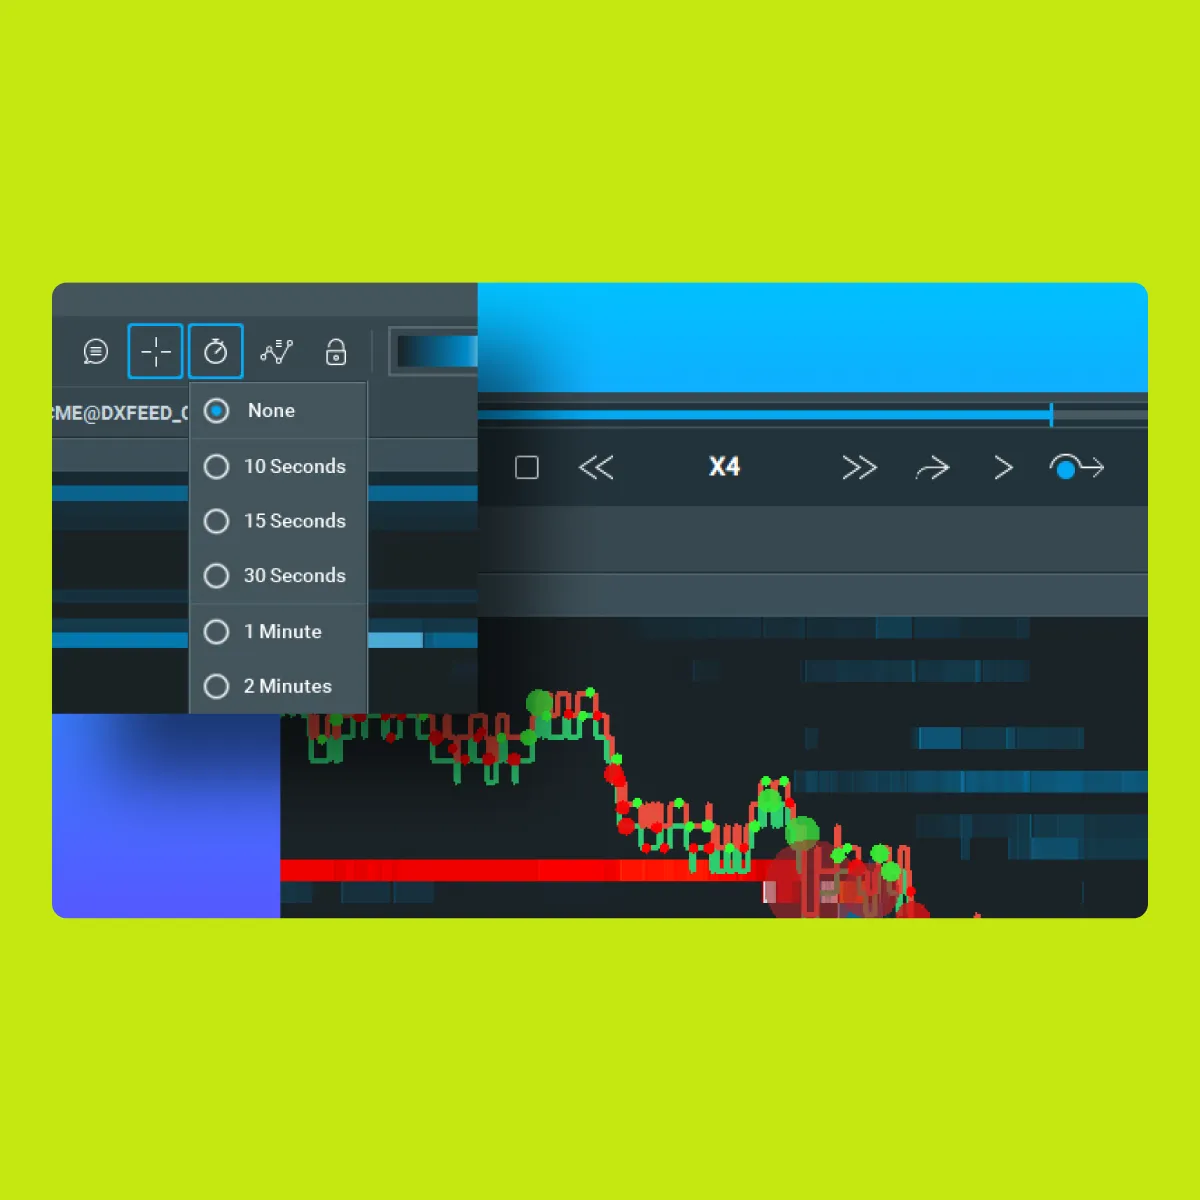
Always use replay tools (like Bookmap’s session replay) to study past sessions. While replaying, you must watch:
- How does the price react when it returns to old liquidity zones?
- Did traders defend them, or ignore them?
- Where did historical liquidity form, and how has it evolved?
Gradually, this builds your own intuitive sense of order flow memory. Replay past sessions with Bookmap to spot where price memory really forms.
Conclusion
After reading this article, you must understand that historical liquidity and market memory can give you valuable context. But yes, it still doesn’t guarantee how the price will move!
By identifying these liquidity zones, you can spot where real trading activity occurred and influenced trader reactions in the past. You can also anticipate potential support, resistance, or inflection points.
However, there is a small problem! If the current market structure brings fresh demand or supply, even well-established memory zones can fail. Conversely, if traders behave as they did previously and liquidity returns to the zone, these areas often hold and influence the price again.
So, what should you, as a trader, do? Don’t focus on just where memory exists! Instead, try to read the real-time reaction. Watch volume, order flow, and absorption to confirm whether a zone is alive. Advanced real-time market analysis tools, like Bookmap, make this intuitive! Using Bookmap, you can:
- Visualize historical liquidity,
- Spot memory zones, and
- Understand market behavior (at a deeper level).
Use Bookmap to identify key absorption zones that act as future reversal points.
FAQs
1. What is a liquidity zone in trading?
A liquidity zone is a price area where substantial trading has happened before. This price level has already witnessed big buy or sell orders. Thinking about how these zones develop? These areas form through:
- Absorption,
- Stop runs, and
- High-volume activity.
For you, these levels matter as most traders react when the price returns to these zones. Thus, they are essential for future trading decisions.
2. Is market memory the same as support and resistance?
Not exactly! Support and resistance are often drawn from past highs, lows, or patterns. Usually, market memory comes from real trading activity, where big players bought, sold, or triggered stops.
Thus, it’s more dynamic and reflects actual order flow. So, price may react to these zones even if traditional lines aren’t there!
3. How do I identify historical liquidity zones on Bookmap?
On Bookmap, you can look for areas where:
- Aggressive volume hit, but price barely moved (absorption),
- Stop runs triggered reversals, and
- Large resting orders interacted with the price.
Bookmap also offers advanced features, like a heatmap and replay mode. Using them, you can easily see these zones and understand market memory. Also, you can mark them for future reference.
4. Why does price return to previous liquidity zones?
Price often revisits these zones because they show areas of past balance or imbalance. Additionally, most traders remember what happened in these zones, and institutions may have unfinished orders there.
That’s why these historical liquidity zones influence behaviour. They act like magnets where price usually pauses, bounces, or reverses.
5. Do memory zones always hold?
No! Market memory gives context, not certainty. Price can break through old zones if strong pressure is created by:
- New events,
- News, or
- Market forces.
The ideal approach? Don’t assume it will always hold. Instead, watch how the price reacts in the zone. Check whether it bounces, stalls, or slices through, and then form your trading approach.
Sign Up Now