See tape more clearly in real time.
Compare plans to access deeper market visibility for tape.
Trading Basics
January 22, 2026
SHARE
What’s Inside the Tape? How to Read Trade Size, Speed, and Aggression
Charts show “what happened,” but the tape shows “who made it happen”. In 2025, tape reading in trading is like listening to the market’s heartbeat. That’s because behind every candle or price bar, there is an ongoing battle between buyers and sellers. Usually, their trade size, order flow speed, and aggression influence the price action in real-time.
Here’s the catch: Most traders just stare at charts. They skip tape reading and miss what’s really driving those price moves. Want to avoid this rookie mistake?
Read this article to learn what tape reading is, how to spot big players, and how to detect when control is changing. From identifying hidden orders to understanding trade size and aggression, you’ll also see why tools like Bookmap make reading the tape visual and intuitive. Let’s begin.
What Is the Tape in Trading?
In trading, the tape refers to the “Time & Sales feed”. It is a live stream that shows every trade happening in the market. It displays key details like:
- The timestamp,
- Price, and
- Trade size.
Simply put, it lets you see the actual flow of buy and sell orders as they occur. Okay, any benefit of reading the tape? Yes, you can spot real-time shifts in demand and supply before the chart fully reacts.
Traditionally, tape reading started in the days of pit trading, when traders watched the ticker tape to sense market behavior. Even today, reading the tape is just as valuable. Why? Because it tells you what’s really driving prices beneath the surface.
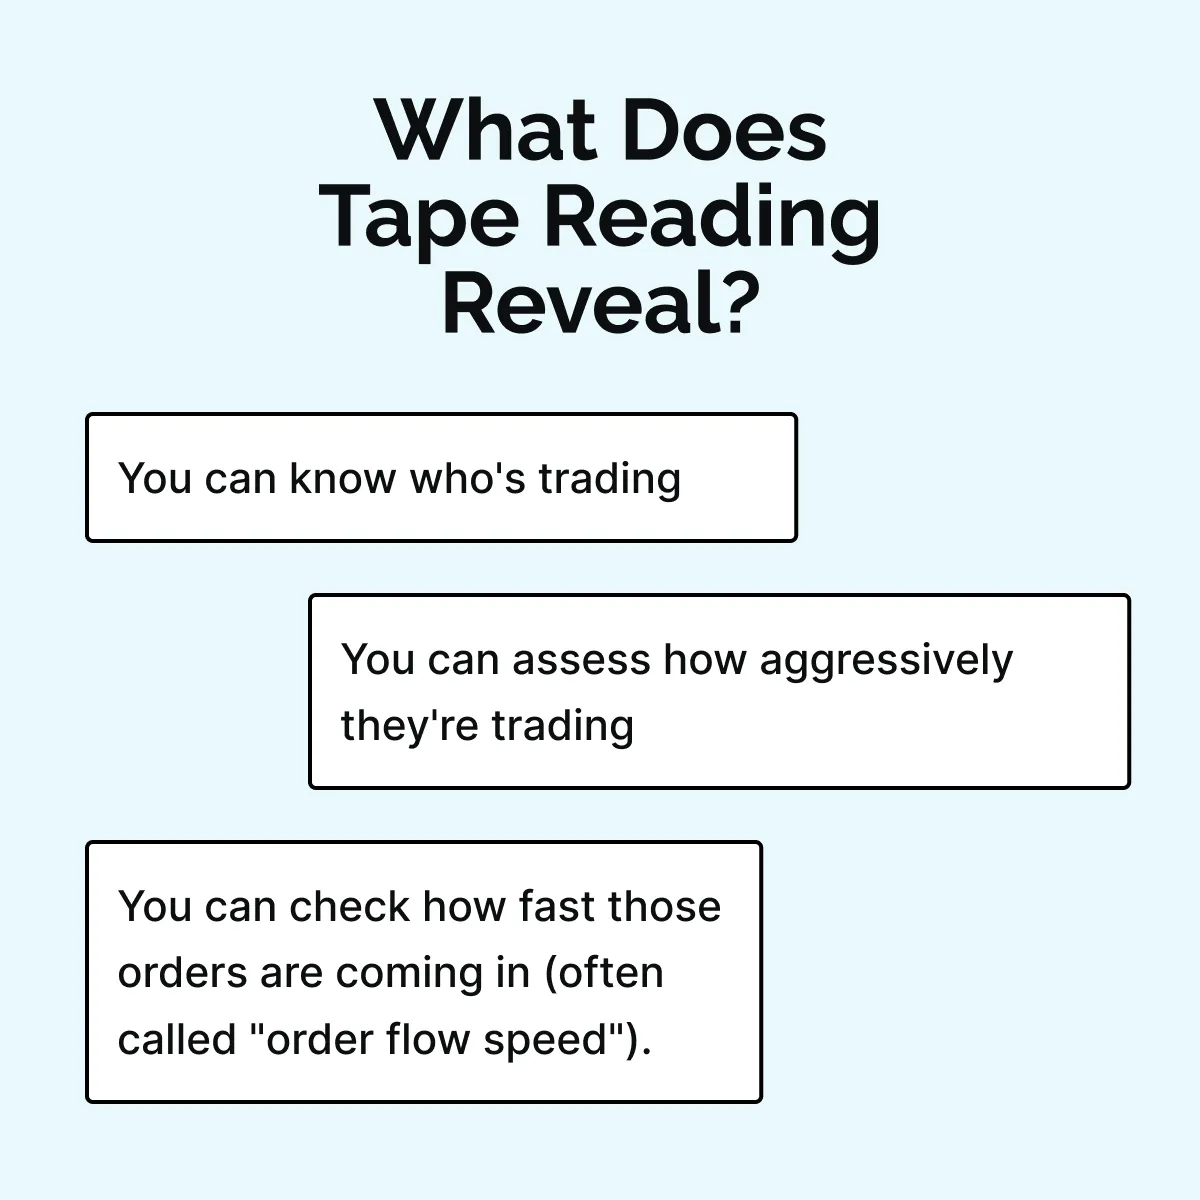
Reading the tape helps you:
- Detect hidden buying or selling pressure,
- Judge trade size and aggression, and
- Identify moments when a breakout looks genuine or when momentum is fading.
Trade Size: Identifying Big Players
When you read the tape, “trade size” is one of the most important clues to understand who’s really moving the market. Bigger trades usually represent institutional players or traders with strong conviction. For example,
- Let’s say a single 200-lot order hits the offer.
- Now, it tells you much more than 20 small trades scattered across different prices.
- This 200-lot order shows trade size and aggression.
How to Spot Large Players?
You can start using sophisticated market analysis tools, such as Bookmap, which visually show large trades as bigger dots on the chart. You can even filter it to display only trades above a certain size. This makes it easier to track heavy activity.
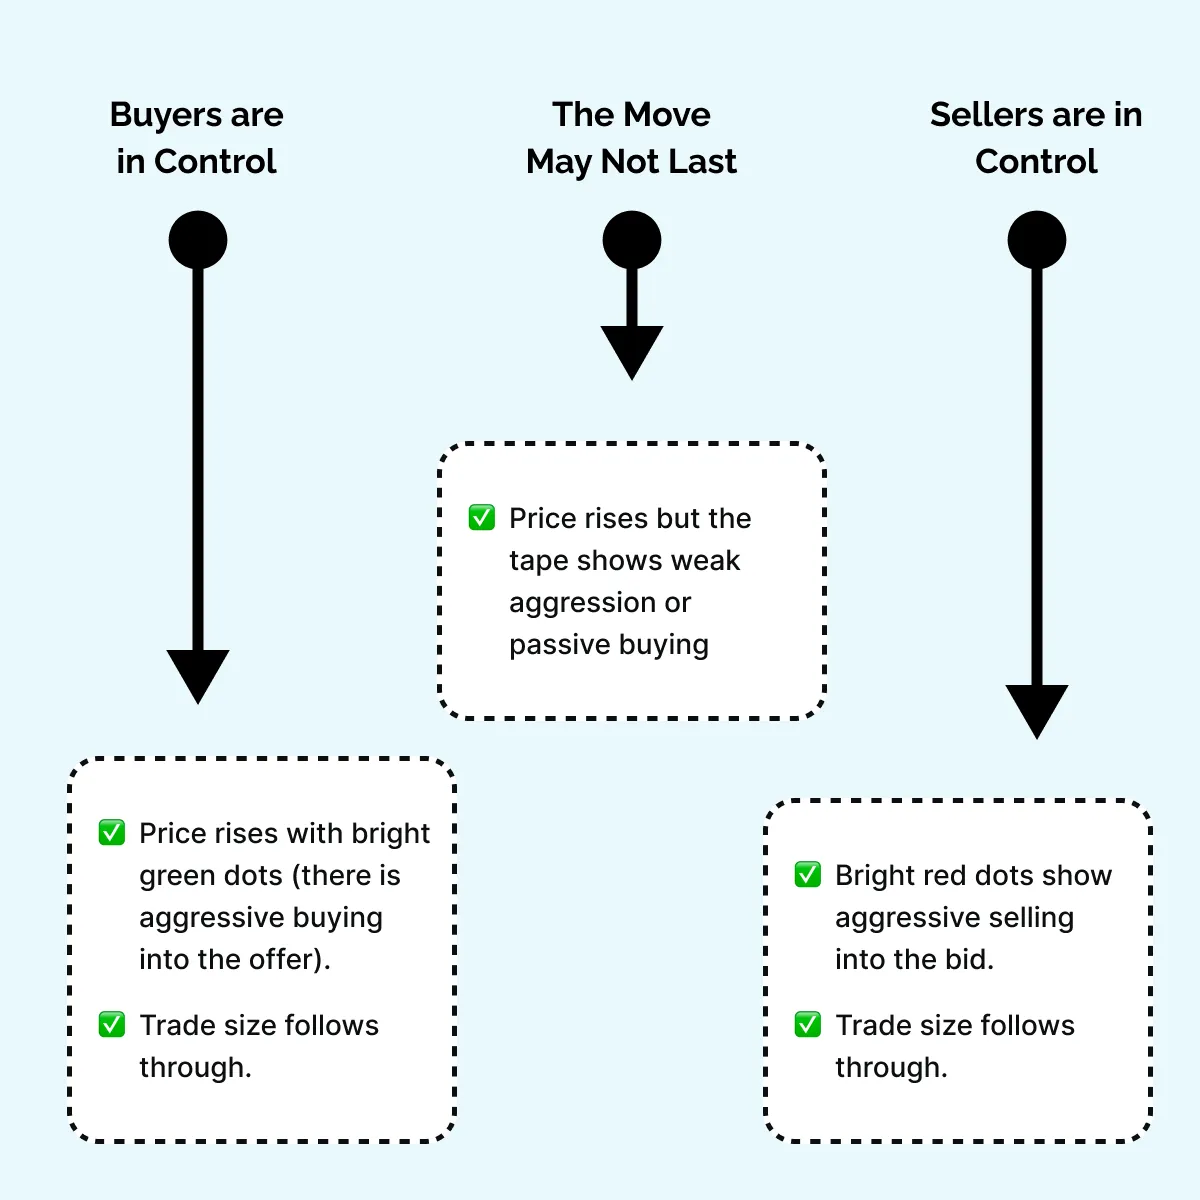
Now, to spot signs of aggressive buying or selling, you can specifically look for these two patterns:
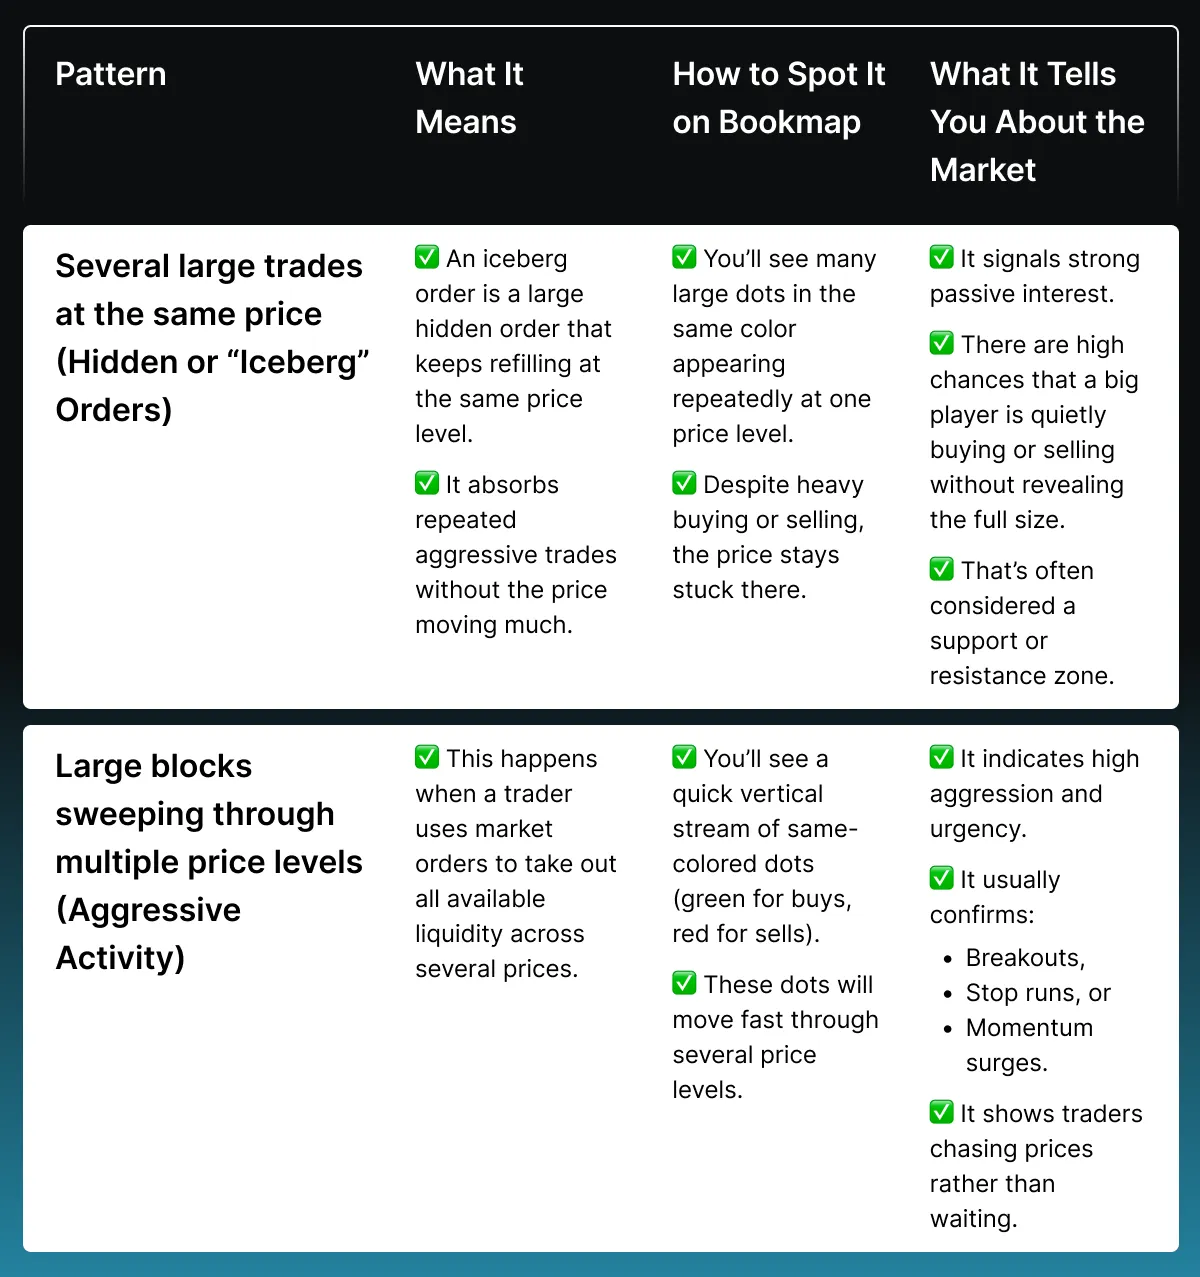
So, what did you learn? If big trades keep hitting the bid, it signals genuine selling pressure. But if large orders quietly absorb aggressive buyers without pushing prices higher, it might indicate a trap or passive selling. Start reading the tape with more clarity—compare Bookmap packages now.
Speed of the Tape: Reading Tempo and Urgency

When reading the tape, there is something you just can’t miss! And that’s understanding “order flow speed”. It shows how quickly trades are hitting the market. Let’s break it down:
What the Speed Reveals
The speed of the tape indicates how active, urgent, or calm the market feels in real time. Below are two common cases you might observe in the market:
| Case I: The Tape Suddenly Accelerates + Trades Coming in at Rapid Fire Pace | Case II: Tape Slows Down + Trades Come in at a Steady Pace |
It signals that something is about to happen:
This quick burst of trading shows urgency and conviction. |
It usually means the market is:
or
There are high chances that automated systems are dominating the market, and price moves are shallow. |
How to Read the Tape in Trading Using Bookmap
On Bookmap, you can see the order flow speed in real-time. Let’s say:
- You watched a flurry of dots or rapid-fire trades at one price.
- Now, this means urgency is building.
Additionally, you can literally watch the market “get faster” as interest grows on Bookmap. This observation allows you to anticipate momentum before the breakout even completes.
How do traders even refine this further? Several Bookmap users:
- Set audio alerts
or
- Use velocity indicators.
They highlight bursts of activity, such as stops being triggered or iceberg orders being hit. These features give you a head start on shifts in market tone.
Tape Tempo and Market Regimes
The tape tempo behaves differently depending on the market environment. Let’s see how this happens through three different scenarios:
| Scenario I: Fast Tape in Low Liquidity | Scenario II: Fast Tape in High Liquidity | Scenario III: Slow Tape After a Big Move |
|
|
and
|
So, is tape reading in trading just about watching prices? Nope! Now, you know, it is about sensing tempo, urgency, and intent. The speed of the tape helps you stay one step ahead of momentum before it becomes obvious on the chart.
Aggression: Who’s in Control?
When reading the tape, do you know what the biggest clue to market direction is? It is “trade aggression”. It shows you who’s taking control of the order flow right now: buyers or sellers. Okay, but how can I spot it? Aggression is revealed by the type of order being used. Check out the two market situations below:
| Situation I: Aggressive Buyers Use Market Orders to Lift the Offer | Situation II: Aggressive Sellers Use Market Orders to Hit the Bid |
|
|
By learning how to read the tape in trading, you can see this battle unfold in real time. The tape shows whether buyers are chasing higher prices or sellers are panicking to exit.
What are “Signs of Control” in the Tape?
On Bookmap, you can identify who’s dominating by watching color, size, and order flow speed. Let’s see how you can make this observation:
Bookmap turns the tape into a real-time visual map—see trade size, speed, and aggression instantly.
How to Use Trade Aggression to Anticipate Turns
Aggression doesn’t just tell you who’s in charge; it also lets you predict when control might change. There are three possible market scenarios you must know:
| Scenario I: Aggressive Move into High Liquidity + Sudden Stall | Scenario II: Strong Aggression with No Price Progress | Scenario III: Aggressive Selling into A Thin Book |
| It signals buyers or sellers running out of steam—potential exhaustion. | It shows “absorption,” which means large players are quietly taking the other side. | It represents the risk of slippage or a stop run. In this situation, prices can drop sharply because there isn’t much support below. |
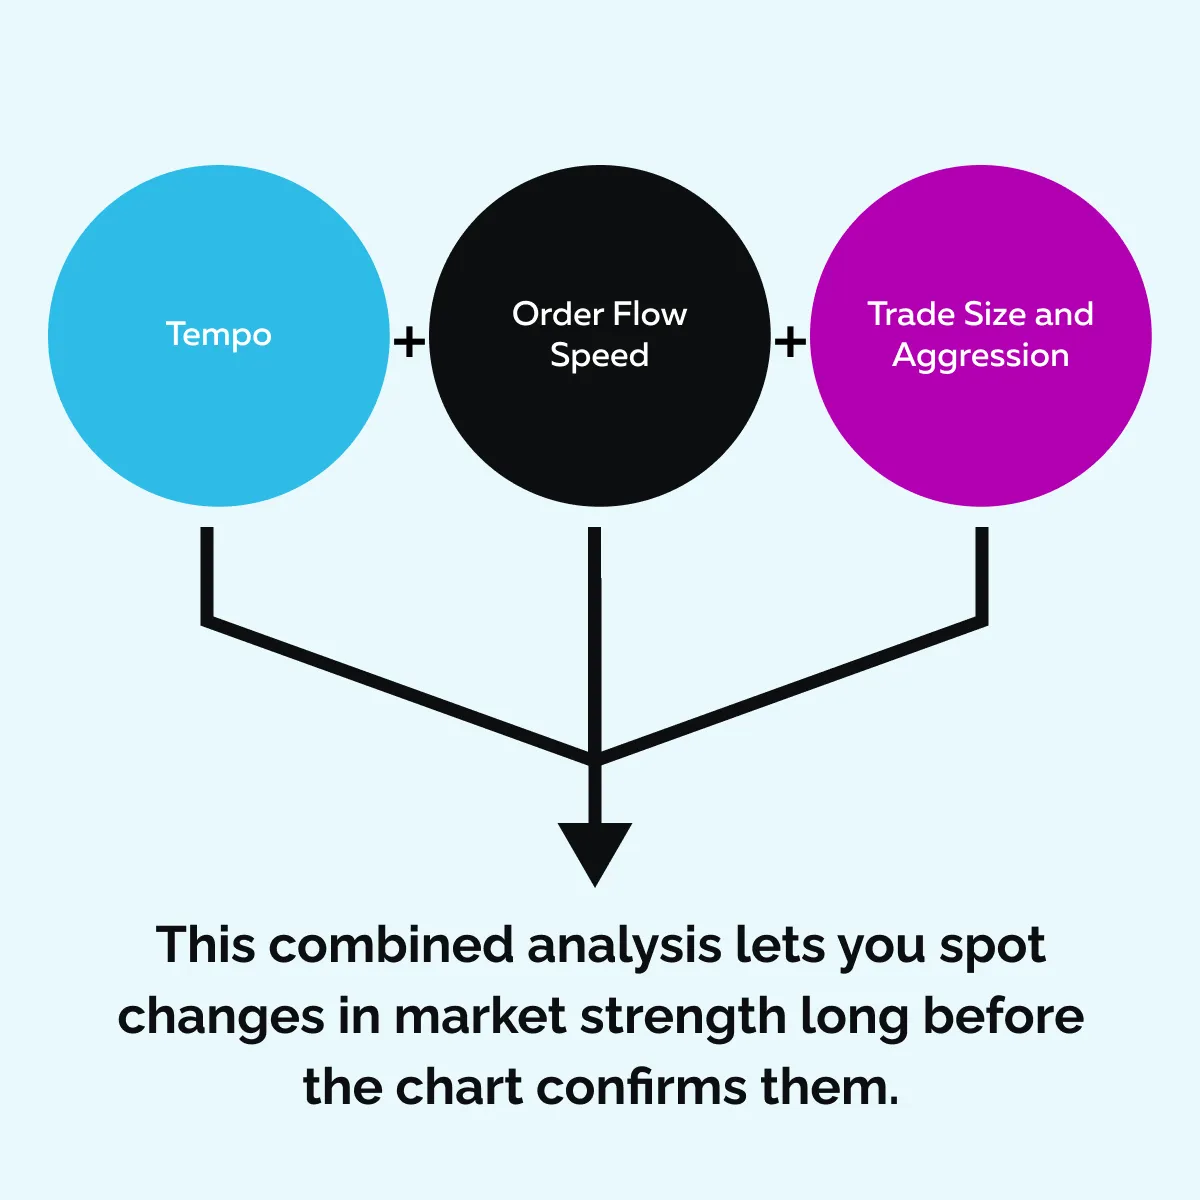
So, tape reading explained through aggression is about recognizing intent and control in real time. As a trader, you can make a combined analysis as follows:
Real Examples: Tape Scenarios in Bookmap
To truly understand tape reading, read the following three examples to know how different tape reading scenarios look in real market conditions:
Example 1: Breakout Confirmed by Aggressive Buy Tape
-
- Let’s say price stalls at a resistance level.
- It’s not moving yet, but suddenly, you notice aggressive buying on the tape.
- Large and fast prints appear as bright green dots in Bookmap.
- The orders stack and sweep through several price levels.
This combination of trade size, aggression, and rising order flow speed signals that big buyers are stepping in. Now, when price lifts through a liquidity wall, it confirms the breakout.
Example 2: False Move Exposed by the Tape
- Let’s say the price breaks below support.
- At first glance, it looks like a breakdown.
- But the tape is slow, and trade sizes are small.
- Sellers aren’t aggressive.
- Bookmap displays only a few small red dots coming in.
This weak order flow speed shows there’s no real conviction behind the move. As a result, the price bounces back quickly, proving it was a false move rather than true selling pressure.
Example 3: Hidden Seller Revealed by Absorption Pattern
- Let’s assume that aggressive buyers are hitting the offer repeatedly.
- There are lots of green prints, yet the price refuses to climb.
- On Bookmap, this appears as a wall of consistent size being absorbed at the same price level, with large red dots holding firm.
- Now, that’s a clear sign of a hidden or passive seller.
- It shows that someone with deep liquidity is absorbing all that buying pressure.
This absorption pattern warns you that, despite the aggression, control may still rest with the seller.
Why Visualizing the Tape Beats Reading Numbers
Traditional Time & Sales (T&S) windows show every trade’s price, size, and time. However, in today’s modern markets, that data scrolls by too quickly to interpret. Unless you’re extremely experienced, it’s difficult to:
- Track patterns
or
- Sense changes in order flow speed just by reading digits.
Additionally, you can’t easily replay the action or spot shifts in trade size and aggression. The usual result? You often miss the bigger picture!
“Visual Tape Reading” on Bookmap is Your Solution
When using Bookmap, you no longer need to start with endless numbers. You can see trades displayed visually with:
- Color,
- Size, and
Timing.
Everything is mapped out in real time. Let’s see how:
This visual approach makes reading the tape much easier. You can instantly spot when:
- Tempo speeds up,
- Aggression flips sides, or
- Big players start clustering orders.
The trader’s advantage? There is less decision fatigue. You can make quick reactions and execute trades more confidently.
Conclusion
So, now you know that tape reading isn’t a lost art. It has just evolved with modern technology. Through tape reading, you can see the story behind every price move in real-time. Some common patterns you can observe are:
- Trade size,
- Order flow speed, and
- Aggression.
Their recognition allows you to understand when buyers or sellers truly hold control, when momentum builds, or when a move loses strength.
Want to make tape reading easier and develop a genuine edge? Stop guessing based on charts alone! Start using visual tools like Bookmap. They let you instantly spot shifts in tempo, aggression, and liquidity. Want to see the tape visualized? Explore Bookmap Global+ features.
FAQs
1. What is the tape in trading?
The tape is a live feed called Time & Sales. It displays every trade happening in the market with important data, such as the price, time, and trade size. By analysing the tape and data, traders can see real buying and selling activity as it unfolds. It can also reveal the forces influencing price changes beneath the chart.
2. How does trade size affect price action?
Be aware that large trades usually come from institutions or professional traders with strong conviction. When big trades hit the market, they can push prices up or down. However, if the price doesn’t move despite large trades, it may signal that hidden players are absorbing the flow.
3. Why is trade speed important?
Trade speed represents how fast orders hit the market. It shows urgency! As a trader, you must note that:
- A sudden burst in speed often hints at a breakout or momentum shift,
whereas
- Slow trading usually means the market is calm or stuck in a range.
4. How can I identify aggression on the tape?
Aggression on the tape reveals who is dominating the market: buyers or sellers. Usually, aggressive buyers don’t wait for a cheaper price. They use market orders to buy immediately from sellers. This shows strong buying pressure. In contrast, aggressive sellers do the opposite. They use market orders to sell quickly, even at a lower price. This shows strong selling pressure.
On Bookmap, aggression is easy to spot:
- Green dots = aggressive buying (buyers lifting the offer).
- Red dots = aggressive selling (sellers hitting the bid).
So, when you see a flurry of green dots, buyers are in control. In contrast, when you see lots of red dots, sellers are taking charge. This allows you to understand who’s dominating the market in real time.
5. Is Bookmap better than Time & Sales?
Yes, because Bookmap lets you perform visual tape reading. Using it, you can instantly see patterns like:
- Absorption,
- Stop runs, and
- Aggressive trades.
This makes understanding market activity easier and faster, providing traders with a critical edge in real time.
Sign Up Now