See support resistance more clearly in real time.
Compare plans to access deeper market visibility for support resistance.
Trading Basics
February 12, 2026
SHARE
Why Some Support and Resistance Levels Never Hold
For most traders, support and resistance levels are fixed zones that the price is “supposed” to respect. But what’s the reality? Those levels will be respected only when the market previously accepted them.
Let’s assume price rushed through an area when volume was thin, or when one side dominated. Now, that level was “never real” to begin with. Experienced something similar? Did you also spot a clean level that later failed?
Remember that support and resistance levels are outcomes of past auctions. Read this article to learn what support and resistance truly are and how liquidity behaves around strong and weak levels. You will also understand how order flow reveals failure before the chart does, and why broken support often turns into resistance. Let’s begin.
Support and Resistance Are Outcomes, Not Causes
Support and resistance are lines formed by how trading actually occurred at a given level. A price level becomes meaningful only when the market has worked there. Thus, support and resistance levels form because buyers and sellers spent real time doing business at that price.
Realize that a level hold occurs when these three things have happened in the past:
| First, Price Spent Time Trading There | Second, Volume Accumulated Through Two-Sided Participation. | Third, Both Sides Accepted The Price. |
|
|
|
When these conditions exist, support and resistance levels are developed. Okay, but what happens when these conditions are missing? The level is weak. Usually, in such situations, you will observe that:
- Price moved through quickly,
- Volume was thin, and
- Only one side was active.
Always remember that weak levels break easily. This happens because the market never truly agreed on that price in the first place.
Why “Obvious” Levels Often Fail
Levels that look obvious on a chart usually attract the exact expectations from many traders. Everyone sees the same support and resistance levels, and many plan trades around them. This “crowding” changes how the market behaves.
When a level becomes too apparent, three common things happen. Let’s check them:
So, you must keep an eye out for these three shifts:
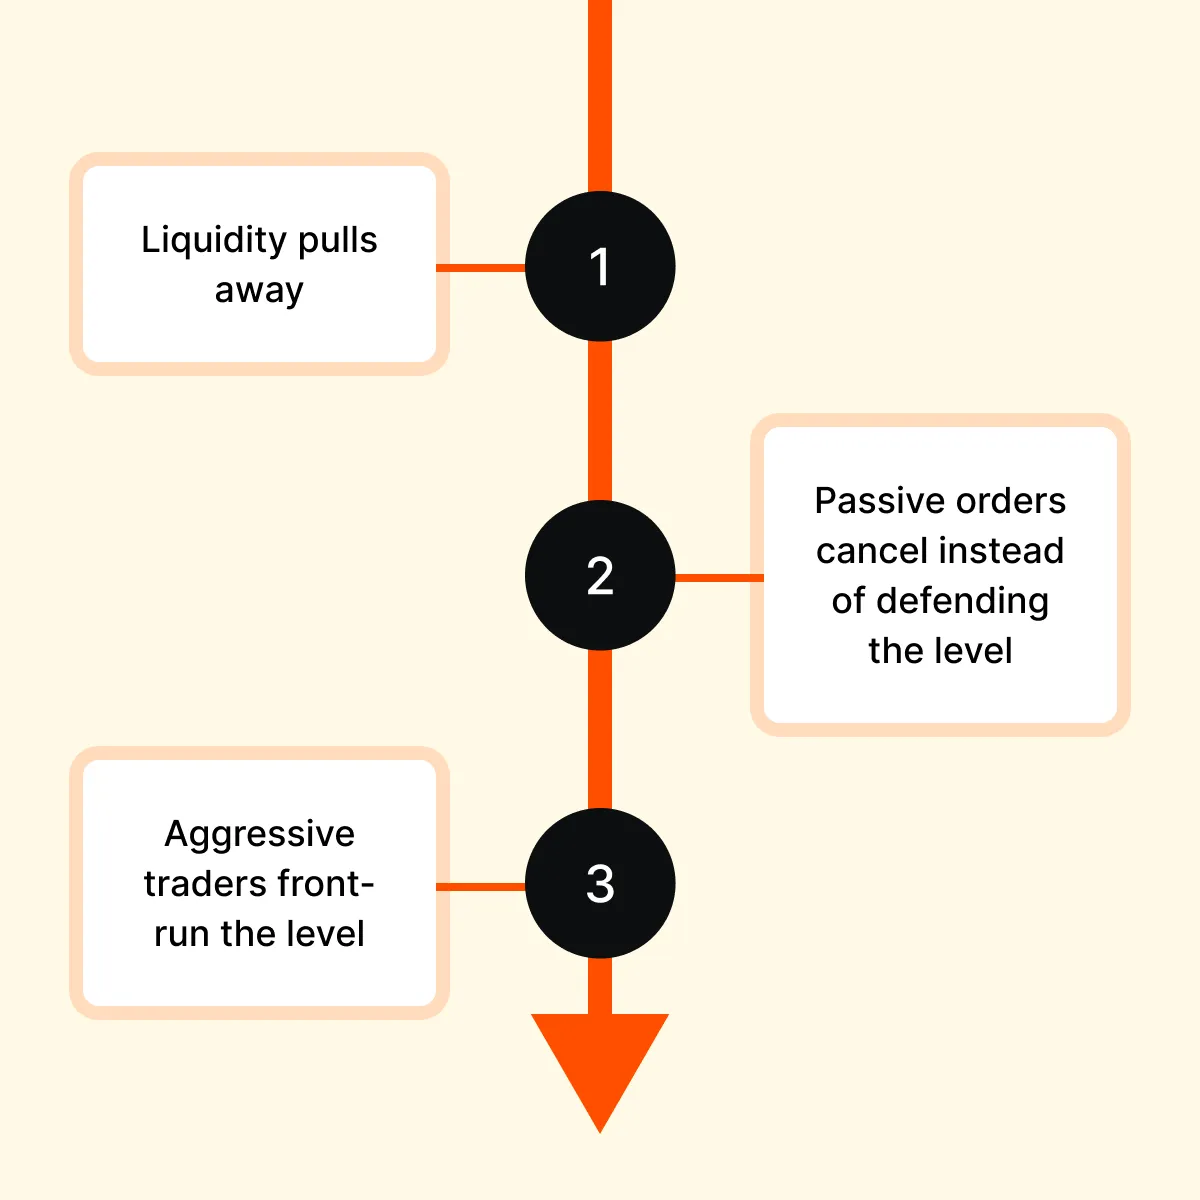
- First, liquidity pulls away as the price approaches. Large participants don’t want to show their orders where everyone is watching. Hence, they step back.
- Second, passive orders are canceled. They do not defend the level. Traders who were willing to buy or sell there earlier may remove their orders to avoid getting run over.
- Lastly, aggressive traders front-run the level. Usually, they enter early in anticipation of a reaction.
So, what’s the result? That level no longer acts like a wall. Instead, it becomes a “vacuum”. With no real orders left to trade against, price moves straight through.
The Difference Between Traded Levels and Untested Levels
For most new traders, a level that worked before automatically remains valid. But that’s a myth! What matters most is “how the level was formed.” It must be noted that well-traded levels usually show clear signs of acceptance. Let’s see what these signs are:
These levels represent real agreement between buyers and sellers.
How Do Untested or Lightly Tested Levels Look?
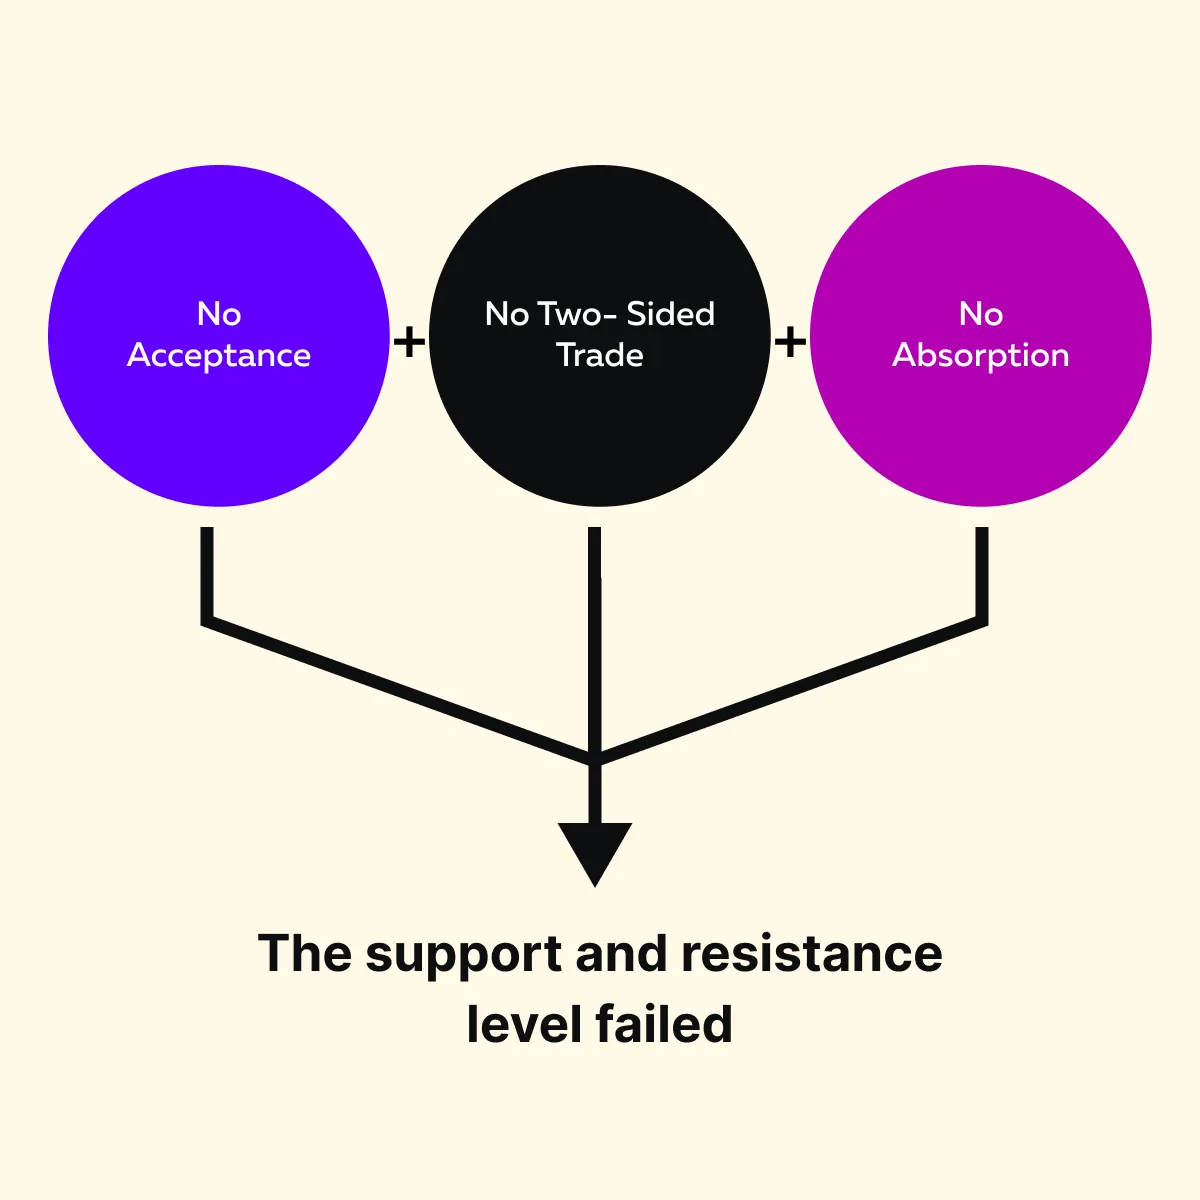
They look different. Price passed through them during strong momentum. But there was:
- No real pause,
- No two-sided trade, and
- No acceptance.
Since the market never agreed on that price, these levels usually fail when revisited. So, what can you learn? Traded levels are built through participation and agreement. In contrast, untested levels are “just references”. And references break easily.
Weak Support and Resistance Explained
Weak support and resistance levels are easy to spot once you understand how they form. They usually appear in areas where:
- Price moved very fast,
- Trading was mainly one-sided, and
- The market never had enough time to interact at that price properly.
Additionally, these “weak levels” also share three major traits. Let’s check them out:
| Trait I: Price Spent Very Little Time There | Trait II: Volume Was Low | Trait III: Absence of Rejection or Sustained Acceptance |
| The market rushed through instead of slowing down. | There was limited participation from both buyers and sellers. | The price didn’t bounce strongly, nor did it consolidate and build value. |
Due to these traits, the market never truly agreed on what that price was worth. Without agreement, the level has no structural strength. It may look good or precise on a chart, but structurally, it is fragile.
How do markets handle such weak levels?
From a market-making and game-theory perspective, defending such levels doesn’t make sense. Why? That’s because liquidity providers prefer areas where two-sided trade is likely (because that reduces risk).
If they defend a level that was never accepted, they expose themselves to adverse selection. They might get filled just before the price moves against them. So instead of standing firm, liquidity often pulls away as price approaches a weak level.
It is worth noting that such weak highs and lows commonly form during forced moves, such as stop runs or liquidations. Later, when prices return, the market revisits these areas to:
- Finish the auction properly,
or
- Move straight through them with little resistance.
Understand support and resistance beyond price lines → Compare Packages
Liquidity Behavior Around Levels That Fail
First, understand that liquidity shows whether support and resistance levels are likely to hold or fail. When a level is weak, the “behavior of liquidity changes” before the price even gets there. Okay, so how to spot such weak or failing levels using liquidity? You can look for these two warning signs:
| Warning Sign | What You See in Liquidity | What It Means | Why the Level Is Likely to Fail |
| Resting liquidity pulls away as the price approaches. | Buy or sell limit orders disappear from the order book near the level. | Traders are canceling orders instead of defending the price. | Without resting orders, there is no support or resistance to absorb pressure. Thus, the price can move through easily. |
| The order book becomes thin near the level. | There are fewer visible orders close to the level. Also, there are gaps in liquidity. | There is little two-sided participation at that price. | Aggressive buyers or sellers can push the price above the level. Why? There is no resistance to trade against. |
How Do Strong Levels Behave?
Strong support and resistance levels behave very differently from weak ones because liquidity does not run away. Instead, it stays in place and does its job.
As the price approaches a strong level, resting orders remain visible. Buyers or sellers are willing to get filled there. When aggressive trades hit the level, that liquidity absorbs the pressure rather than letting the price pass through immediately.
Order Flow Signals That a Level Will Not Hold
Order flow often gives advance notice that a level is about to break. Yes, the market usually tells the story before the chart does. Let’s see some signs:
| Order Flow Warning Signs | What You See | What It Tells You | Why the Level Is Likely to Break |
| Aggressive buying or selling with little resistance | Market orders keep hitting the level, and the price keeps moving without hesitation. | Resting liquidity is not absorbing pressure. |
|
| Delta expands without price rejection. | Heavy buying or selling shows up in the delta. But the price does not bounce. | One side is dominant, and the other side is not responding. |
|
| Repeated tests with weaker responses | Each retest produces more minor reactions or shorter pauses. | Liquidity is being consumed with every test. |
|
When these signals appear, the level is already failing beneath the surface (even if it still looks intact on the chart).
Learn how order flow confirms strong vs weak levels → Compare Plans.
Why Support Often Becomes Resistance
Do you know what happens when a support level breaks without acceptance? It becomes a “reaction point”. After a weak break-
- Former buyers become trapped, and
- On retests, many use the level to exit their losing positions.
At the same time, sellers defend the level “opportunistically” and try to sell into those exits, causing liquidity to build on the opposite side of the original support.
Now, due to these factors, broken support behaves like resistance. However, remember that this happens for a brief period. It is not strong because of its structure or acceptance. Instead, it works “temporarily” because of trapped traders adjusting their positions.
For more clarity, let’s study a market example.
An Example Where Support Turned Into Resistance
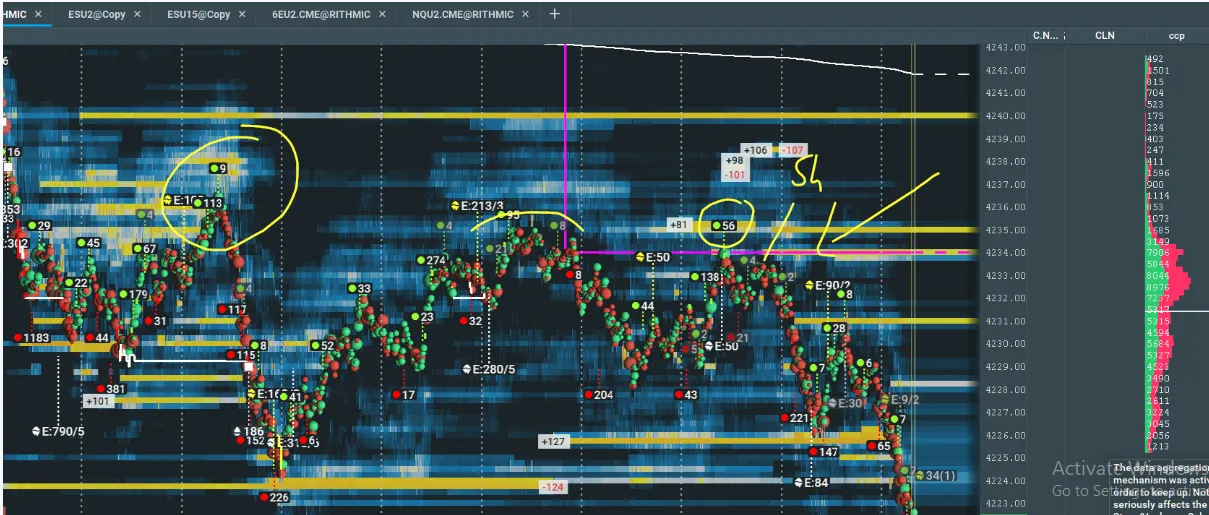
In this Bookmap example, the highlighted area previously served as a support level. But structurally, it was weak. Why? That’s because when the price traded there for the first time:
- Participation was poor.
- Price did not spend much time at the level.
- Volume was light.
- There was minimal absorption from buyers.
In other words, buyers did not actively defend the price. The auction never slowed down or showed real agreement. So this support was never truly accepted by the market.
That’s why the level failed.
Why Did the Support Break?
Later, when the price returned to this area, there was no genuine buying interest. As a result, liquidity dried up, and aggressive selling pushed the price through the level easily.
What does this tell us? The failure was not random. The support and resistance levels failed because they had no structural backing.
What Happened on the Retest (From Below)
After the price broke below the level, it later retested the same price from underneath. This time, the following things changed:
- Selling pressure appeared,
- Liquidity shifted to defend the area from above, and
- Sellers became active where buyers had previously failed.
The same level worked on the retest because of “participant behaviour”. And what is this behaviour? Trapped buyers from earlier were exiting, and sellers were now willing to defend the price.
The Key Takeaway
The above Bookmap chart shows that support and resistance levels are outcomes (not causes). You must observe that the level failed because:
- The auction never accepted the price,
- Buyers did not absorb the selling, and
- Liquidity was unwilling to defend the level.
And the retest worked only because traders reacted, not because the level itself had any power. Explore more real order flow examples → https://bookmap.com/insights
Conclusion
Till now, you must have understood that support and resistance levels are not guarantees. They do not force prices to react. Instead, they show what traders did in the past. When a level fails, it usually means:
- The price never had absolute acceptance, participation, or liquidity to begin with,
and
- The price may have passed through the area, but the market never agreed that the level mattered.
Thus, you should never focus only on “where a level sits on the chart”, as it can be misleading. Okay, so what to do instead? Observe how the level was formed and whether the price spent time there. Also, check whether the volume built up and whether both buyers and sellers were active.
Always remember that levels without these qualities are weak, even if they look clean or obvious. When traders understand this difference, support and resistance levels stop being static lines.
See why some levels fail through real liquidity behavior → Compare Packages.
FAQs
1. Why do some support and resistance levels fail immediately?
Some support and resistance levels fail because the market never treated them as important. Okay, but how to spot this non-importance? You will usually see:
- Price moved through too quickly,
- Very little volume was traded, and
- Buyers and sellers did not interact.
Without time, participation, and acceptance, there is nothing to hold the price in place.
2. What makes a support or resistance level strong?
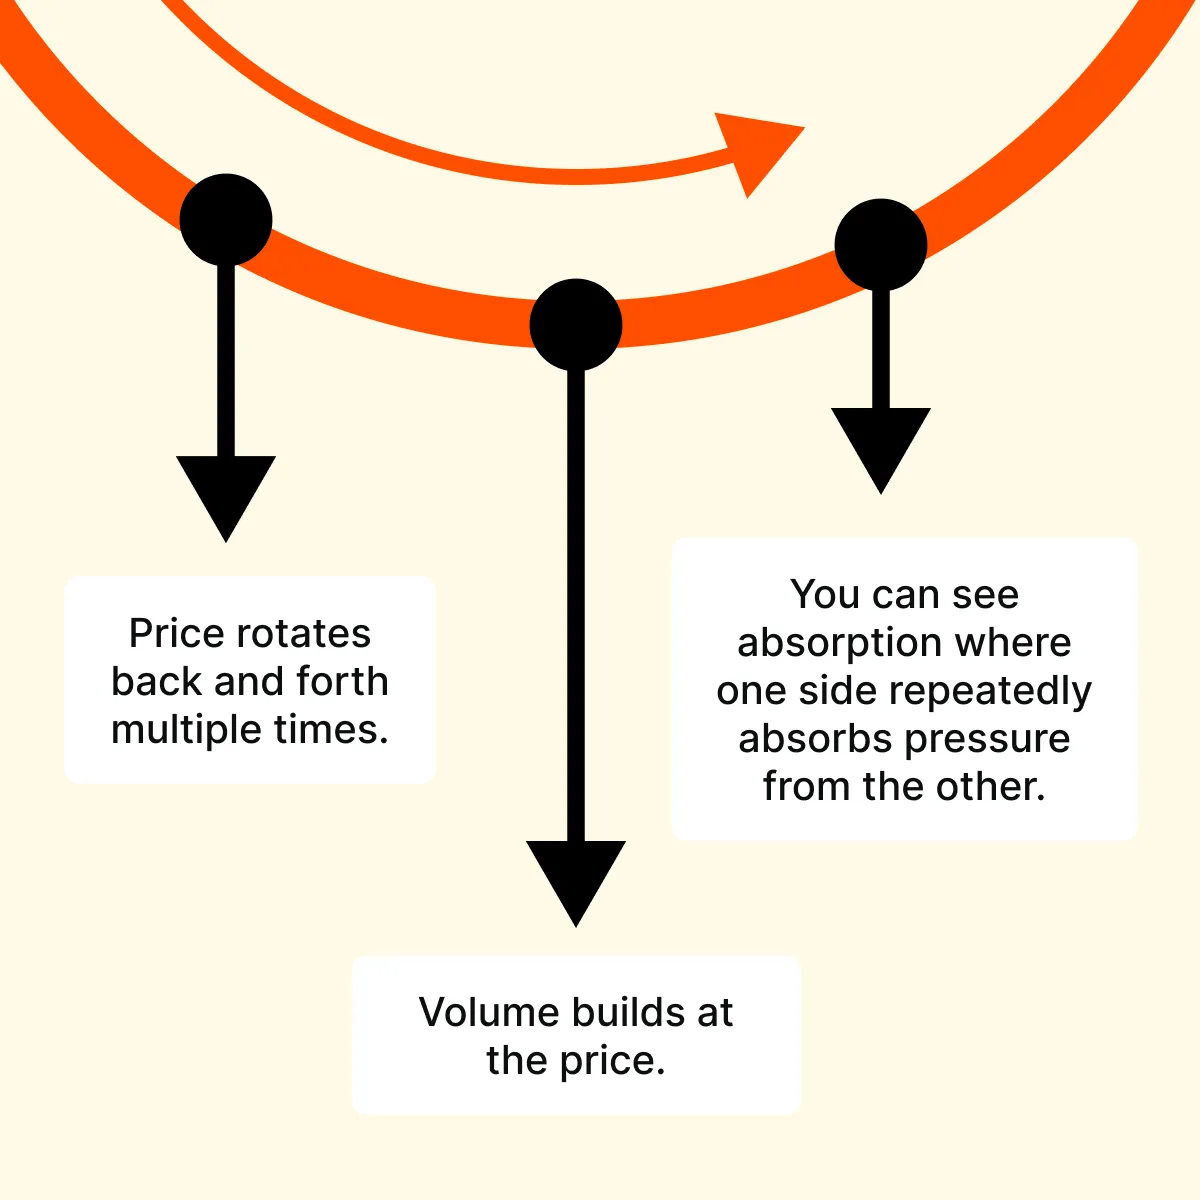
A strong level forms when:
- Price trades there for a while,
- Volume builds,
- Both sides actively participate.
Also, you will usually see “absorption”, where one side repeatedly absorbs pressure. This shows the market accepted the price and is willing to defend it.
3. Why does broken support often turn into resistance?
When support breaks, buyers who entered earlier are often trapped. And later, when the price returns, they sell to exit. Additionally, sellers step in to defend the area.
This combined behavior makes the “old support” act like “resistance” (at least temporarily).
4. How does Bookmap help analyze support and resistance?
On Bookmap, you can visualize:
- Where liquidity is placed,
- Whether it stays or pulls, and
- How aggressive trades interact with it.
When equipped with this knowledge, you can see if support and resistance levels are being defended, absorbed, or abandoned.
Sign Up Now