See support resistance more clearly in real time.
Compare plans to access deeper market visibility for support resistance.
Education
January 15, 2026
SHARE
The Trap of “Obvious” Levels: When Support and Resistance Work Against You
 It is common knowledge that most traders gravitate towards obvious support and resistance levels. But do you know the side effects of this popular strategy? Usually, at these levels, stop orders cluster, and big players wait to exploit predictable behavior.
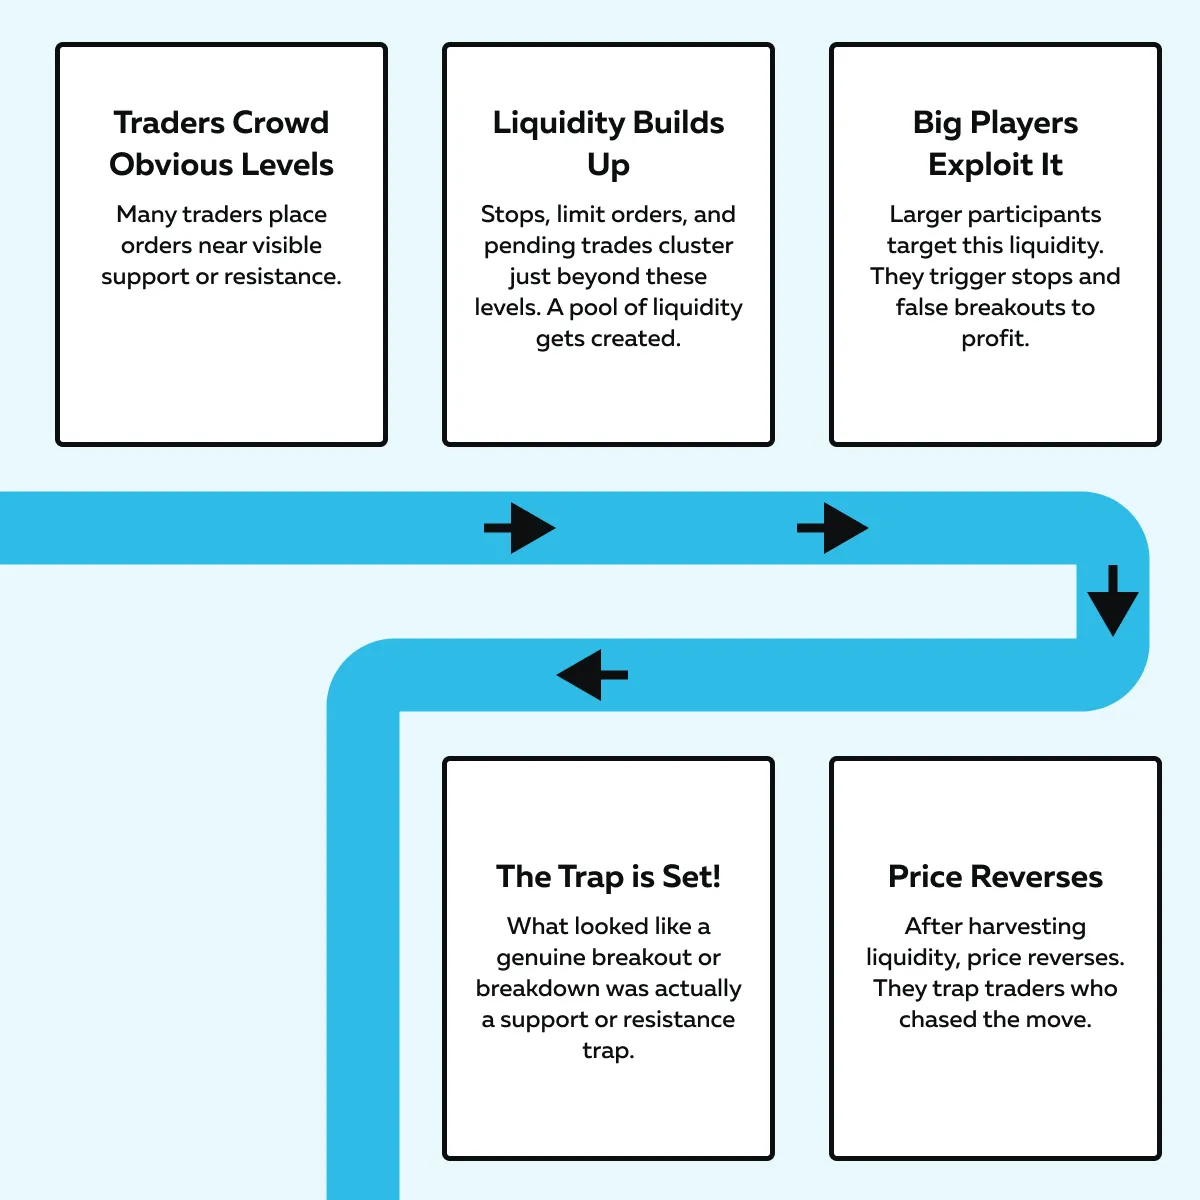
The result? The formation of a support and resistance trap! To you, it seems the price will break out or reverse. But it snaps back and catches traders off guard. These traps form when liquidity, stop orders, and trader behavior collide. This collision creates false breakouts, reversals, and bait walls. But remember that these traps aren’t always about “wrong levels”! Instead, they’re about how the market behaves around those levels.
In this article, you’ll learn why obvious levels attract traps, how stop runs and false breakouts work, and how to read real intent using advanced tools like Bookmap. Read this article till the end to spot genuine moves and avoid traps!
Why Obvious Levels Attract Traps, Not Just Trades
Most traders spot a pattern and get comfortable. And why not? Spotting patterns is tough. But that comfort often becomes a trap! The more obvious a support or resistance level looks, the more traders rush in. This behavior makes it a perfect setup for support and resistance traps.
Let’s understand why that happens:
Herd Behavior Creates Predictability
Most traders try to trade where others are trading. This way, they feel safe! So they focus on visible price points like the:
- Previous day’s highs or lows,
- Round numbers, and
- Popular indicators like VWAP.
These areas feel familiar and logical. However, as a trader, you should realize that when too many traders anchor their buy or sell decisions around these same spots, their actions become predictable. Always remember that when everyone is waiting at the same gate, the market knows it.
Predictability Becomes Exploitable
Big players and algorithms depend on “predictability”. When they see a build-up of orders around obvious levels, they try to exploit it. As a result, liquidity (in the form of stop-losses and pending breakout orders) gathers just beyond support or resistance. By pushing price slightly past these levels, they:
- Trigger those orders,
- Absorb liquidity, and
- Try to reverse the move.
Thus, when too many eyes are watching the same thing, it leads to the formation of support and resistance traps.
The Self-Fulfilling Myth
Sometimes support and resistance levels “work” only because most traders believe they will. This belief usually turns into a “self-fulfilling myth”. When thousands of traders expect the same level to hold or break, their collective actions make it seem valid (but only for a while).
Once price breaks that level, chaos follows –
| Some Traders Enter the Market | Some Traders Exit The Market |
|
|
This mix of emotions and orders creates sudden volatility. There is no shortage of fake moves in the market, besides the classic support and resistance traps many fall for. Let’s understand better through an example:
-
- Suppose a day trader marks 4200 on the ES futures as strong resistance.
- As the price nears the level, limit sell orders pile up below it.
- Then, price pops above 4200!
- It triggers breakout buys.
-
- However, later, the price reverses as large players pull their orders.
- As a result, the breakout traders get trapped!
- So, you can observe how fragile these “strong” levels can be.
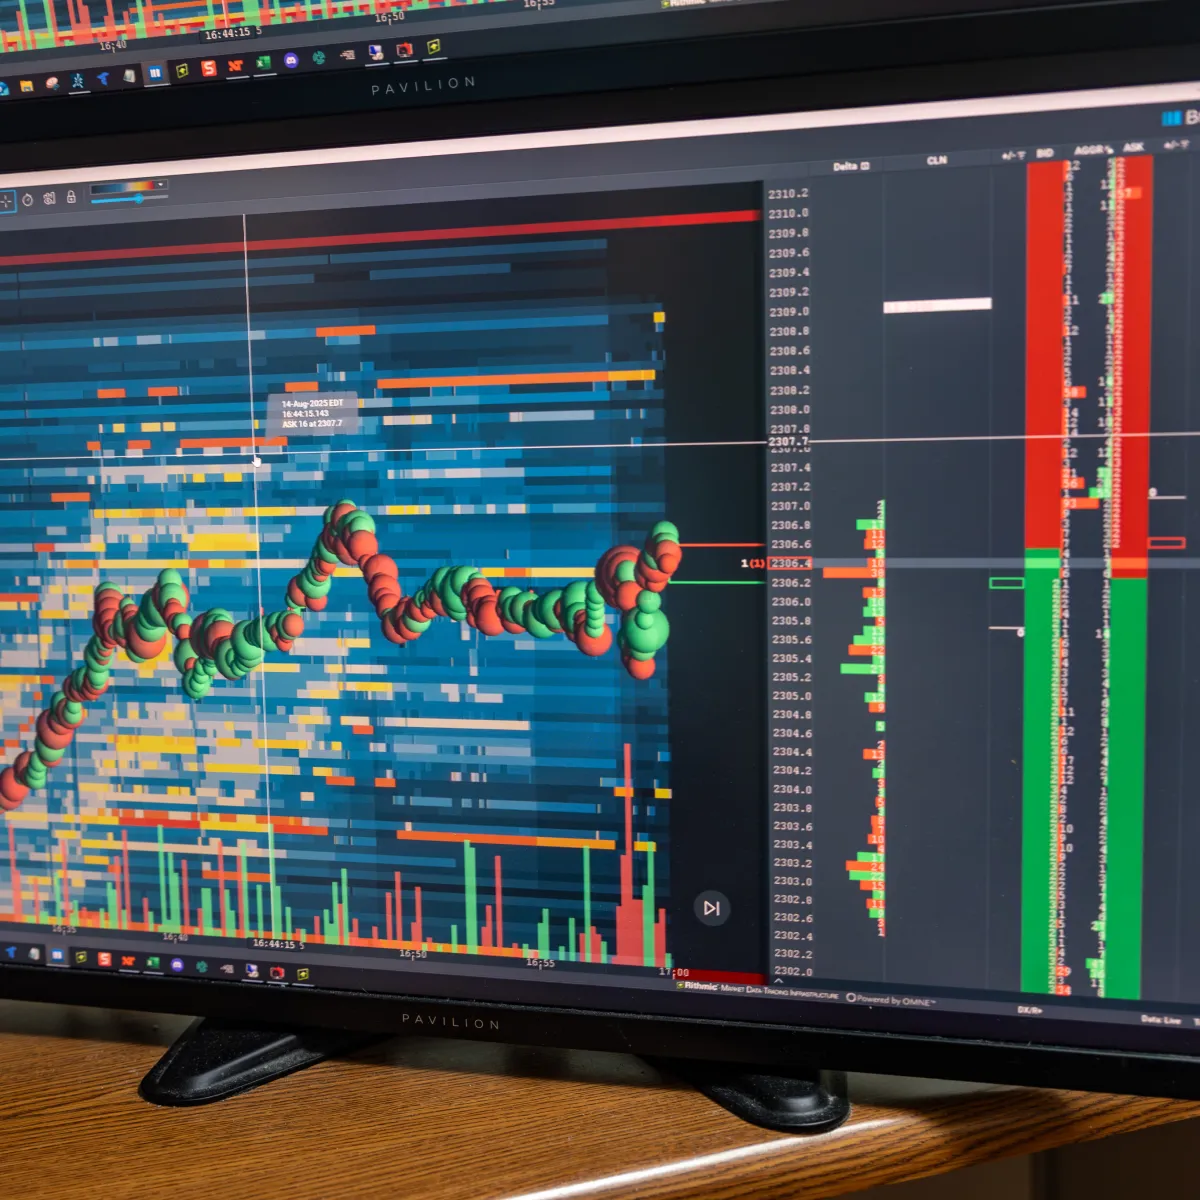
If you want to see this behavior visually, you can start using the Bookmap’s Volume Delta column (see Bookmap Learning Center). Through it, you will understand where real buying and selling pressure sits. This column even exposes these traps in real time!
The Role of Liquidity Around Key Levels
Let’s assume that price levels are the “stage” in a theatre! As per the analogy, what role does “liquidity” play here? It is the “script” the market follows. Yes, every support and resistance trap is built around:
- How liquidity behaves,
- Where it appears,
- Where it disappears, and
- Where it shifts to.
Let’s understand the importance of liquidity in detail:
Liquidity Is Where the Real Game Happens
Liquidity represents interest. It shows where traders wait to buy or sell resting orders (limit bids or offers). Also, these orders show where participants are willing to act.
Usually, you’ll find clusters of resting liquidity sitting just before or just beyond support and resistance levels. Now, that’s where price gets drawn. Is it because of magic? Nope! It’s because that’s where the orders (and opportunities) live.
But Not All Liquidity Is Real
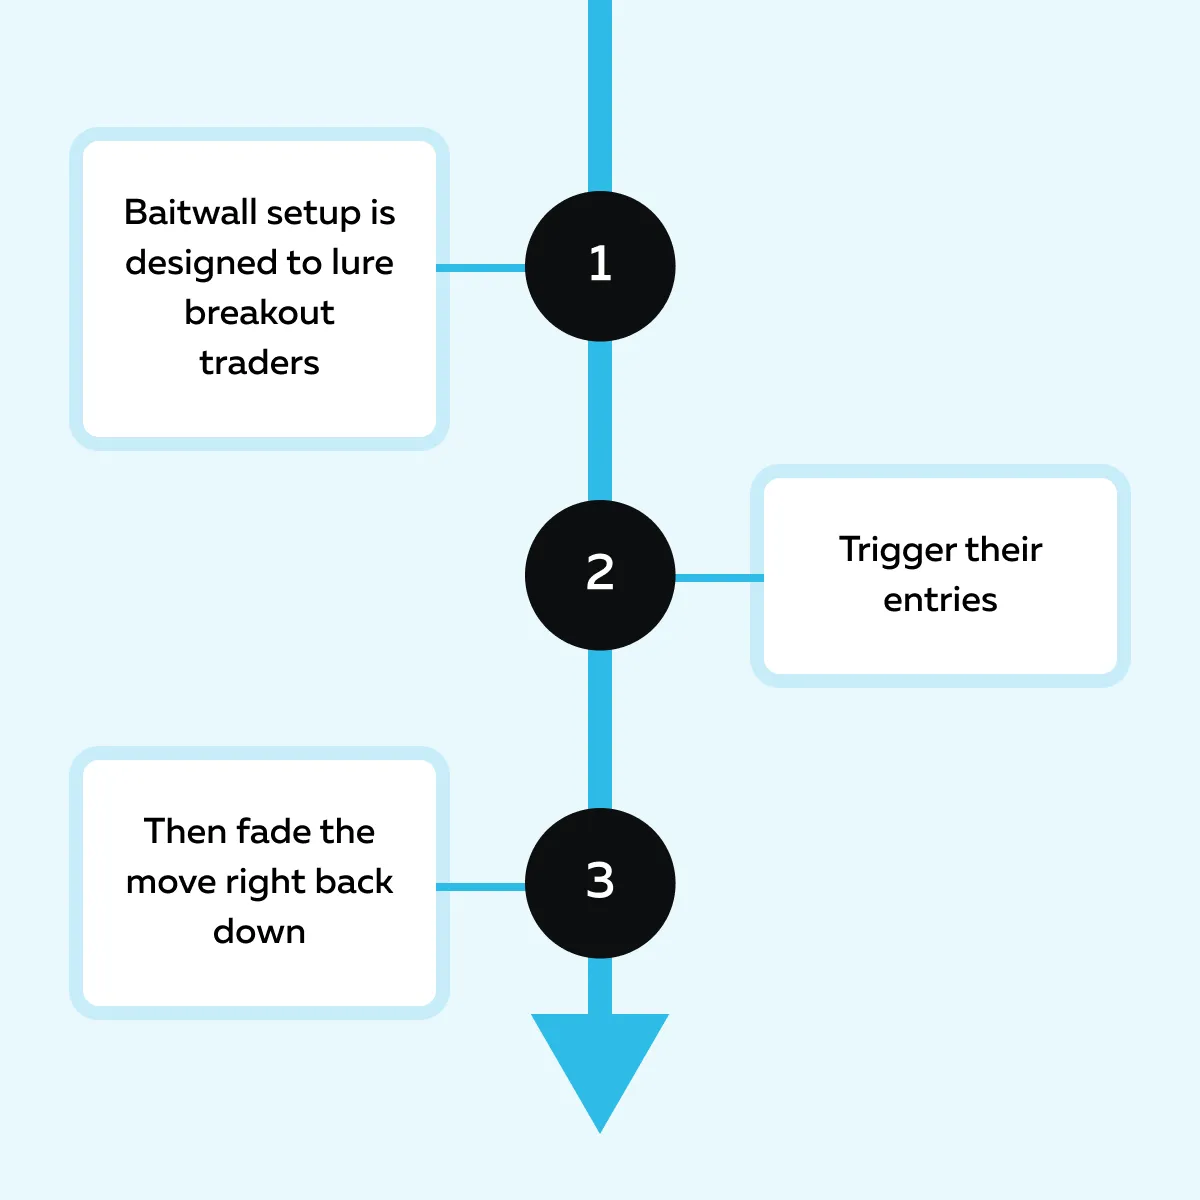
Some liquidity is just bait! Big players sometimes place large fake orders (called “bait walls”) to create the illusion of strong buying or selling pressure. As the price moves closer, they pull or shift these orders.
This strategy is one of the classic ways support and resistance traps are built. Big players try to manipulate what others think to make profits!
Okay, So How Do I Save Myself?
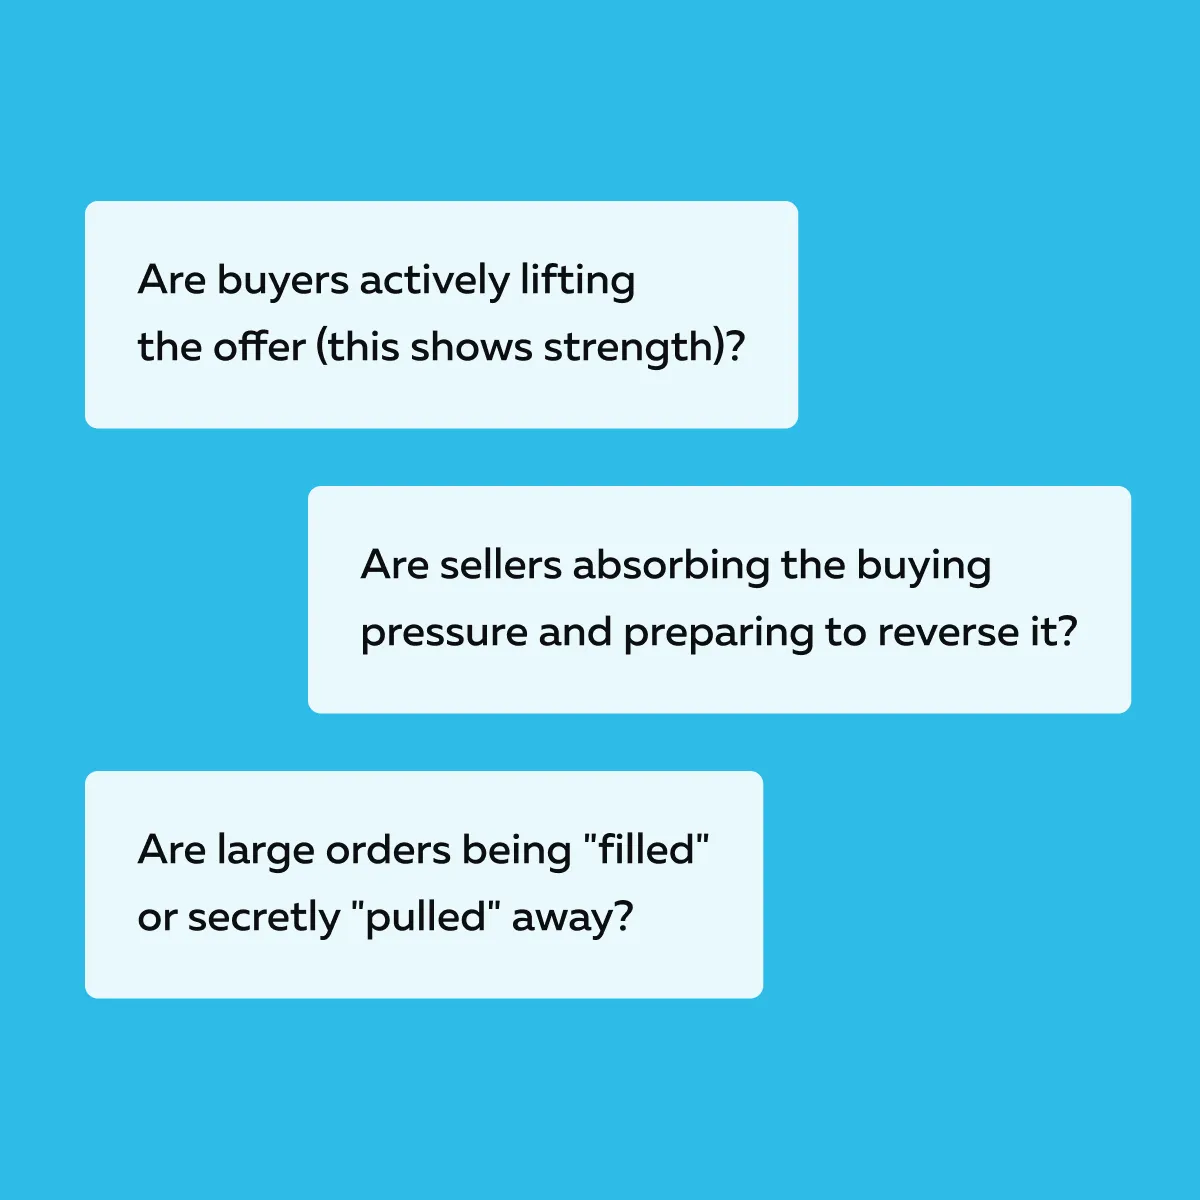
You should watch for changes in intent! Always remember that the price level doesn’t matter. Instead, you should observe how traders behave as the price nears it. To identify the real intent, try to find answers to these questions:
Take Advantage of the Bookmap View
Support and resistance traps can be easily identified on Bookmap. All you have to do is watch Bookmap’s heatmap:
-
- Suppose the heatmap shows strong resting liquidity just above a resistance level.
- Now, as price tags it, that liquidity suddenly vanishes!
- What follows is heavy selling.
- Now, that’s a textbook bait wall.
Let’s see why this manipulative setup is created:
Think that level is safe? Liquidity might say otherwise. See it live with Bookmap.
How Support and Resistance Become Traps
Support and resistance levels become traps because of how liquidity, stop orders, and trader behavior interact. Let’s see how these traps are created in real market conditions:
Stop Runs as Liquidity Harvesting
Most traders place their stop-loss orders just beyond support or resistance. That makes these zones goldmines for bigger players looking for liquidity. When the price spikes through a level, it triggers those stops.
But since that move isn’t backed by real buying or selling interest, the price usually falls. As a trader, you must realize that this “stop run” is just liquidity absorption (not a true breakout).
False Breakouts and Failed Moves
A breakout is only as strong as the participation behind it. If price moves beyond support or resistance but lacks real follow-through from large traders, the breakout fails. Let’s gain more clarity:
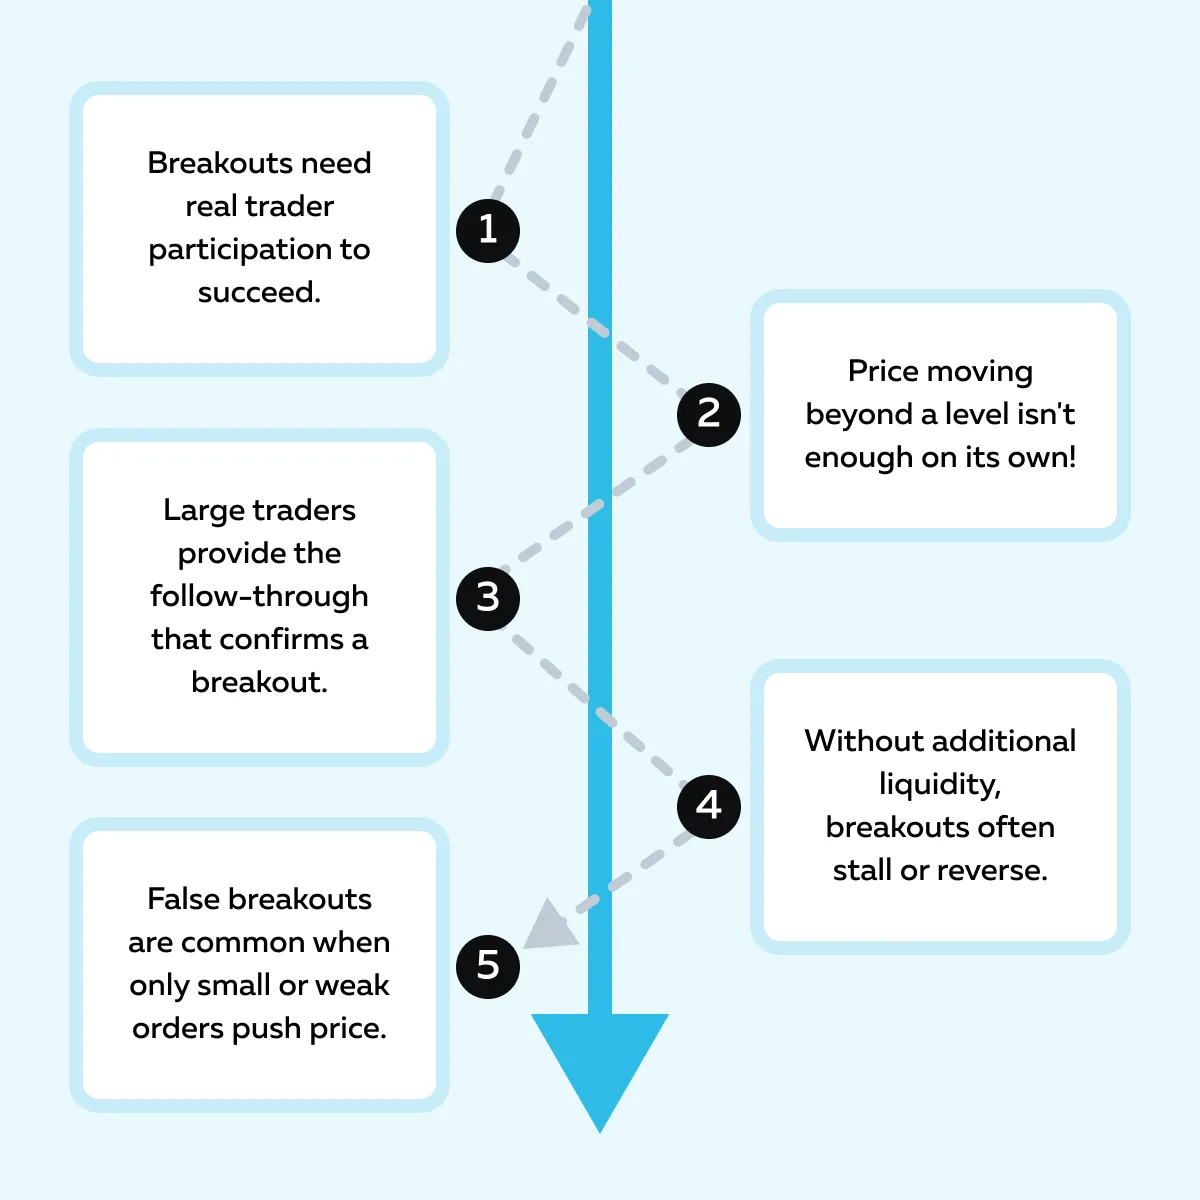
In these failed breakouts, you’ll see the price shoot up briefly, stall, and then drop! That’s why you should trade behavior, not lines on a chart.
Passive Players Control the Outcome
Not all traders are aggressive! The market has some “passive traders” too, who use limit orders. Now, these limit orders decide whether a move survives or fails. Let’s understand through an example:
-
- Suppose buyers are pushing the price into resistance.
- Now, large sellers (passive) are sitting there with resting limit orders.
- They are quietly absorbing all that buying.
- As a result, the move loses strength.
- The result? A fake breakout that traps late buyers!
Take another example. Let’s assume that ES futures break below morning support. Sellers rush in aggressively as they are convinced it’s a clean breakdown. However, passive buyers step up and they absorb every sell order. This buying pushes the price back up. As a result, the shorts who chased the move get stopped out.
How to Trade Around These Levels Without Getting Trapped
Never misread the behavior around them! To avoid support and resistance traps, you must try to understand who’s trading and why. Let’s see how you can stay on the right side of the move:
Focus on Behavior, Not Just the Line!
A price level alone means little without context. As the price approaches support or resistance, ask yourself these questions:
- Who’s in control?
- Are buyers absorbing sell orders?
- Is price accelerating through with momentum?
- Are we seeing hesitation or conviction?
By watching behaviour, you can get better clues than the level itself! That’s because it shows intent and not just reaction.
Wait for Confirmation From Order Flow
Don’t assume every breakout or bounce is real. Wait for these proofs in the order flow:
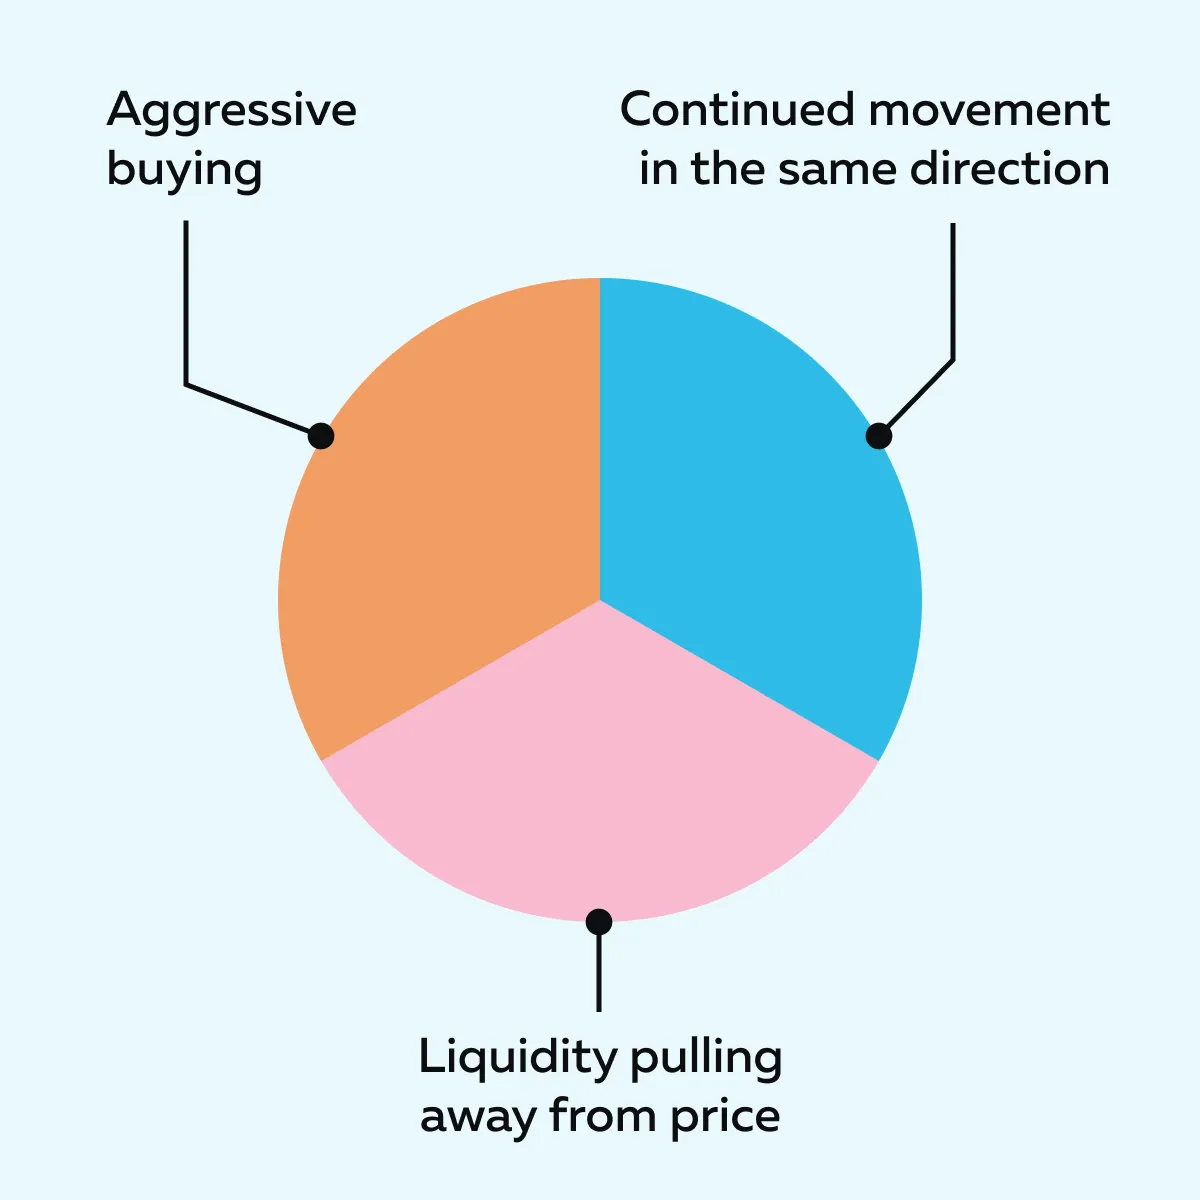
How can you observe these proofs? You can use Bookmap’s heatmap, volume dots, and imbalance indicators. These features let you see whether real traders are participating (or if it’s just noise).
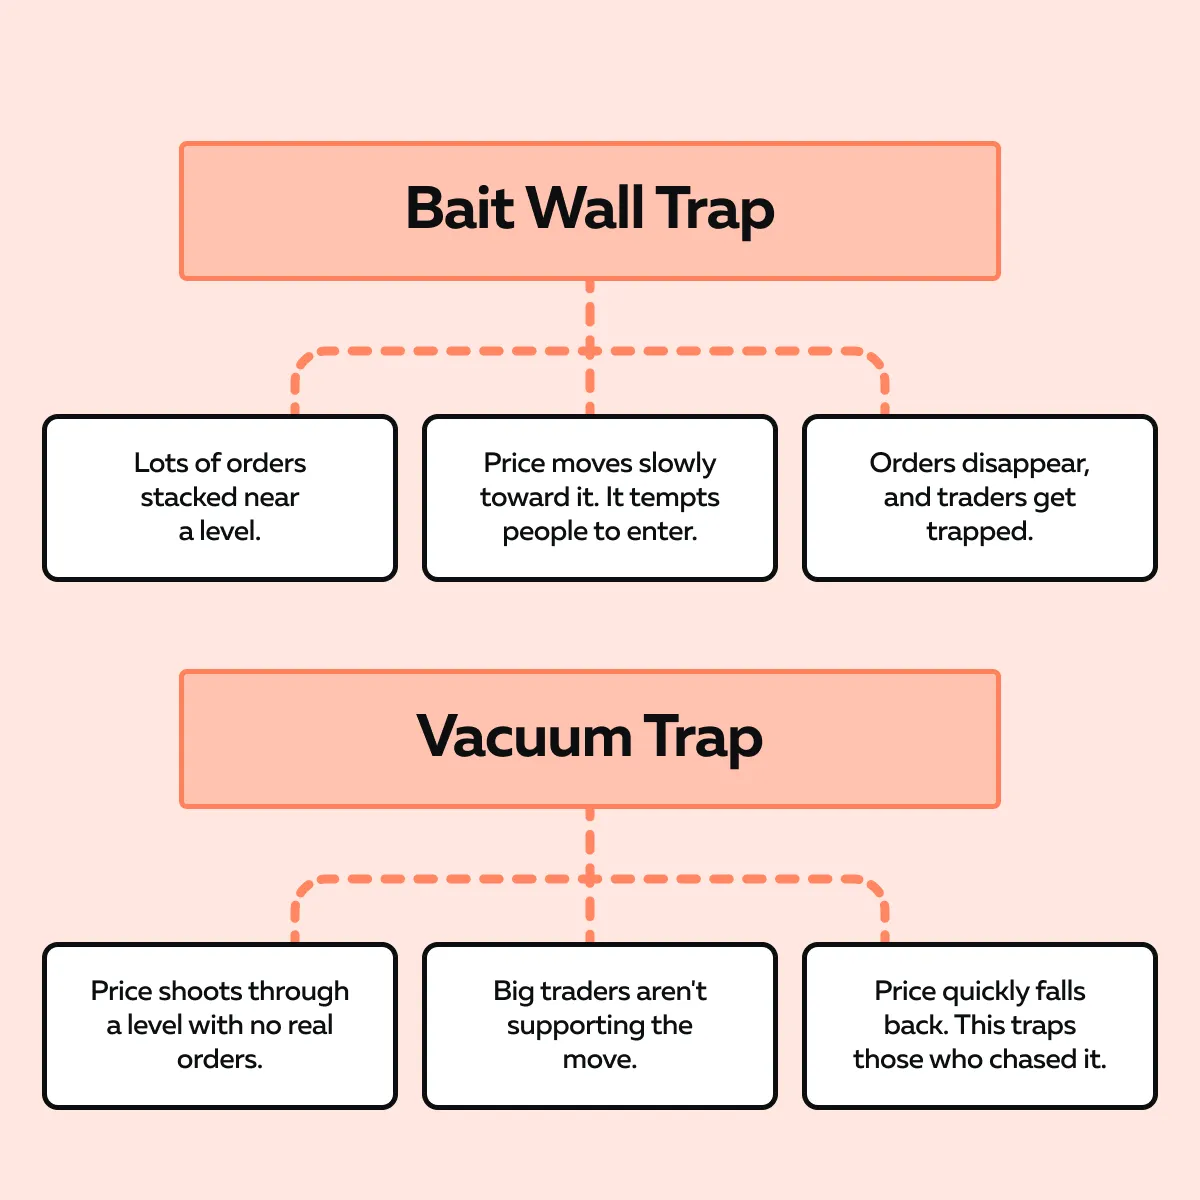
Recognize When Not to Trade
Sometimes, the best trade = no trade! Let’s assume you see that liquidity is stacked thick and the price is slowly moving towards it. Now this could be a “bait wall”. It is designed to lure traders in. On the other hand, if price rushes through a level with no visible liquidity, it’s probably a “vacuum” and not a true breakout. Both scenarios often lead to support and resistance traps!
Need one rule of thumb? Never trade into a level without understanding who’s behind the move. Let the market show real intent first and then act.
What Real Intent Looks Like
Not every move around support and resistance levels is worth considering! The market often fakes direction to trap traders. To avoid support and resistance traps, you should focus on signs of real intent, where genuine buying or selling interest influences price and not just temporary emotion or stop runs.
Read out these three market scenarios to better identify the real intent:
| I) Absorption Followed by Reversal | II) Pullbacks With Liquidity Support | III) Stop Runs With No Follow-Through |
|
|
|
Conclusion
So, till now, you must have understood that support and resistance levels aren’t useless! They’re just misunderstood. Many traders see them as guaranteed turning points, but in reality, these areas are where buying and selling pressure collide and fight for control.
Always remember that the price level doesn’t matter! Instead, you should try to understand what happens around it. Try to find answers to these questions:
- Who’s active,
- How the price reacts, and
- Whether genuine interest exists or not.
Furthermore, to trade smarter, you should not focus only on where the line is drawn. Instead, start watching how the market behaves near it. Need a tool for this? You can use Bookmap to watch the liquidity and order flow live. This data lets you spot intent and avoid market traps. So, don’t just mark levels – understand how they’re used.
FAQs
1. Why do support and resistance levels fail so often?
They fail when too many traders act on the same level. Usually, large players use these crowded orders as liquidity. They push the price past the level and then reverse it.
As a trader, you should understand that if there isn’t real buying or selling beyond the support/ resistance level, it often leads to a trap (and not a genuine move).
2. What’s the best way to identify traps?
You can watch real-time order flow using tools like Bookmap. Ideally, you should look for signs like:
- Orders being pulled,
- Absorption, and
- Fake aggression.
Additionally, pay attention to the heatmap and tape. Observe it and try to identify:
- Spoofing,
- Passive buyers or sellers defending a level, and
- Moves that lack real follow-through.
These behaviors show whether a level is real or a trap!
3. Should I stop using support and resistance levels altogether?
No! You can use them as reference points (not guaranteed signals). As a trader, you can combine them with order flow and liquidity analysis. This combined analysis allows you to see if traders are genuinely supporting or attacking the level.
Through this approach, you can avoid traps and only trade when the level shows genuine strength or weakness.
4. What is a bait wall?
A bait wall is a large visible order. It is placed to trick traders into thinking there’s strong buying or selling at a level. These orders are usually canceled or moved before execution.
But why? The goal is to lure traders into the wrong side of the market. When this happens, larger players try to profit from their stops.
5. What’s the difference between a failed breakout and a trap?
A failed breakout happens when the price moves past a level but lacks follow-through. As a result, it naturally falls back. In contrast, a trap is planned! Big players push prices past a level to trigger stop orders or lure traders. Next, they quickly reverse the price.
Always remember that traps are engineered to exploit other traders’ mistakes!
Sign Up Now