See fake liquidity more clearly in real time.
Compare plans to access deeper market visibility for fake liquidity.
Education
October 7, 2025
SHARE
How Price Reacts Around “Fake” Liquidity: Bait Walls and Phantom Size

If every glowing wall in the order book were real, trading would be as easy as following a neon sign to profits! But markets don’t hand out shortcuts that generously.
Realize that in trading, not every large order you see represents true intent. Sometimes big walls appear in the order book. But they disappear when the price gets close. This is fake liquidity created by placing orders that were meant to influence behaviour (not to trade).
Such phantom liquidity often misleads traders into chasing moves that reverse a few minutes later.
Want to succeed when not every number on your screen tells the truth? In this article, you’ll understand why traders create fake walls and how price behaves around them. Most importantly, you will learn how to detect fake walls in real time.
Also, you will know how Bookmap’s advanced features, like heatmaps, volume dots, and order book replay, let you separate real interest from manipulation.
What Is Fake Liquidity?
Firstly, before reading this article, clear one thing! There’s technically nothing as “fake liquidity”. The term “liquidity” means the ability to buy or sell without much price impact. Now, what traders call “fake liquidity” represents orders sitting in the order book that don’t reflect a true intention to trade.
For example,
- Say you might see a huge buy or sell order on the screen.
- Now, it looks like strong support or resistance.
- However, just as the market moves toward it, the order vanishes.
- These are sometimes called “bait walls” in the order book.
- These are big orders that lure traders into thinking there’s heavy demand or supply.
The Tactic of “Spoofing”

The misleading practice of spoofing is closely related to the concept of fake liquidity or phantom liquidity. For those unaware, in spoofing, large limit orders are placed to create the illusion of pressure. Later, these orders are canceled just before they get filled. Spoofing is illegal in regulated markets when it’s deliberate manipulation.
But is all phantom liquidity intentional trickery? No! Sometimes traders just:
- Change their minds
- Adjust positions (to reduce risk)
- React to market conditions
The patterns in these cases might resemble those of fake liquidity, but it’s not deliberate and is not even illegal.
Why Traders Use Bait Walls
A bait wall in the order book is like a mirage! Yes, it looks real, but it may not be. Traders place these large visible orders to create the illusion of strong interest at a certain price. Let’s understand the ideology of spoofers:
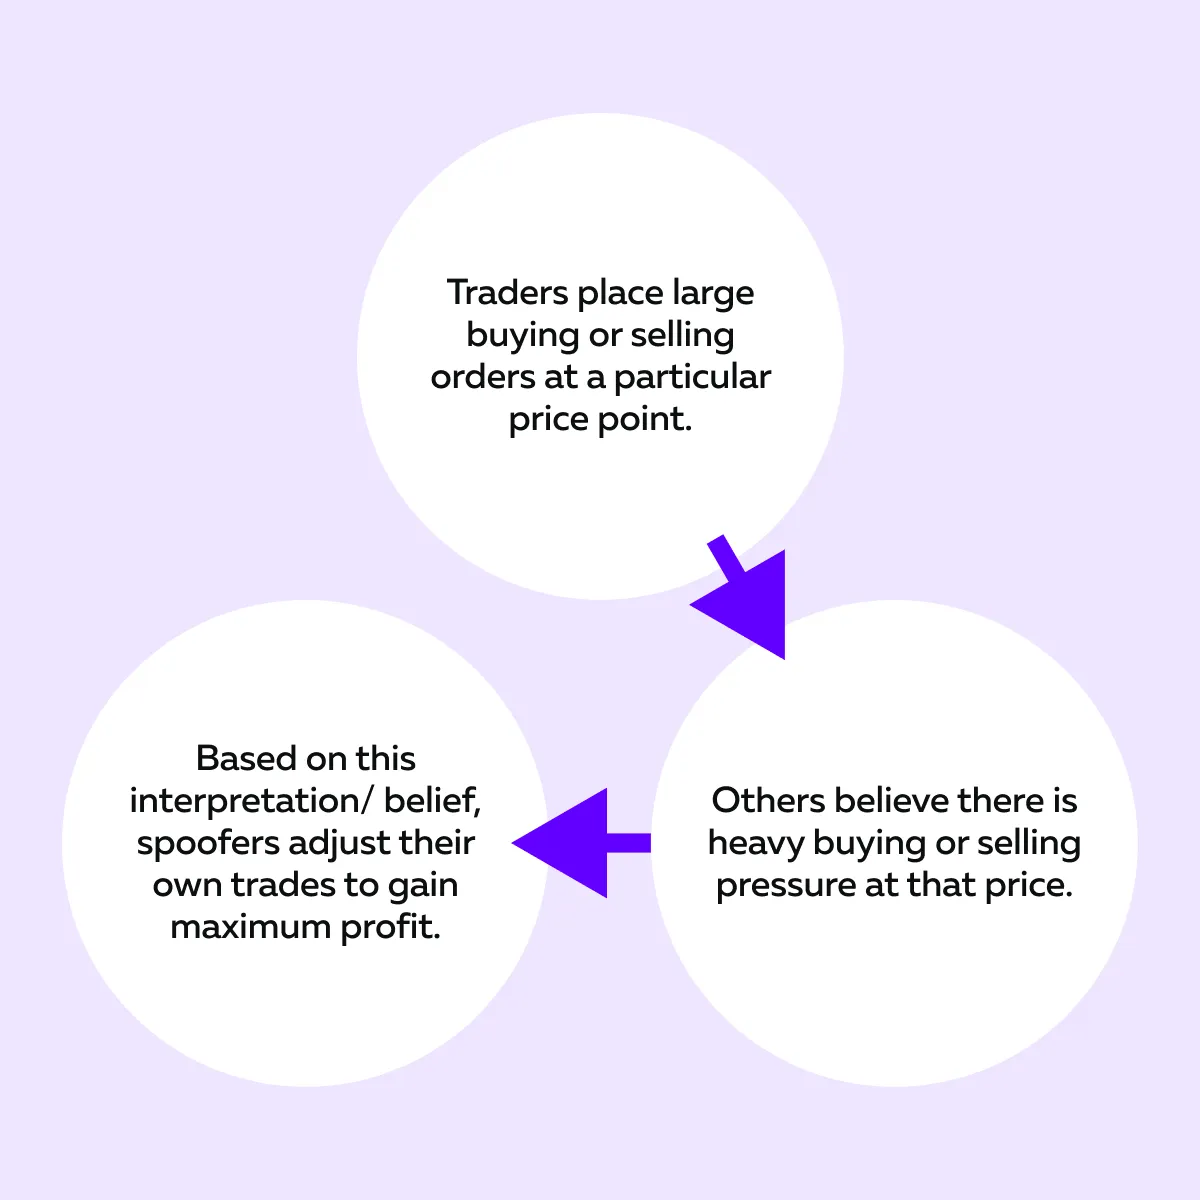
For more clarity, let’s study an example:
- Say a big sell wall is sitting just above the price.
- This makes retail traders hesitate to buy.
- Meanwhile, larger players use that hesitation to quietly sell to buyers.
Similarly, a buy wall can lure sellers into thinking strong support exists when, in reality, the order disappears before being filled. Catch disappearing walls before price slips through—Bookmap shows where liquidity is real.
These Walls are Mere Delusions!
As a trader, you must understand that these buy/ sell walls are not always about executing trades. They are created only to influence order flow. A classic scenario related to this concept is ”momentum slowing”. Let’s understand it in detail:
Such phantom liquidity is most common in thin markets, like:
- Crypto overnight sessions
- Pre-market trading
- Low-float stocks
Usually, they also appear around key reference points, such as VWAP, day highs or lows, or big round numbers. And during volatile moments (say, right before economic news), bait walls can completely influence or change how traders react.
How Price Behaves Around Fake Liquidity
When fake liquidity shows up in the order book, the price doesn’t move randomly. Instead, it moves in set patterns, which you can recognize. Such an understanding saves you from falling into traps created by bait walls or phantom liquidity. Below are the three most common patterns you must know:
1. Hesitation or Stall Near a Large Wall
When a big wall appears, traders often pause! Buyers may hold back. Sellers may rethink. As a result, the order flow slows down. Now, this hesitation causes short-term chop (price hovering without commitment).
As a trader, you should understand that this wall acts like a psychological barrier (even if it never gets filled).
2. Reversal Before Touching the Wall
Sometimes price marches toward a large visible order but never quite reaches it. Why? That’s because just before contact, the wall vanishes! Now, this sudden removal leads to a sharp price reversal. This reversal happens because trapped traders realize the liquidity was never real in the first place.
This is a classic sign of spoofing vs real orders! The size was meant to influence behaviour (not to trade).
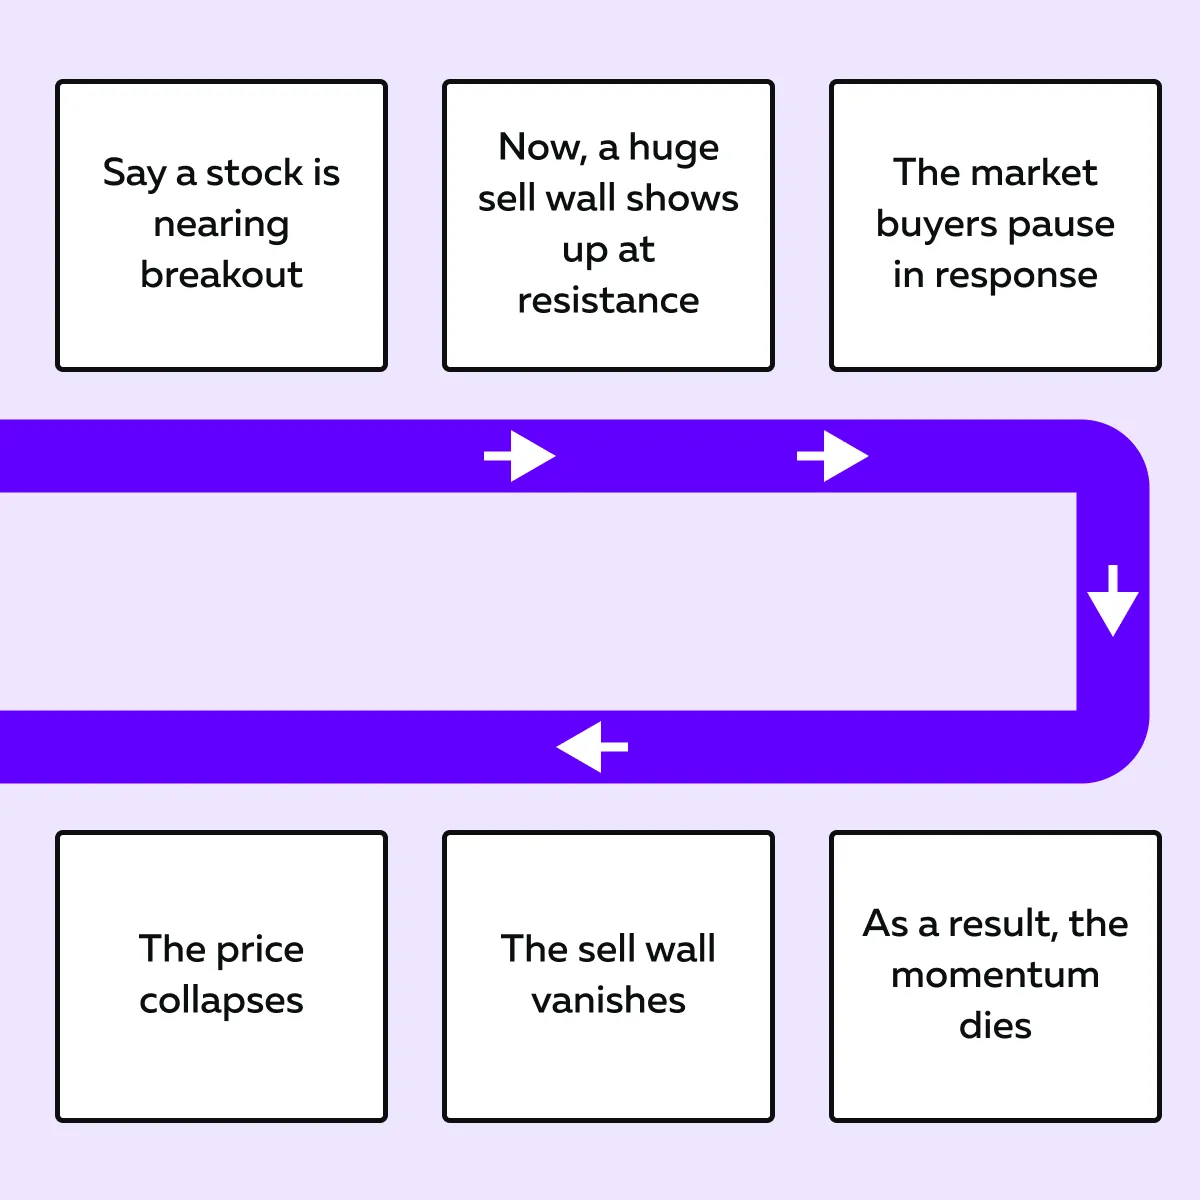
3. Breakthrough Followed by Trap
In other cases, the price actually breaks through the level. But there is something more than what meets the eye! Once the fake wall is pulled, the breakout traders pile in (thinking the move is strong).
However, after some time, larger players fade from the move. They cause the price to snap back. This “break and trap” sequence is one of the most painful setups for retail traders.
For more clarity, let’s check out an example:
- Say you are watching ES futures around the 4500 level on a heatmap tool like Bookmap.
- A thick wall sits at 4500.
- Buyers chase the breakout and volume spikes (big dots appear on Bookmap).
- However, just before the price touches it, the wall disappears.
- There’s no real liquidity supporting the breakout.
- Now, sellers step in and price reverses sharply.
- As a result, those late buyers get trapped.
As a trader, the key lesson for you is that price doesn’t just move because of real orders. Instead, it reacts to fake walls too. Thus, you must learn how to detect fake walls to avoid chasing traps.
How to Spot Fake Walls in Real Time
Want to know the hardest part about fake liquidity? It looks convincing and strongly influences your trading decisions! However, once you know the signs, it’s easier to tell the difference between spoofing vs real orders.
Below are the four main clues to watch for when trying to detect fake walls in the order book:
#Clue 1: The Wall Disappears as Price Approaches

A genuine buy or sell wall usually stays in place and either gets filled or partially filled. But when a wall vanishes the moment price gets close, it’s often just phantom liquidity. In this situation, the goal was to influence traders and not to trade.
#Clue 2: No Volume Prints at the Level
Say price actually touches a large order, but no real trades happen. Now, that’s a red flag! On advanced real-time market analysis tools, like Bookmap, you normally see “volume dots” when trades occur at a level.
However, if the price reaches the wall but no dots appear, it means no orders were filled. This happened because the wall was likely pulled at the last second and was just phantom liquidity.
#Clue 3: Repetitive Behavior at Key Zones
Some traders repeatedly place and cancel walls at the same levels, usually at:
- Round numbers
- VWAP
- Prior highs and lows
If you see a pattern of walls appearing and disappearing with no meaningful trade volume, you’re likely looking at a bait wall in the order book.
#Clue 4: No Iceberg Absorption
As a trader, you must realize that “true liquidity” is often hidden inside an iceberg order. For those unaware, with an iceberg, you only see a small portion of the order in the book. However, as traders hit it, the new size keeps refilling at the same price. That’s how genuine liquidity defends a level.
But fake walls don’t do this! They simply disappear when the price gets close. This shows there was no real intent to trade.
Use Bookmap to Easily Spot Phantom Liquidity!
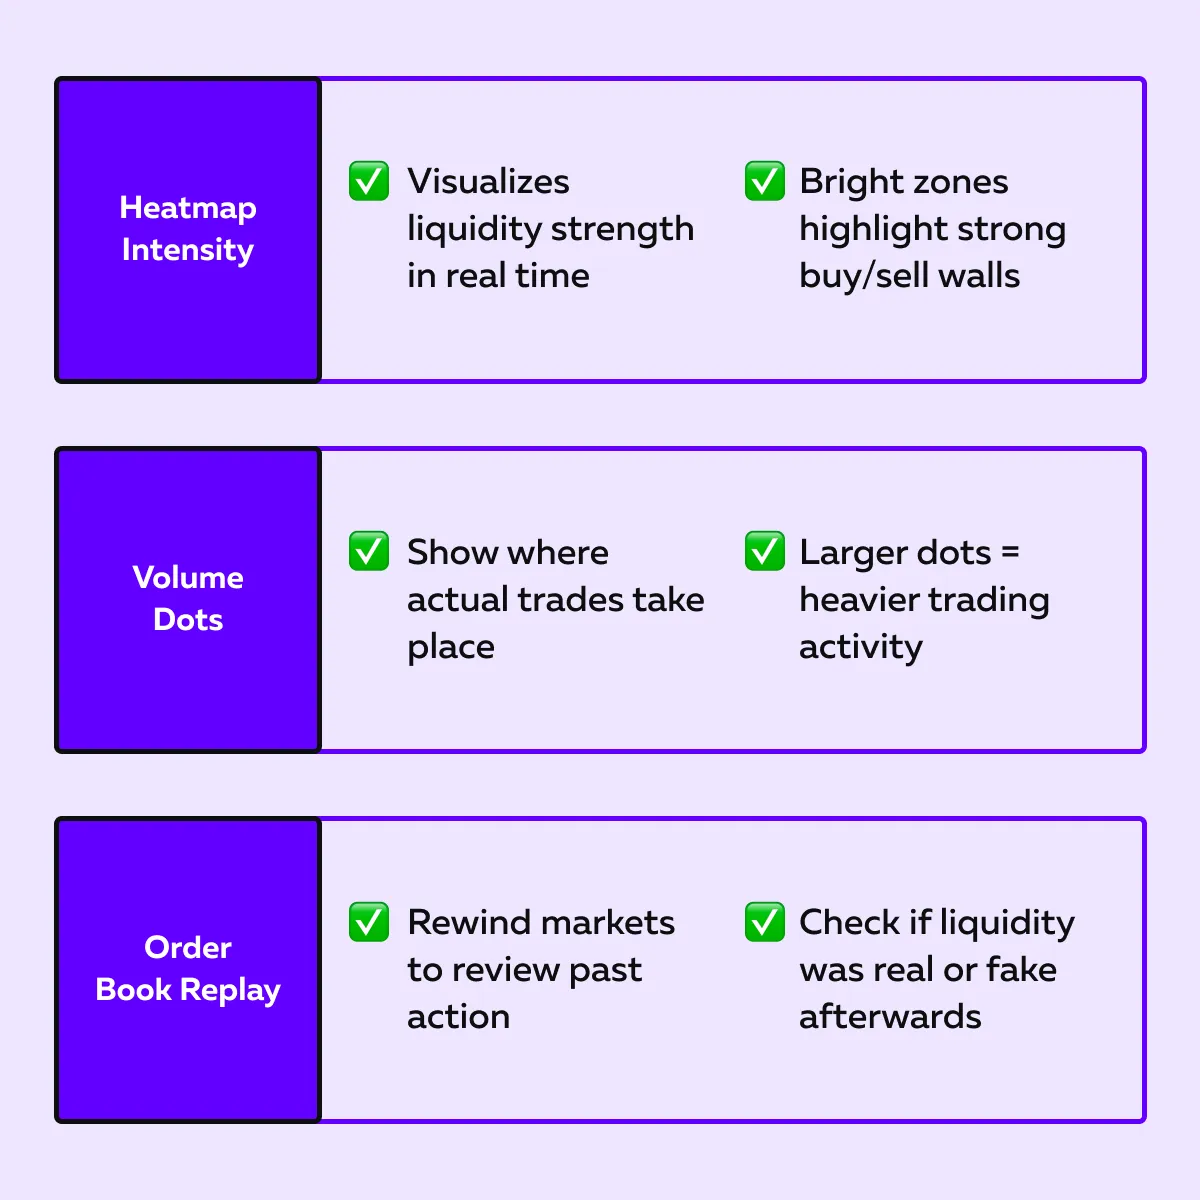
Bookmap offers several advanced features, using which you can easily spot phantom liquidity. These are:
- By analysing the “heatmap” intensity, you can determine how strong a wall looks.
- “Volume dots” reveal if trades actually happen there.
- You can replay the order book to go back and check whether the liquidity was real or just bait.
Let’s gain more clarity:
See real-time order flow and liquidity shifts with Bookmap’s heatmap.
How to Trade Around Fake Liquidity
So, now, with all this knowledge, you have learnt how to spot fake liquidity. But will you just ignore it moving forward? You should not! These bait walls in the order book create profitable trading opportunities. If you know how to read them, you can use this setup to your advantage.
Below are three ways you can trade around fake liquidity:
| 1. Fade Weak Breakouts | 2. Watch for Stop Runs | 3. Wait for Real Liquidity to Step Back In |
|
|
|
Need a Pro Tip? Try to Layer Your Signals
Don’t rely on fake wall detection alone! Instead, you can combine it with other order flow clues, such as:
- Volume imbalance (who’s more aggressive, buyers or sellers?)
and
- Iceberg tracking
This gives you higher confidence when deciding whether to fade, follow, or stay out of the trade.
Conclusion
So, before reading this article, were you a trader who chased every big order in the book? If it’s a YES, you must have fallen into traps multiple times! But now, you understand that large visible size looks convincing, but many times it’s just “phantom liquidity”. These are bait walls that were never meant to be filled.
Thus, to gain a market edge, you must learn how to spot:
- Sudden liquidity pulls
- Fake walls that vanish at the last second
- Spoofing behavior that manipulates order flow
Always remember that the real skill isn’t just avoiding these traps! Instead, it’s knowing how price reacts around them and using that knowledge to fade weak moves or wait for true liquidity to return.
Want to precisely spot fake liquidity? Advanced real-time market analysis tools, like Bookmap, make this easier by letting you see what’s real versus what’s just noise! Don’t let phantom size fool you. Use Bookmap to read the full depth of market intent.
FAQs
1. Is spoofing illegal?
Yes! In regulated markets like US stocks and futures, spoofing is illegal. For those unaware, it refers to the act of placing large orders with no intent to trade.
However, sometimes traders cancel orders for risk management, which isn’t illegal. If you are just starting out and don’t use any market analysis tool, it may still look like fake liquidity to you.
2. Does fake liquidity happen in crypto?
Yes, it does! Many crypto markets are unregulated, and “bait walls” in their order books are more common. Several big players often use them to mislead retail traders. This is done by creating a false sense of demand or supply.
3. How can I know if a wall is real or fake?
The truth is, you can’t be 100% sure! But there are clear signs to watch:
- A “real wall” usually stays firm and gets filled when the price reaches it.
- On the other hand, a “fake wall” often disappears just before price contact.
To make precise observations, you can start using Bookmap. It shows whether liquidity is actually being hit, pulled away, or quietly refreshed. This allows you to spot phantom liquidity versus genuine buying or selling interest.
4. Can fake liquidity cause flash crashes?
Yes! Let’s say a large block of visible liquidity disappears suddenly. Now, due to this, the price can move sharply. This happens because there aren’t enough real orders left to slow it down (lack of resistance). Usually, this leads to quick price drops or spikes.
5. Should I trade against fake liquidity?
Not every fake wall is a trading signal, so you shouldn’t blindly trade against them! As a trader, you should have the knowledge to spot when you’re seeing spoofing vs real orders.
If we talk about specific market cases, let’s assume in a trading session, you observe that liquidity disappears, + a breakout looks weak. Now, here, fading the move can be profitable. Other times, it’s safer to wait for confirmation.
Sign Up Now