See flash crash more clearly in real time.
Compare plans to access deeper market visibility for flash crash.
Education
August 25, 2025
SHARE
What Causes a Flash Crash? Inside the Mechanics of Sudden Market Drops
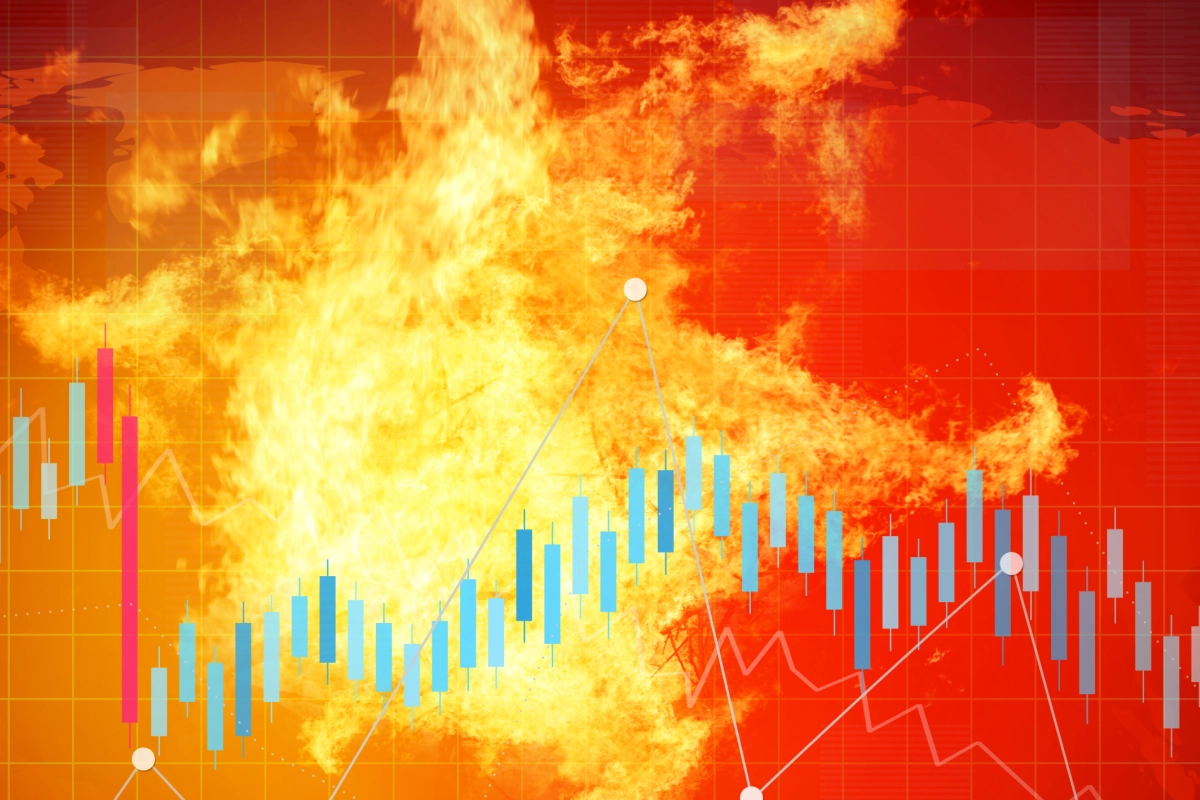
One moment, the price is calm. The next—total freefall. No news. No time to react. Welcome to a flash crash! In this crash, you get a mix of panic, algorithmic trading, and prices nosediving in seconds.
Yes, they are chaotic! But, are they really random? Can you predict them? More importantly, can you find trading opportunities in crashes?
Read this article till the end to find your answers! In this article, you will understand what causes a flash crash, how it unfolds, and when it’s most likely to happen. You’ll also learn the real mechanics behind sudden market drops, study famous examples like the 2010 crash, and get some proven tips to protect yourself. Let’s begin.
What Is a Flash Crash?
A flash crash is a sudden and extreme drop in the price of a financial asset or even the entire market. Such a crash happens within seconds or minutes. Later, sometimes, prices bounce back quickly after the drop, but it doesn’t always happen.
Do you feel these events are random? No, they’re not accidents! A flash crash usually happens when there’s a “structural imbalance” in the market. Study the graphic below to learn what that means:
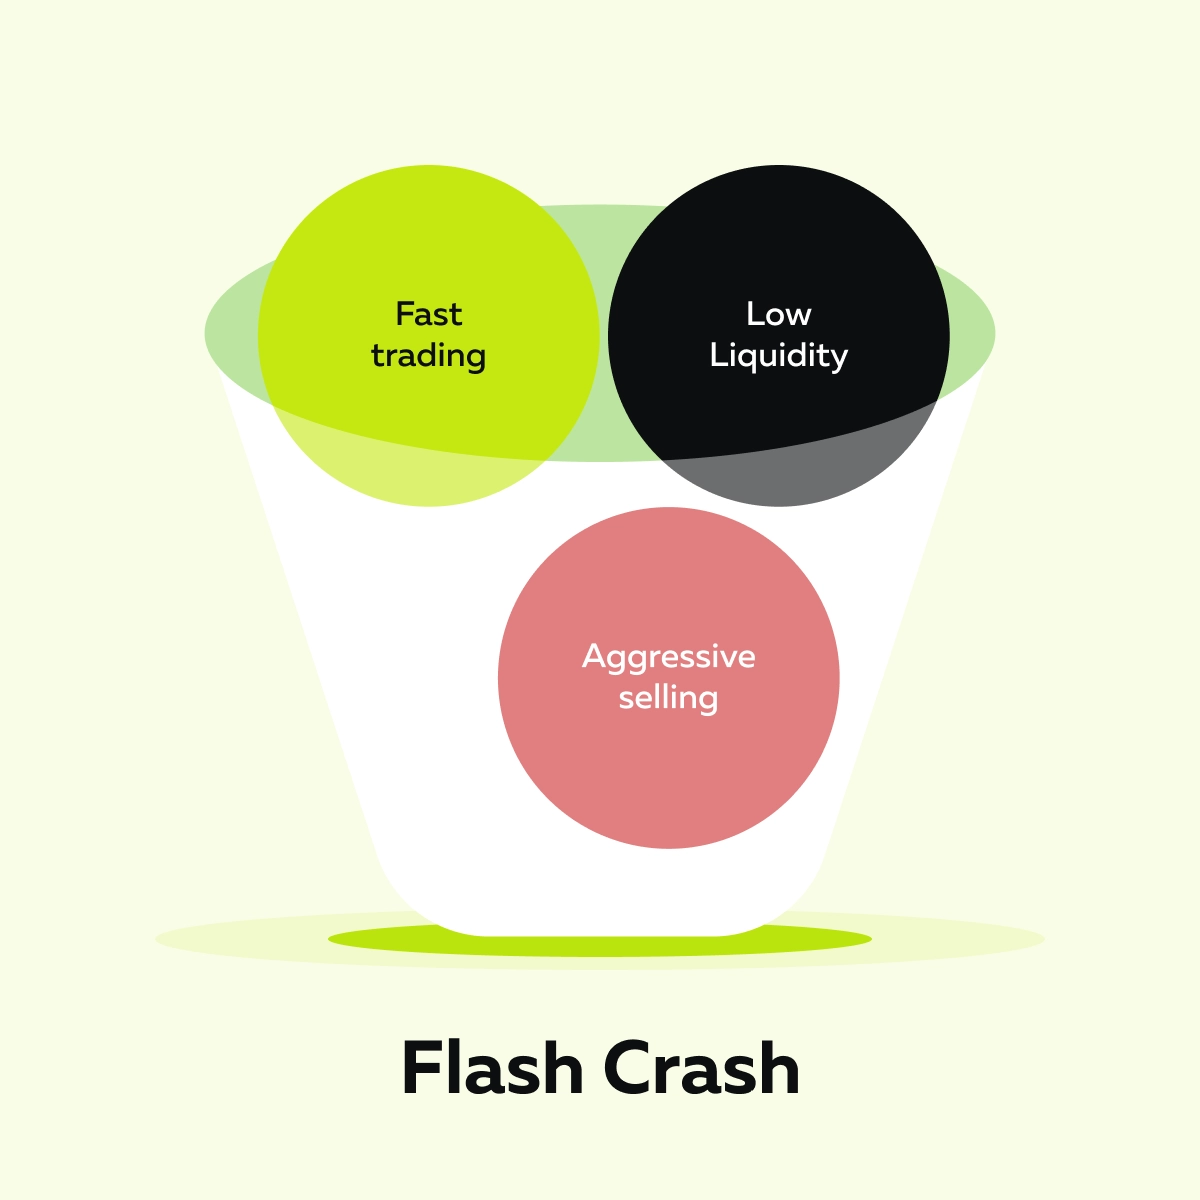
Want to visualize this imbalance? Think of it like this – let’s say too many people try to exit a crowded room through a small door at once. The result? Total chaos. Similarly, a sudden market drop occurs when there’s a rush of sell orders, but not enough buyers. This causes prices to collapse in seconds.
Is it even real? Yes, one of the most famous examples is the May 6, 2010 flash crash. In this event, the Dow Jones dropped nearly 1,000 points in just a few minutes! Later, it recovered most of it shortly after. That incident shook both investors and regulators.
Please note that it’s a myth that flash crashes are always caused by a:
- “Fat finger” mistake
or
- Rogue algorithm.
Often, it’s due to liquidity gaps, where the normal flow of buyers and sellers breaks down. Be aware that in markets like futures trading, speed and automation are everything. In such a setup, this kind of imbalance gets amplified fast!
The Mechanics Behind a Flash Crash
A flash crash doesn’t just happen out of nowhere! Let’s see why these crashes unfold behind the scenes in real-time markets:
Liquidity Disappears
Want to know one of the biggest reasons behind a sudden market drop? Mostly, this happens when liquidity vanishes. For those unaware, liquidity means how easily you can buy or sell something without moving its price too much. But during quiet times like lunch hours, after market close, or holidays, there are fewer buyers and sellers. This makes the market more fragile!
If no one wants to buy at the current price, the price has to fall quickly to attract buyers. This is how a flash crash starts!
How to spot it? You can actually see this happen with our avant-garde real-time market analysis tool, Bookmap. Bookmap’s visual heatmap shows areas where large buy orders are waiting (called resting bids). During the flash crash, this area suddenly fades! This signals that buyers are pulling their orders just before the price dumps.
Compare Bookmap packages for futures traders
Aggressive Selling Hits a Thin Market
Let’s say someone places a huge market sell order, either manually or through an automated trading system. But, there’s not enough liquidity (buyers) to handle that order. In such a case, the system starts selling at lower and lower prices!
It’s like someone shouting “fire” in a packed theater with only one exit! As a result, everyone rushes to sell at once, which again causes panic and chaos. Consequently, a flash crash scenario is created.
To make it worse, many traders place stop orders just below key price levels. When the big sell order hits those stops, they trigger automatically. This adds more selling pressure and causes the price to fall even faster.
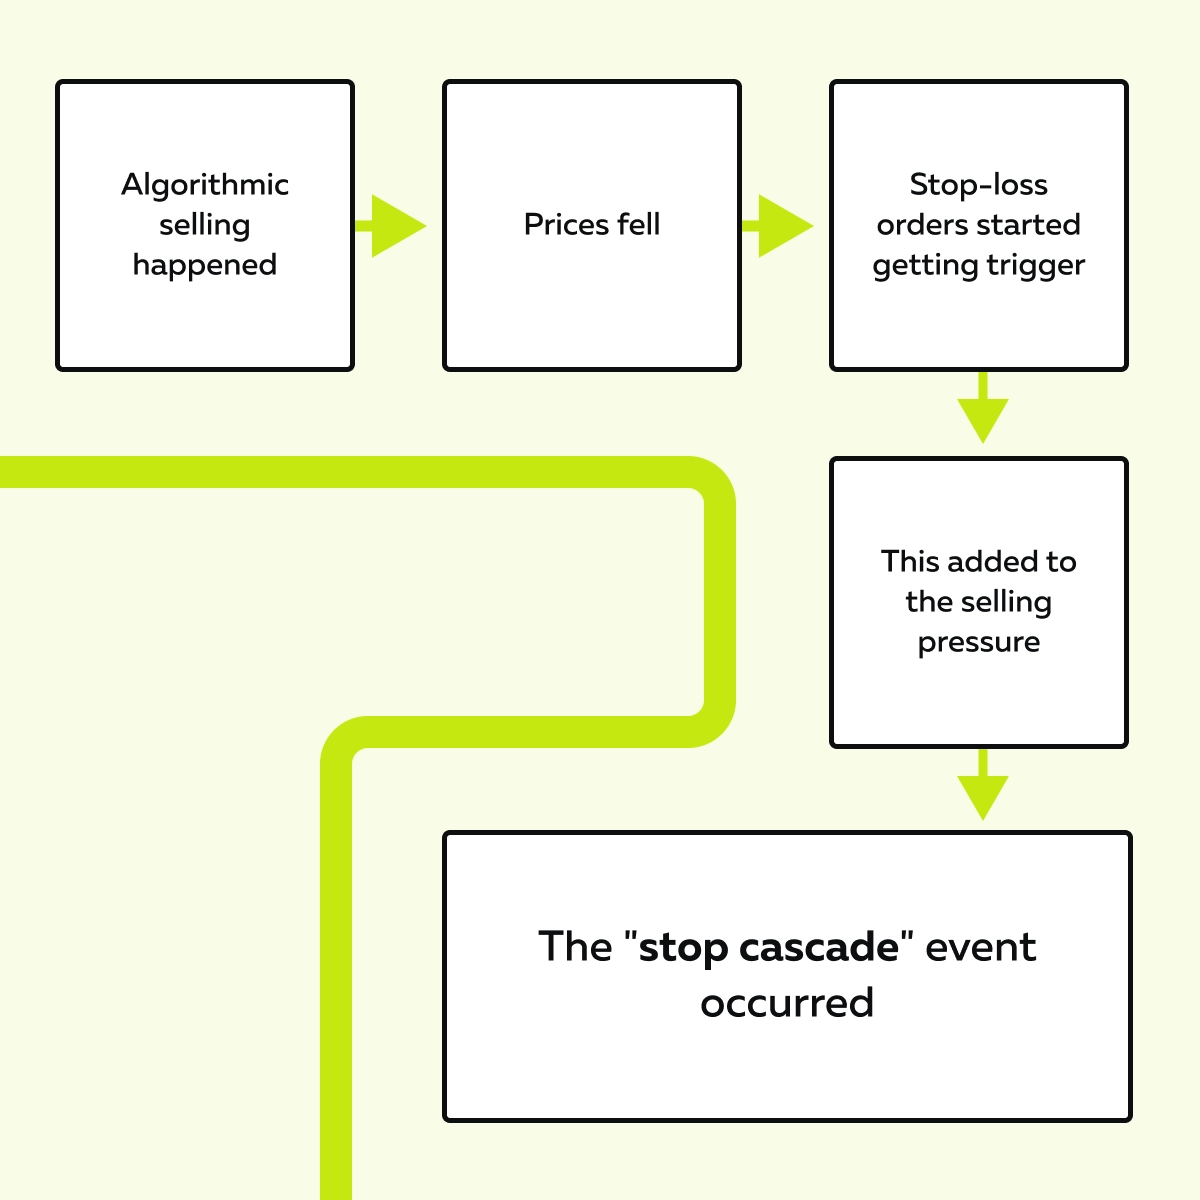
Stop Cascades Amplify the Move
To protect themselves from big losses, most traders often use stop-loss orders. These are automatic instructions to sell if the price falls below a certain point. Sounds smart, right? But do you know what happens when many traders place their stops around the same levels? – They unintentionally become fuel for a flash crash.
Let’s see what happens:
- Let’s say the price drops and hits one stop-loss order.
- This triggers an automatic sale, and a selling pressure gets created.
- This pressure pushes the price lower, which triggers the next stop.
- After some time, the next lower stop gets triggered, and then the next one.
- It seems like falling dominoes, doesn’t it?
- This is called a stop cascade!
- This cascade massively accelerates a sudden market drop.
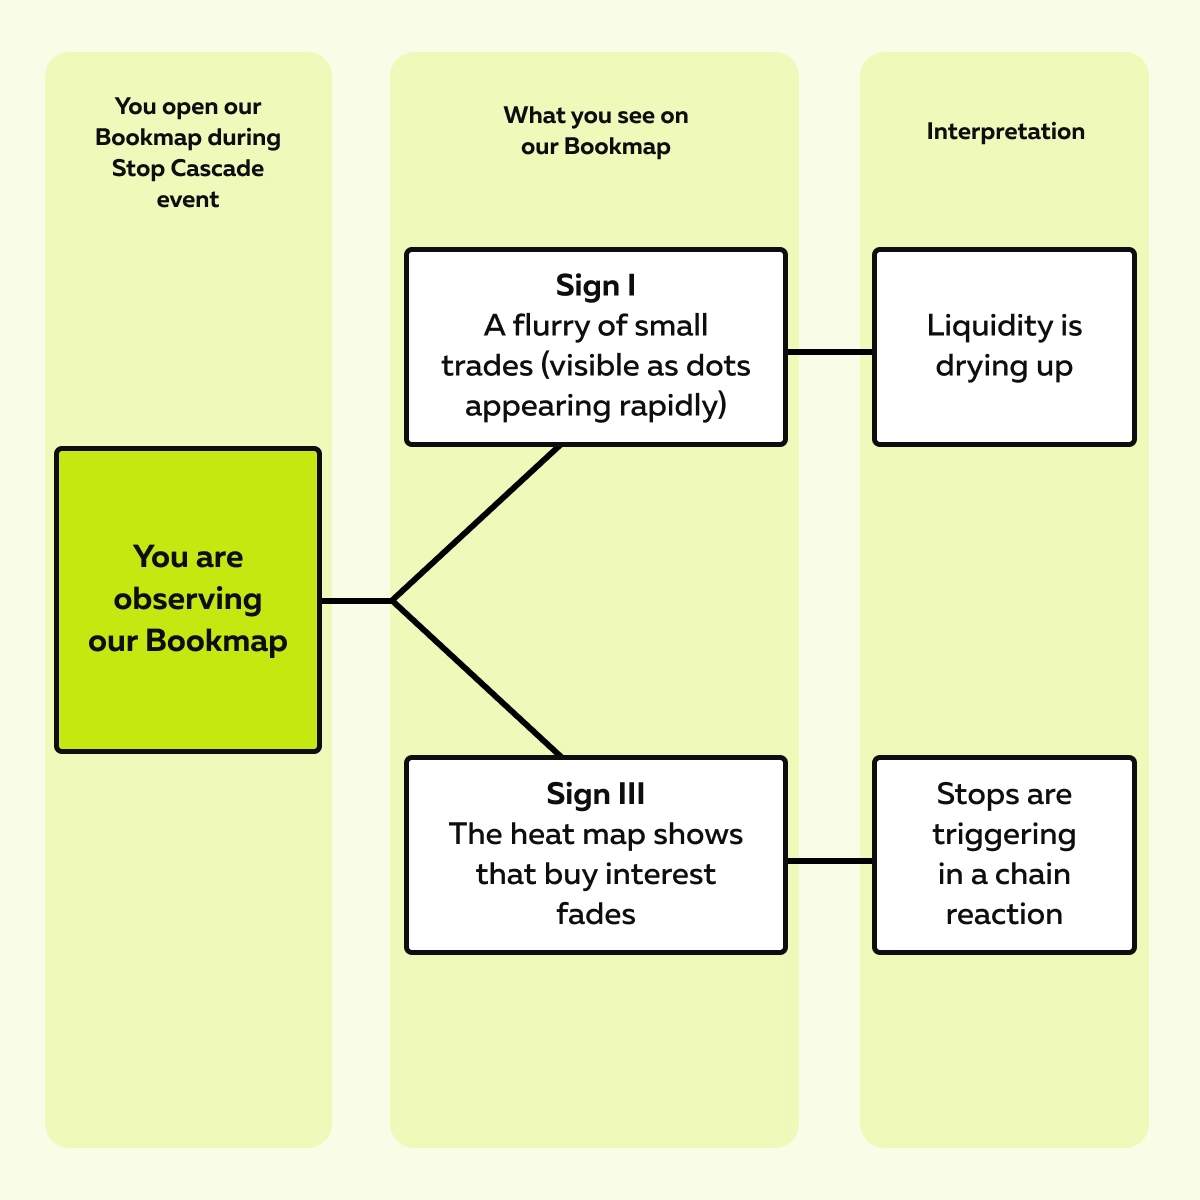
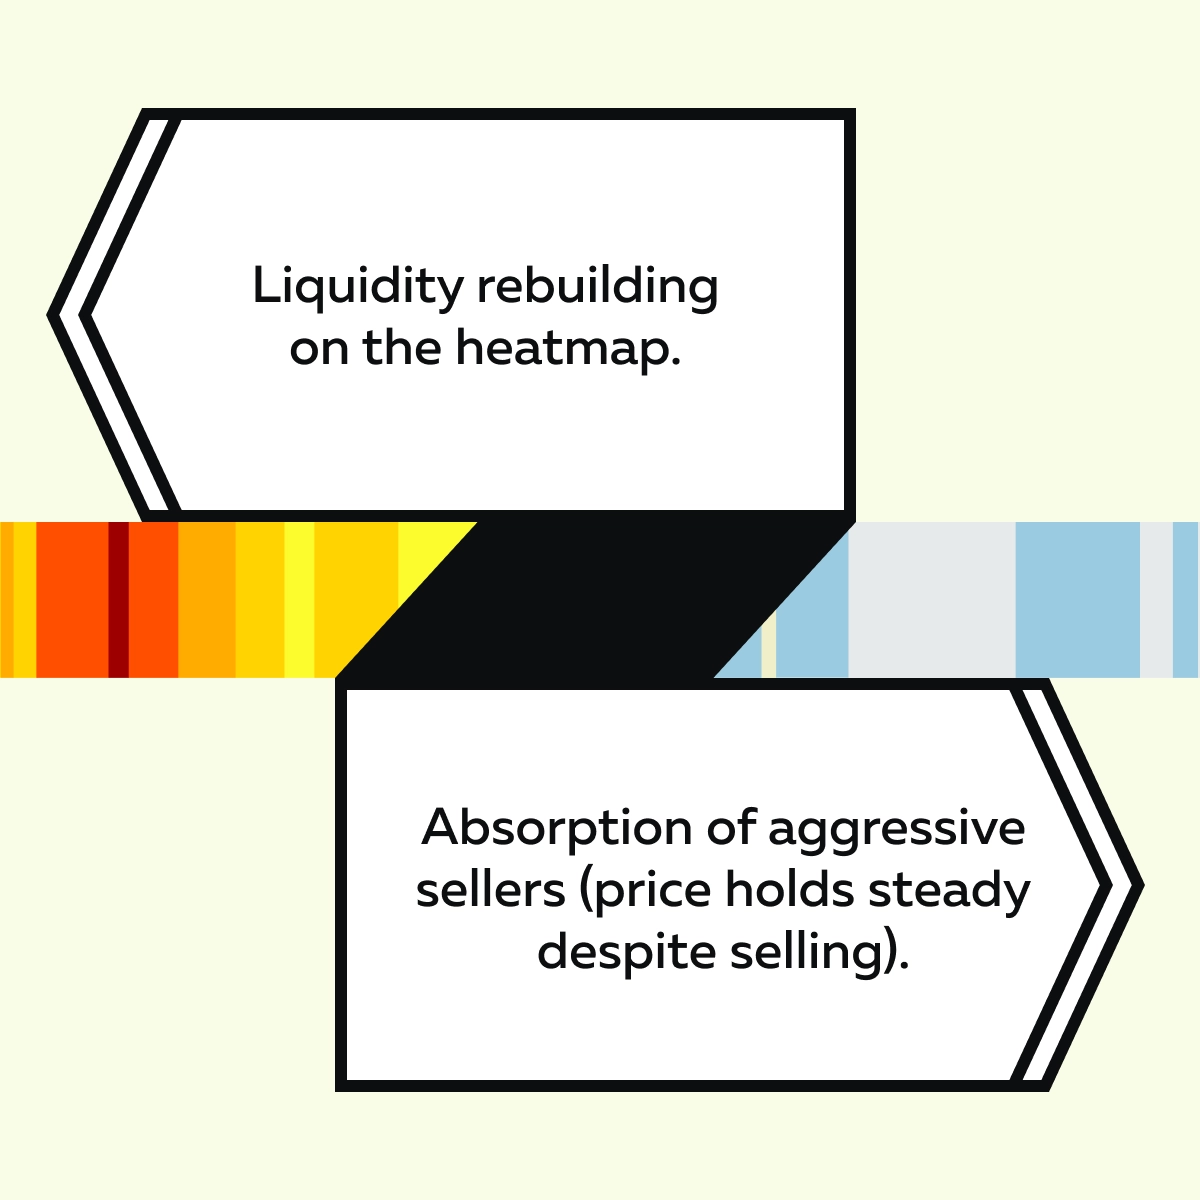
On our advanced market analysis platform, Bookmap, you, as a trader, can see this happening! On Bookmap, you will see these two signs:
Market Makers Step Back
For those unaware, market makers are the professionals who constantly provide buy and sell prices to keep the market running smoothly. They act as liquidity providers! These professionals offer to buy when others want to sell and vice versa.
However, during flash crash trading, market makers often pull back! Why? They don’t want to get caught on the wrong side of a crashing price. This event is called “stepping back.”
The effect? When market makers step back, the last line of passive liquidity vanishes. Without these players holding the market together, prices freefall even faster. This continues to happen until a new wave of buyers sees value and steps in to stop the crash.
Learn how to track sudden shifts in volume and liquidity.
Real Example of a Flash Crash
To truly understand how a flash crash works, you must study a real-world example! One of the most shocking and studied incidents in financial history happened in 2010. It changed how people think about market stability forever!
The 2010 Flash Crash (Equities)
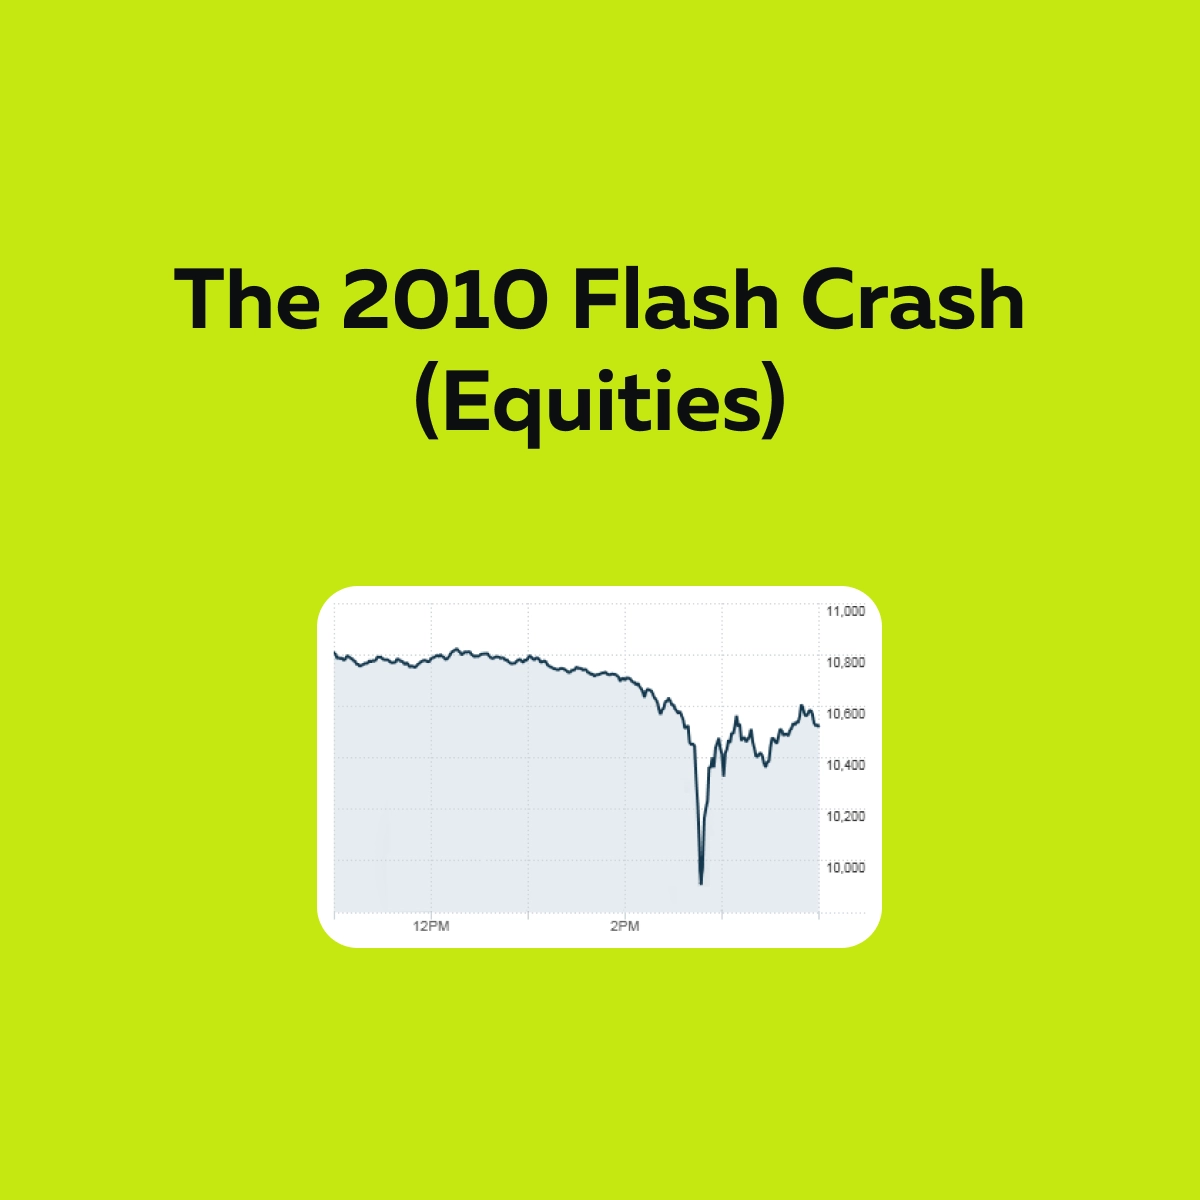
On May 6, 2010, the U.S. stock market experienced one of the most severe crashes ever. The Dow Jones Industrial Average dropped almost 1,000 points (about 9%) in just a few minutes, but it rebounded just as quickly later.
What Caused It?
Surprisingly, there was no major news or global event behind the crash! Instead, the trigger was a large algorithmic sell order in the E-mini S&P 500 futures market. An algorithm was set to sell based on:
- Volume
and NOT
- Price.
Following this rule, it dumped a huge number of contracts into a market that was already showing signs of thin liquidity. Now, since there weren’t enough buyers, prices dropped rapidly. Let’s see what happened next through the graphic below:
Now, at the same time, market makers stepped back! They pulled their bids to avoid losses. With both active selling and disappearing liquidity, the market had nothing to slow the fall. This sudden market drop spread across:
- Stocks,
- ETFs, and
- Options.
The impact was so huge that some of these assets were even temporarily traded for pennies before bouncing back. However, minutes later, the prices recovered! But the 2010 flash crash shook investor confidence.
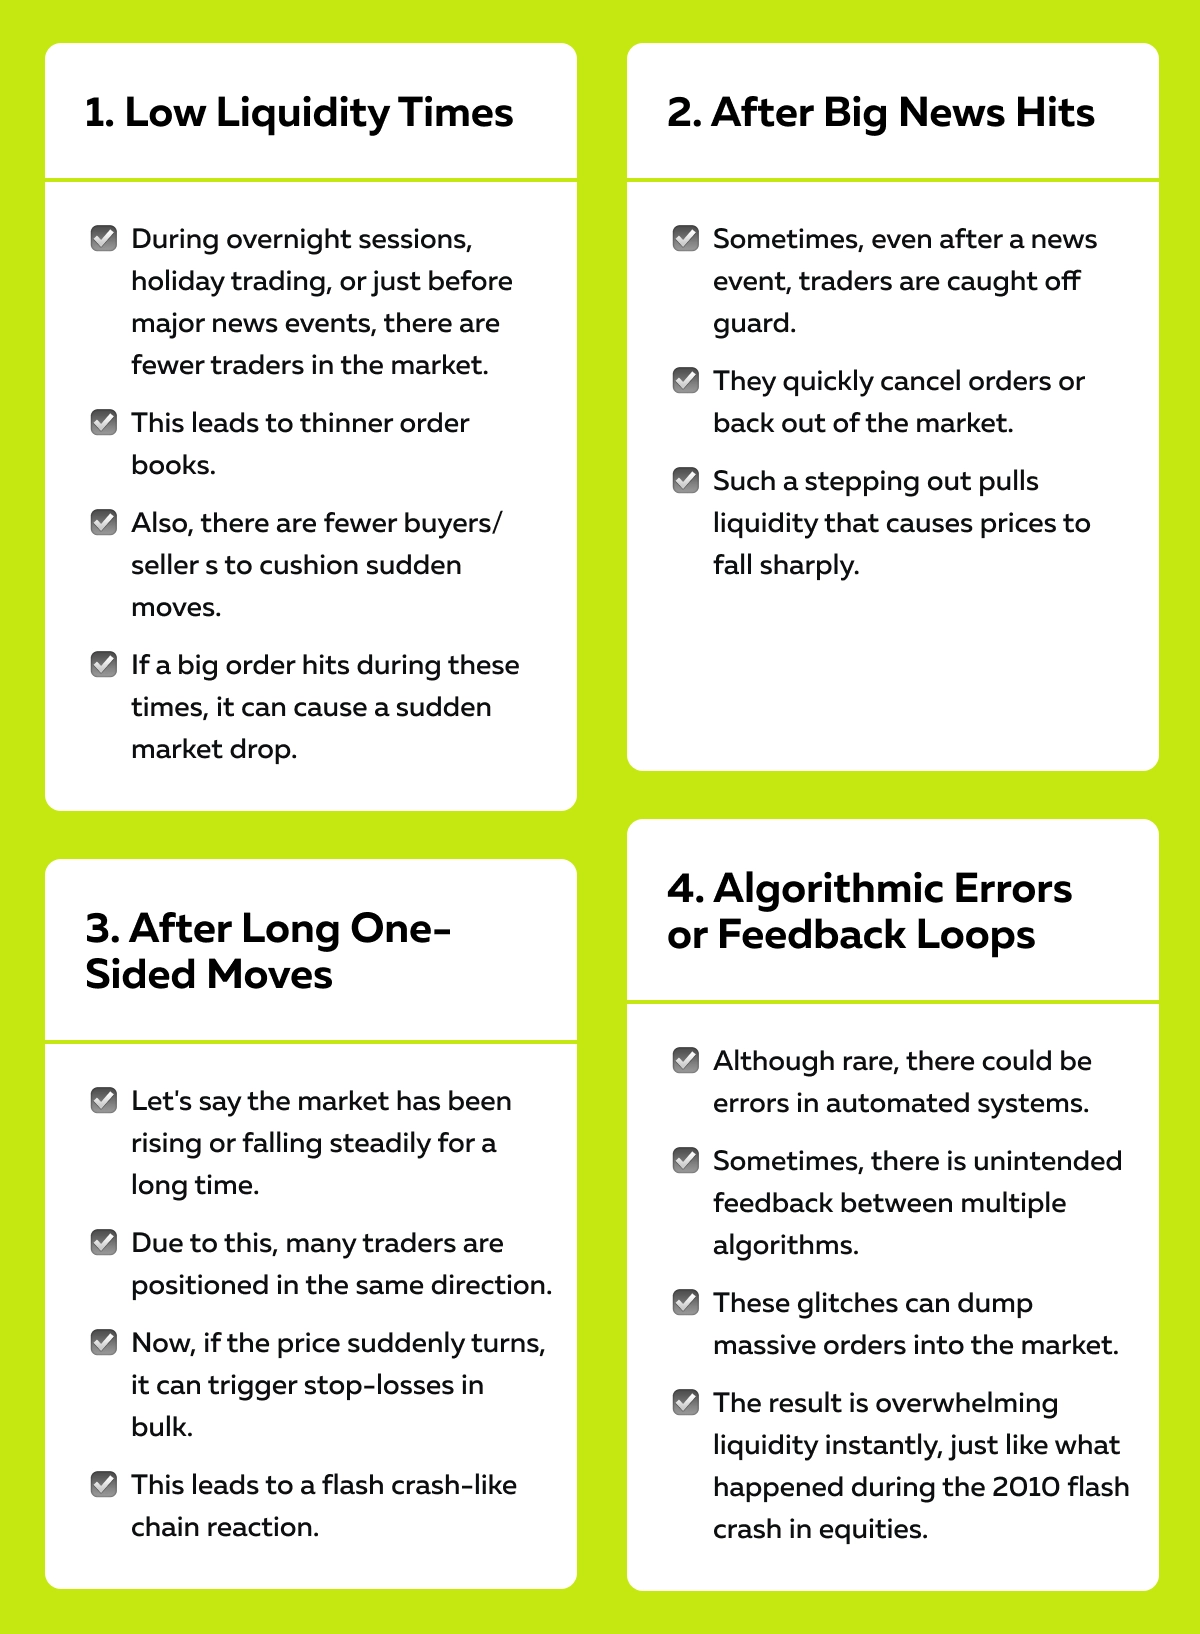
When Are Flash Crashes Most Likely to Happen?
Flash crashes usually happen during fragile market conditions. As a trader, you must realize that these aren’t totally random events! They usually occur when key factors like liquidity, trader behavior, or volatility line up in the wrong way.
Let’s become aware of four specific times when flash crash trading risks are the highest:
How to Protect Yourself During Flash Events
Flash crashes are hard to predict! But you can still prepare. Let’s see how you can manage risk when flash crash futures or stocks are at risk of instability:
A) Don’t Use Tight Stops in Thin Markets
Using a small stop-loss (like just a few ticks) might work during regular hours. However, it does not work in thin and volatile markets like premarket or after-hours. That’s because in those conditions, even normal price noise can hit your stop!
Need a tip? Use wider stops or avoid hard stops altogether. Instead, monitor the price and exit manually when you see signs of real selling pressure, and get an order flow confirmation.
B) Use Order Flow to See Liquidity Disappearing
Before a flash crash, there are usually warning signs! Using our avant-garde real-time market analysis tool, Bookmap, you can spot them:
- The heatmap fades. This shows that large buy orders disappear.
- Resting bids vanish seconds before the drop.
- Aggressive sellers appear, but there’s no one to absorb the selling.
These are signals that a “liquidity gap” is forming. Please note that it is a key ingredient in many flash crashes.
C) Avoid Trading During Obvious Risk Windows
Certain economic events are known to shake up the markets, such as:
- CPI (inflation data),
- FOMC (Federal Reserve decisions), and
- NFP (jobs report).
During these times, price moves can be unpredictable and sharp. Your best tactic? Step back! Wait for the first wave of chaos to pass. Only consider trading once the market starts to stabilize and liquidity returns.
D) Watch for Reversals After the Dust Settles
Not all flash crashes bounce back! But many do. Once the forced selling is over and real buyers step in, you might find a low-risk opportunity for a reversal trade. Want to know the signs of a safe setup? Check out the graphic below:
As a trader, you should remain patient and watch for these clues! By doing so, you can avoid getting trapped and may even profit from the recovery.
Conclusion
Flash crashes may seem like total chaos —and in the moment, they are. However, are they truly random? Not quite.
Why? Because most flash crashes follow a certain structure. They usually happen when liquidity vanishes, aggressive selling starts to happen, and no one is there to take the other side of the trade.
Please note that it’s not always about market manipulation! Usually, it’s just the result of how thin markets react under pressure. As an active futures trader or a simple observer, you must understand what causes a flash crash. This knowledge can let you stay safe or even find an opportunity when others panic.
Want to gain a huge advantage? Start using our advanced real-time market analysis tool, Bookmap. With real-time order flow, heatmaps, and volume dots, Bookmap lets you see liquidity disappearing before price drops. In most cases, this visibility is the edge you need. Want to see how liquidity vanishes in real time? Try Bookmap free
FAQ
1. What is a flash crash in futures?
A flash crash in futures is a sudden and steep drop in price that happens within seconds or minutes. It’s usually caused by a mix of:
- Low liquidity,
- Aggressive sell orders, and
- A wave of stop-loss orders triggering one after another.
You must note that futures markets are fast and often automated. Thus, even small imbalances quickly snowball into a sharp and unexpected drop.
2. Can flash crashes be predicted?
No, flash crashes can’t be predicted with exact timing! But there are warning signs:
- You will see large buy orders being pulled from the order book.
- This pulling leaves less support below the current price.
- At the same time, aggressive sellers start pushing the market lower.
Want to spot these signs? You should watch modern order flow tools, like our advanced market analysis tool, Bookmap. With them, you can spot these signs before the market suddenly drops.
3. Are flash crashes dangerous for traders?
Yes, flash crashes can be very risky! This risk particularly increases for short-term traders:
- Using tight stop-losses
or
- Leaving passive orders in the market.
What happens in flash crashes? Mostly, prices fall so fast that your stop gets triggered at a worse level, or your order gets filled in a sudden move. This lack of liquidity during a flash crash causes large slippage and unexpected losses.
4. How can I avoid getting caught in one?
To avoid getting caught in a flash crash, you must avoid trading during low-liquidity times like:
- Pre-market,
- Post-market, and
- During major news releases.
Also, start using our advanced market analysis tool, Bookmap, to monitor order flow in real time. On Bookmap, you can clearly see when big orders are vanishing and no one is willing to buy. That’s a major red flag! Remember that staying alert can help you step aside before the crash hits.
Sign Up Now