Ready to see the market clearly?
Sign up now and make smarter trades today
Education
August 25, 2025
SHARE
What Happens When Book Liquidity Disappears? How to Trade Air Pockets
Price moves like it’s been shot out of a cannon — but barely any volume shows up. You’re not watching momentum; instead, it’s liquidity vanishing.
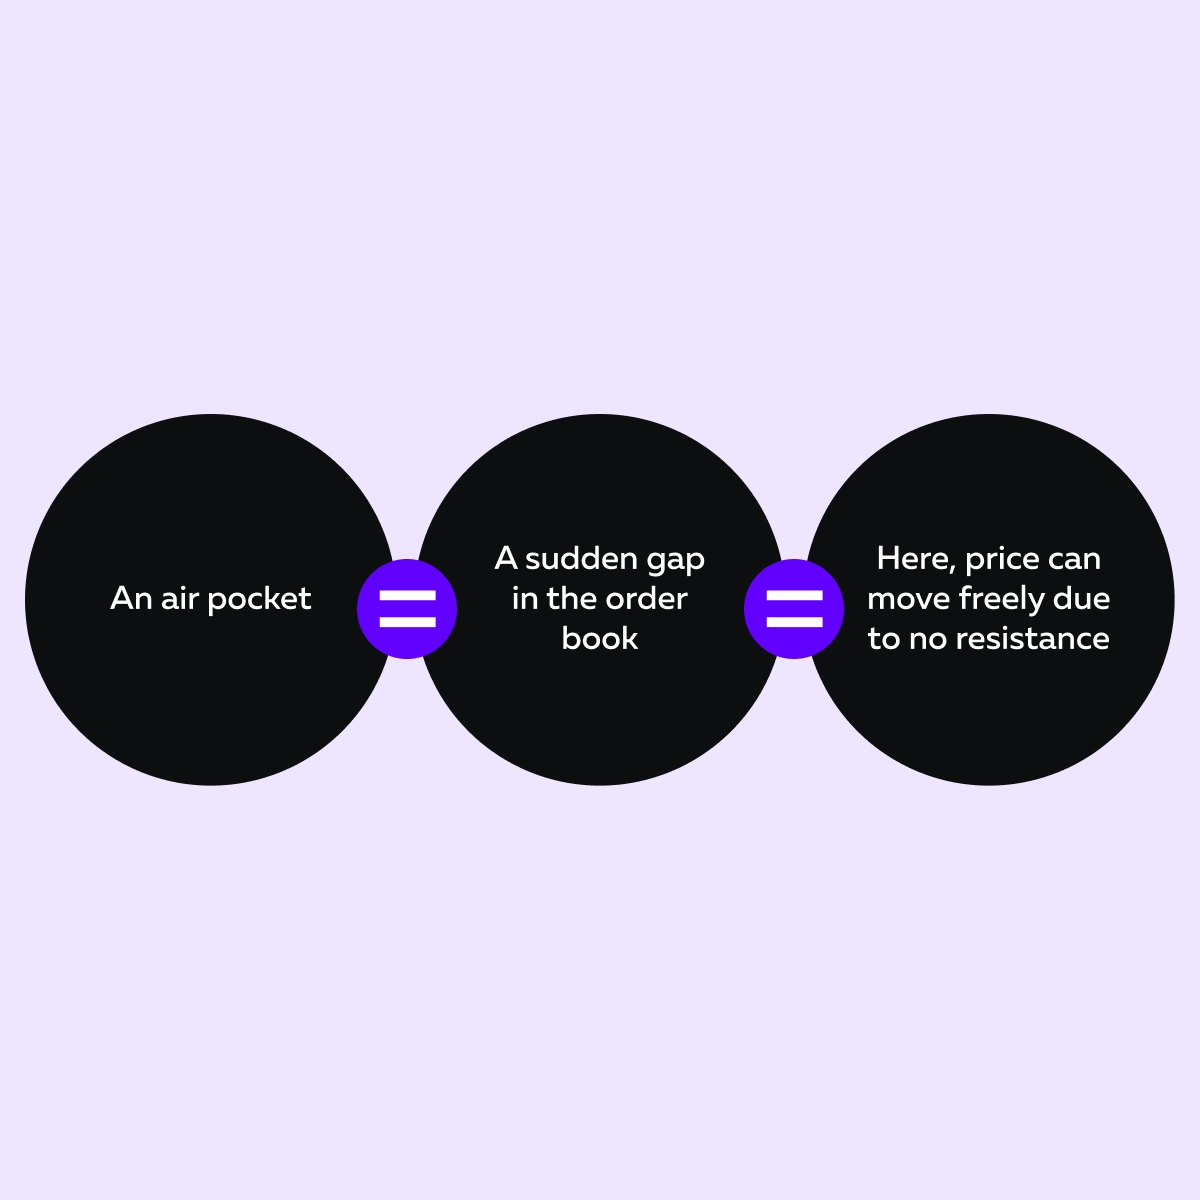
As a trader, how many times have you seen this happen? A sudden price spike—but no volume. Ever wondered why? Welcome to the world of air pockets. These are sudden gaps in the order book where price runs wild due to missing buyers or sellers. Are they dangerous? Absolutely. Can these moments create trading opportunities? Also, YES. Want to exploit them as a trader?
In this article, you will understand why book liquidity disappears, and what causes it, from news events to spoofing to risk reduction. Next, you’ll learn how to spot thinning liquidity using our advanced real-time market analysis tool, Bookmap. Also, we will share some proven strategies to avoid getting trapped in fake moves. Read this article till the end to trade air pockets profitably!
What Is an Air Pocket in the Order Book?
An air pocket in the order book gets created when there’s suddenly very little or no visible buying or selling interest, also called resting liquidity, at certain price levels. You can think of the order book like a ladder of price levels. These ladders are filled with buyers and sellers. However, when an air pocket appears, a section of that ladder is missing rungs. There’s no one standing there to catch the market.
So, what’s the effect? Now, if someone places a market order, particularly a big one, the price can move very quickly through that empty space. It’s like trading through thin air. That’s why this is sometimes described as “trading air pockets,” because the price drops or jumps with very little resistance.

But when do these air pockets form? It has been observed that these zones form:
- Right before major news like economic data (e.g., CPI numbers),
- During earnings announcements, and
- Near important breakout levels, where traders pull their orders to wait and see what happens.
Why You, As A Trader, Must Remain Cautious?
When book liquidity disappears, it creates danger and opportunity! Why? This is because there aren’t enough limit orders (passive liquidity) to slow things down. Due to this, even small trades can trigger huge price moves.
In such a situation, the order book becomes thin. Now, prices can spike or drop dramatically, not because there’s a surge in demand or supply, but simply because there’s no one on the other side of the trade.
For more clarity, let’s study an example:
-
- Let’s say the S&P 500 futures (ES) are trading at 4320.
- You notice some sellers waiting at 4322–4324.
- That’s visible liquidity on a heatmap.
- But a minute before the CPI report comes out, all those sellers pull their orders.
- Suddenly, book liquidity disappears.
- Now, the CPI data hits!
- The price jumps to 4335.
- But here’s the catch! There wasn’t a lot of buying volume.
- The market just flew through an air pocket with no friction.
How can we interpret that? The answer is: the move wasn’t real buying pressure! It was merely a vacuum created by traders stepping out of the way.
Why Liquidity Disappears: Common Triggers
How many times as a trader have you felt that the market just slips through the air? Yes, this happens when book liquidity disappears. During these times, the price fluctuates rapidly with little effort!
Want to know some reasons why this happens? Let’s study some of the most common reasons behind these sudden trading air pockets:
1. News or Event Risk

Before big economic announcements like the Non-Farm Payroll (NFP), CPI, or a Federal Reserve (FOMC) decision, many traders cancel their orders. Why? Because during the news, volatility explodes. And, they don’t want to be stuck in a bad position just because they had a resting limit order in place.
So, even though there may be no clear bullish or bearish bias, liquidity disappears from the order book seconds before the event. This creates a thin market. Now, as mentioned above, even small trades can cause large price spikes or drops due to the formation of classic air pockets.
2. Key Technical Levels
Most traders prefer placing orders around important levels like the:
- VWAP,
- Previous day’s high/low, and
- Support and resistance zones.
However, if prices are charged aggressively toward those levels, many customers will cancel their orders instead of standing firm. This creates a dangerous illusion!
On Bookmap, our advanced market analysis tool, you may have seen a wall of sellers displayed on the heatmap. However, right when the price gets close, the wall is gone. Book liquidity disappears, and the price slices right through. Again, this happens not always because of demand or supply, but because of “vanishing resistance.”
3. Spoofing and Fake Walls

Some players manipulate the market! They place huge visible orders to fake interest at certain price levels. These are known as spoof orders or fake walls. On our real-time market analysis tool, Bookmap, they appear large and intimidating. But they’re not real.
Usually, when the price nears these zones, the orders vanish. This leaves behind an empty space, which is called an air pocket.
How to Detect it?
As a trader, you can use our advanced market analysis tool, Bookmap, to detect this through:
- Fading heatmap intensity
or
- Sudden order flow gaps.
Learn how to spot liquidity changes in real time with Bookmap
4. Front-Running and Risk Reduction
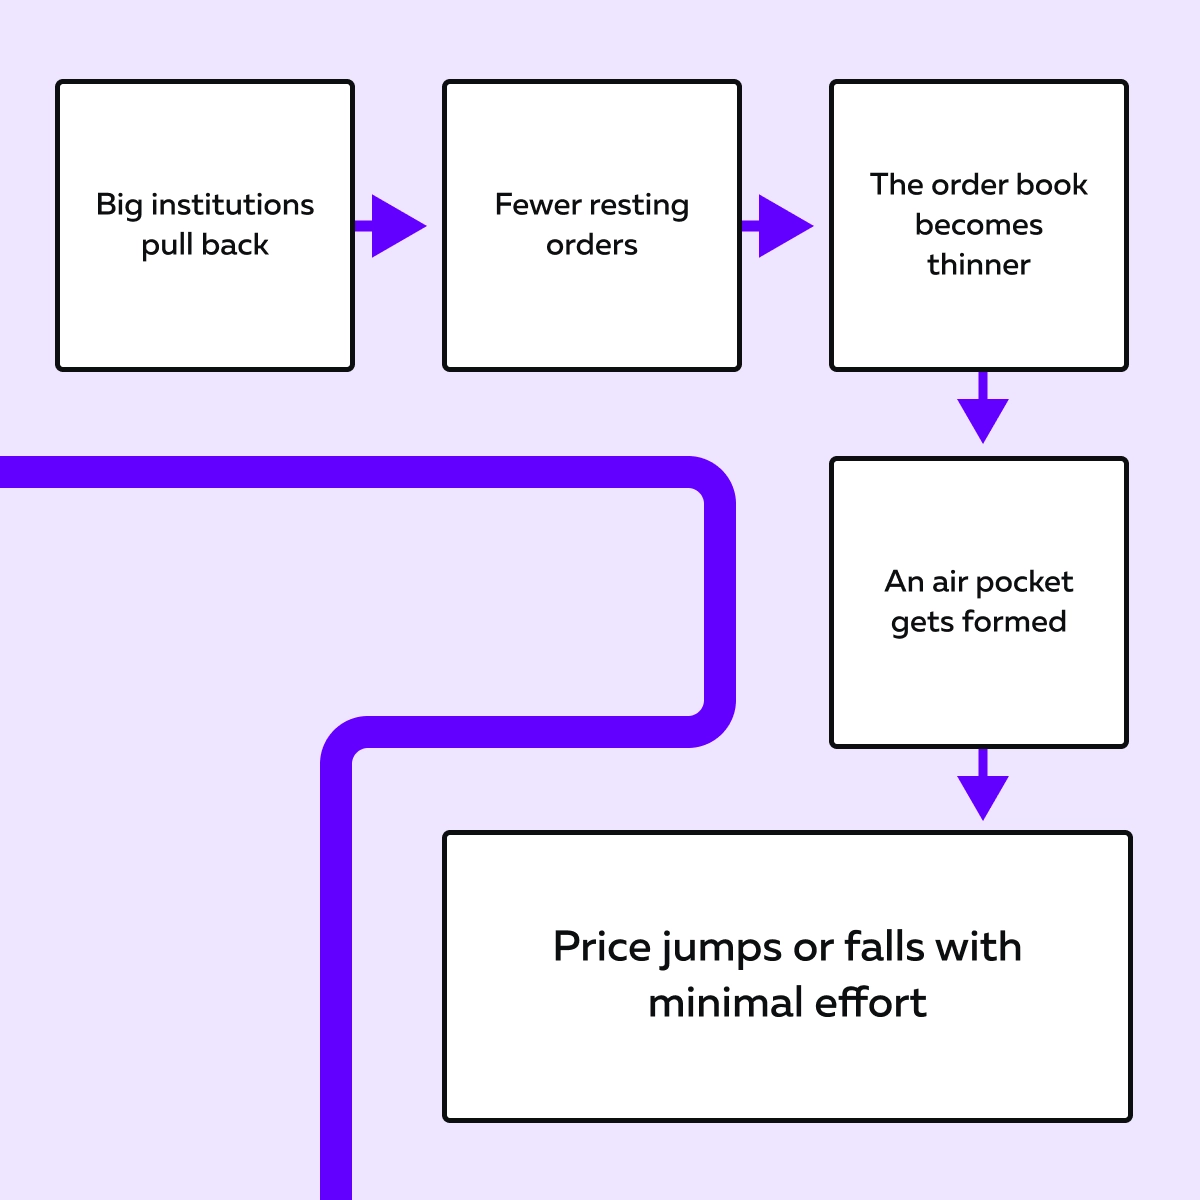
Big institutions don’t want to reveal their hand! That’s because if they leave their orders exposed, smaller traders might front-run them (i.e., trade ahead of them to gain an edge). So, when volatility rises or during thin sessions like pre-market, post-market, or lunchtime, they pull back.
This cautious behavior again causes liquidity to disappear. Let’s see what you’ll notice at this time:

5. Low-Volume Pullbacks That Don’t Attract Liquidity!
Not every air pocket is caused by pulled orders! Sometimes, liquidity just never shows up in the first place. This often happens right after a breakout. Let’s see how it works:
- Let’s say the price breaks out above a key level.
- Traders expect it to keep going.
- But instead, it pulls back!
- Now, assume that the pullback happens on low volume.
- In this case, you’d expect buyers (resting bids) to:
- Step in
and
- Support the price.
- But sometimes, no one does!
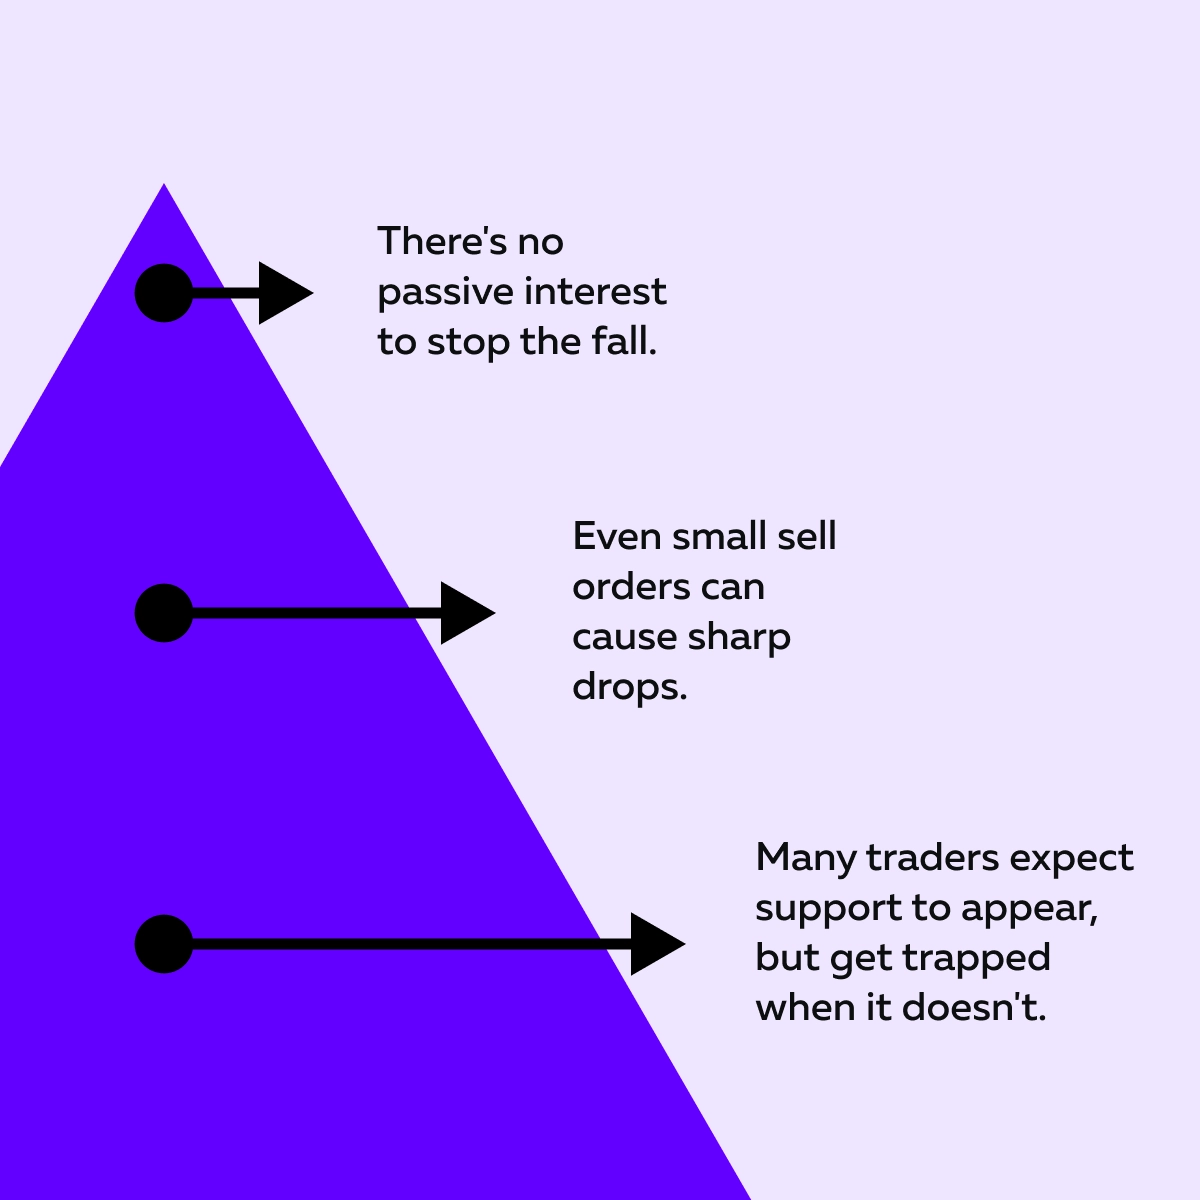
So, was the book liquidity removed here? No, it was never there! The order book stays empty, and no passive liquidity comes to absorb the dip. This creates a vacuum or a classic air pocket. Now, in this zone, aggressive sellers can suddenly push the price lower.
For more clarity, read the graphic below to understand what happens in these air pockets:

This scenario often catches people off guard! That’s largely because a regular candlestick chart won’t show this lack of support. You’ll only notice it if you’re using an advanced order flow tool like Bookmap, which visualizes where real buyers and sellers are (or aren’t).
On Bookmap’s heatmap, you can clearly see the formation of a “pullback without support.” This is your signal – The price is vulnerable! Reversals or deeper dips can now happen. Want to learn how to spot these setups with Bookmap? Understand this pattern today by visiting Bookmap Learning Center.
How to Spot Disappearing Liquidity in Real Time
Want to gain a huge edge? Try to catch disappearing liquidity as it happens! But how? You can easily do so using our avant-garde real-time market analysis tool, Bookmap. Let’s understand how you can spot the signs:
1. Fading Heatmap Zones
On our advanced market analysis tool, Bookmap, strong liquidity appears as bright areas like a glowing wall on the heatmap. For example, a strong sell wall at 4200 might glow bright yellow or orange. But if that level starts turning pale or fades out completely, that’s a warning sign!
WARNING – Book liquidity disappears! Now, the price may fly through that level with no resistance.
2. Sudden Gaps in the Book
Sometimes, on our tool, Bookmap, you’ll notice that areas that previously had strong bid or offer support just go blank. Do you interpret them as a pause? No, those are gaps in the order book!
Traders often cause these gaps by:
- Pulling their orders
or
- Deciding not to engage.
Please note that these are again air pockets, and prices can move erratically through them!
3. No Follow-Up Liquidity After a Move
Let’s say the price breaks out. In a healthy move, you’d expect new buyers or sellers to place follow-up orders. This is called stacking! But what if no new orders appear? It shows a lack of real commitment.
What is it? You must interpret it as a red flag! Let’s see what it signals:

4. Volume Activity Without Resistance
Want to know one of the clearest signs you’re in an air pocket? – The price moves quickly through several price levels without much volume or pause! When you see this, realize that there’s no passive liquidity (no bids or offers) to slow things down. There is just empty space! Now, even small trades can push prices hard in either direction.
Need a Pro Tip?
You should use Bookmap’s alert features! On our Bookmap, you can set alerts for:
- When resting liquidity drops off
or
- When a key heatmap zone weakens.
The advantage? You can professionally spot thinning books or vanishing orders before the price reacts. In this way, you avoid getting caught in a fake move or sudden spike. Get full market depth and historical context with Bookmap’s heatmap.
How to Trade When Liquidity Disappears
When book liquidity disappears, the price fluctuates rapidly! This often happens through trading air pockets where there’s no resistance. Want to survive and profit in such conditions? You need a smart game plan. Let’s see how to trade safely when liquidity vanishes:
1. Avoid Chasing Breakouts Through Thin Zones
Do you feel tempted to jump in when the price is moving fast? It’s normal, but you must remain highly cautious! That’s because when the price surges through an air pocket, it often does so without real support. These moves are unstable!
During these times, if you chase the breakout and it fails, you may find there’s no liquidity to exit safely. That means slippage, bad fills, or worse – getting stuck.
Need a smarter approach? Wait for the price to pull back. After that, observe and see if new liquidity builds at that level. If the book starts stacking again, that’s your confirmation.
2. Use Air Pockets as Caution Zones
As a trader, you should always think of trading air pockets as danger zones! If the heatmap shows a gap or if liquidity is thinning out at key levels, take it as a warning.
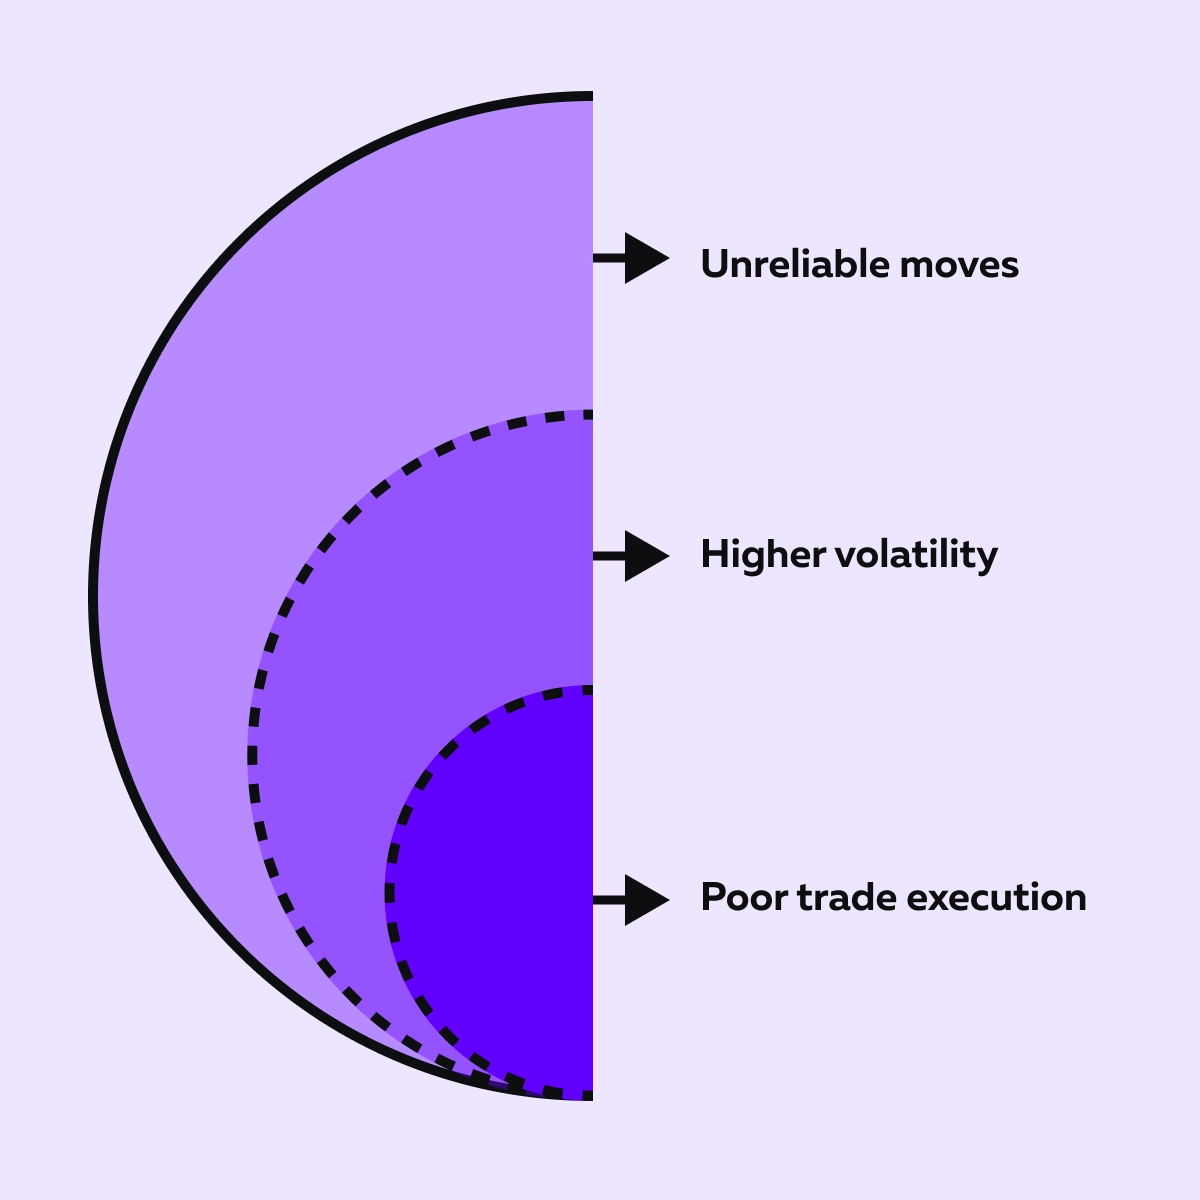
You don’t have to be aggressive! Instead, reduce your position size or stay out altogether. Let’s see what usually happens in thin zones:

Please note that in thin zones, you never get clean entries or exits. On top of it, even small trades can trigger large reactions.
3. Fade Fake Moves Post-Air Pocket
Sometimes, the price will shoot through a level (because of an air pocket) and then instantly stall or reverse. What’s this? Mostly, it is a bull trap or a bear trap. This particularly happens if there was no real volume behind the move.
What do you do when you spot this happening? – You should “fade” the move. This means you take the opposite side of the breakout. As a tip, combine this with absorption signals where large orders stop the price. The benefit is that you might catch a strong reversion.
Be aware that these are often high-probability setups when you know what to look for.
4. Trade with Reduced Size and Clear Exits
When book liquidity disappears, the market becomes more dangerous! Fast moves are fun when you’re right. But they are painful when you’re wrong. That’s why it’s important to use smaller position sizes in thin books.
Also, always have a clear exit plan. If the price turns against you, you may not get a second chance to get out cleanly. Please note that “predefined stops” and “quick reactions” are a must while trading in these zones.
Examples of Air Pockets in Action
Want to make the concept crystal clear? See some examples of how trading air pockets play out in real markets. These examples are based on real-style scenarios that show what happens when book liquidity disappears and how it can trap unsuspecting traders:
Example 1: Pre-FOMC Thinning in ES Futures
Let’s say the S&P 500 futures (ES) are trading near 4280 just before a big Fed (FOMC) interest rate announcement. On our advanced market analysis tool, Bookmap, on its heatmap, you see strong sell liquidity at 4280. There is a clear wall that looks like it will hold prices down.
But suddenly, 30 seconds before the news, that liquidity fades! It’s as if those sellers vanish into thin air. Now the order book is empty in that zone.
- Book liquidity disappears
and
- The market surges up to 4295 on very little volume.
But here’s the trap! That wasn’t real buying. It was just the price slicing through an air pocket. Right after the announcement, the market reverses hard. This catches breakout traders off guard. As a result, those who didn’t notice the thinning liquidity were left with poor entries and no easy exit.
Example 2: Thin Book Reversal in NVDA
Let’s look at NVIDIA (NVDA). It’s approaching the key round number of $1000 with strong upward momentum. On our market analysis tool, Bookmap, you can see green volume dots. This shows that buyers are in control. Additionally, offers (resting sell orders) are visible on Bookmap around $1002 to $1005.
Then, in a flash, those offers vanish! No sellers want to step in just yet.
- Book liquidity disappears
and
- The price flies to $1010 with almost no resistance.
It looks like a breakout, but it’s really a move through an air pocket.
Now, at $1012, something changes! Suddenly:
- Aggressive sellers hit the market (red volume dots on Bookmap)
and
- Hidden orders (called icebergs) absorb the buying.
The result? Price can’t go higher. It reverses sharply! Do you know what just happened? The breakout had no true support. It was just thin liquidity that made the price fly. Real sellers were waiting higher up, and once the price got there, they pounced.
Conclusion
When book liquidity disappears, it signals instability in the market! At the same time, it also creates powerful trading opportunities if you know what to look for. Please realize that a thin order book doesn’t tell you where the price will go, but it does tell you how it will move – Quickly, Unpredictably, and with higher risk.
These sudden movements through trading air pockets can trap traders who aren’t prepared. Need a solution? Our advanced real-time market analysis tool, Bookmap, is a game-changer!
Through our modern market analysis tool, Bookmap, you can see the order book evolve in real time. Not just as a static snapshot, but as a living, moving picture of market intent. With this visibility, you can avoid traps, read price action more clearly, and trade smarter in even the most volatile conditions. Ready to trade with more clarity? Try Bookmap Global or Global+
FAQs
1. What is an air pocket in trading?
An air pocket in trading happens when there are suddenly no buy or sell orders in a certain price range of the order book. Due to no resistance, the price moves through that zone extremely fast (even with small volume).
You can define this event as if the market has fallen into a gap. This causes quick spikes or drops without warning.
2. Why does liquidity vanish before key events?
Before major events like CPI releases, earnings reports, or Fed announcements, many traders pull their limit orders from the order book. Why? They don’t want to get caught in unpredictable price moves caused by the news.
This makes the market “thin.” For those unaware, it means there are fewer orders to slow things down. As a result, the price can move fast in either direction.
3. Are air pockets bullish or bearish?
Air pockets aren’t bullish or bearish by themselves! They’re neutral. But they do increase volatility. When the order book has little to no liquidity, even small market orders cause large price swings.
Due to this, the price can spike or drop suddenly! But why? This does not happen because of strong buying or selling, but simply because there’s no one on the other side.
4. How can Bookmap help with thin liquidity?
By using our advanced market analysis tool, Bookmap, you can see where liquidity is appearing or disappearing in real time. If large orders suddenly vanish or no new ones are added, you’ll notice the book thinning.
The benefit? This knowledge allows you to spot the likely air pockets before the price reacts. Unlike regular charts, Bookmap gives you a clear and visual view of:
- Market depth
and
- Liquidity flow.
