See liquidity more clearly in real time.
Compare plans to access deeper market visibility for liquidity.
Market Analysis
September 5, 2025
SHARE
Stop Watching the Candles: Why Liquidity Is a Better Leading Indicator
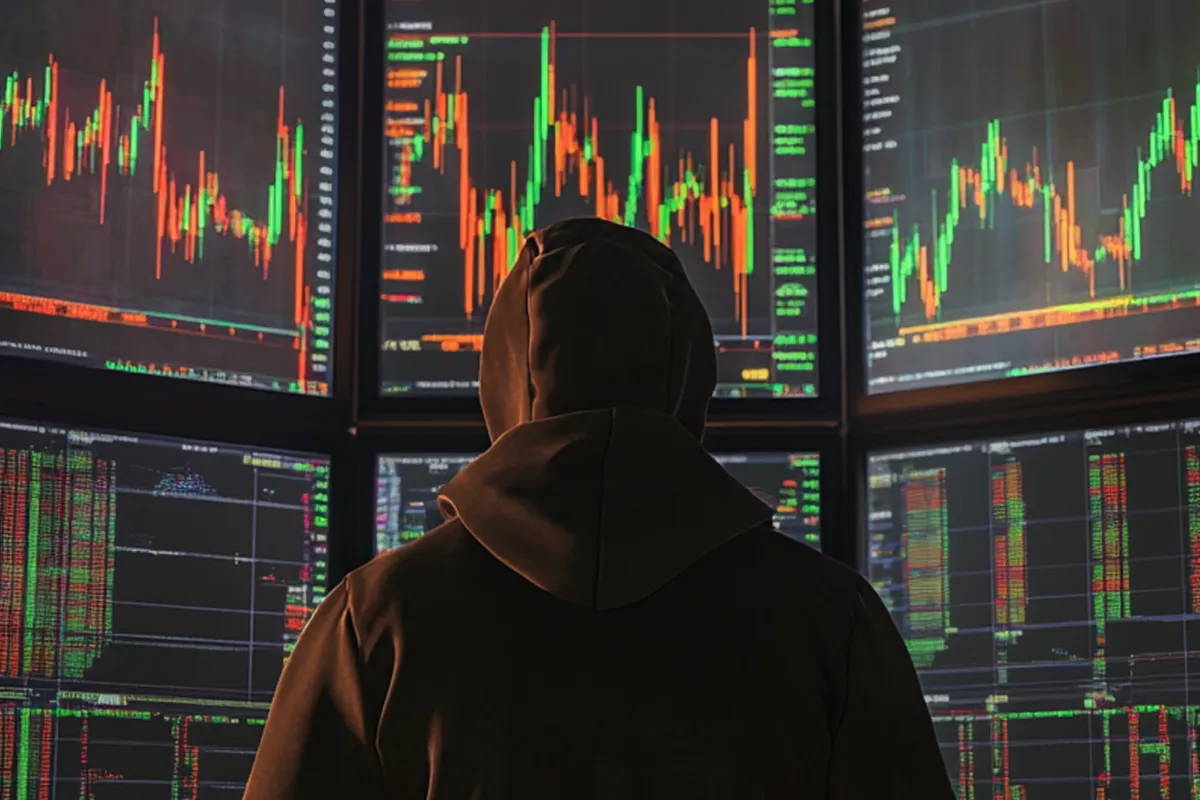
You wait for a green candle to buy and a red candle to sell. If trading were this simple, every trader would be rich by the market close! But want to know the harsh reality? The truth is, by the time a candle closes, the market’s real decisions have already been made. Most of these decisions remain hidden beneath the surface.
As a trader, you must realize that liquidity moves before price! That is why many traders now use liquidity as a leading indicator— to gauge market intent long before the chart confirms it.
Do you want to predict price moves better and avoid traps? In this article, you will see why liquidity is a leading indicator, how to read it, and how our advanced real-time market analysis tool, Bookmap, reveals the market’s liquidity. Make sure to read to the end to improve your trade timing.
Why Candlestick Charts Are Aggregated, Not Leading
Candlestick charts squeeze all the price, volume, and time data from a set period (say, five minutes) into a simple bar. This setup makes it easy to spot general trends. However, since the data is averaged over that time, you lose many small but important details.
A candlestick provides a few basic facts for a set time period, such as:
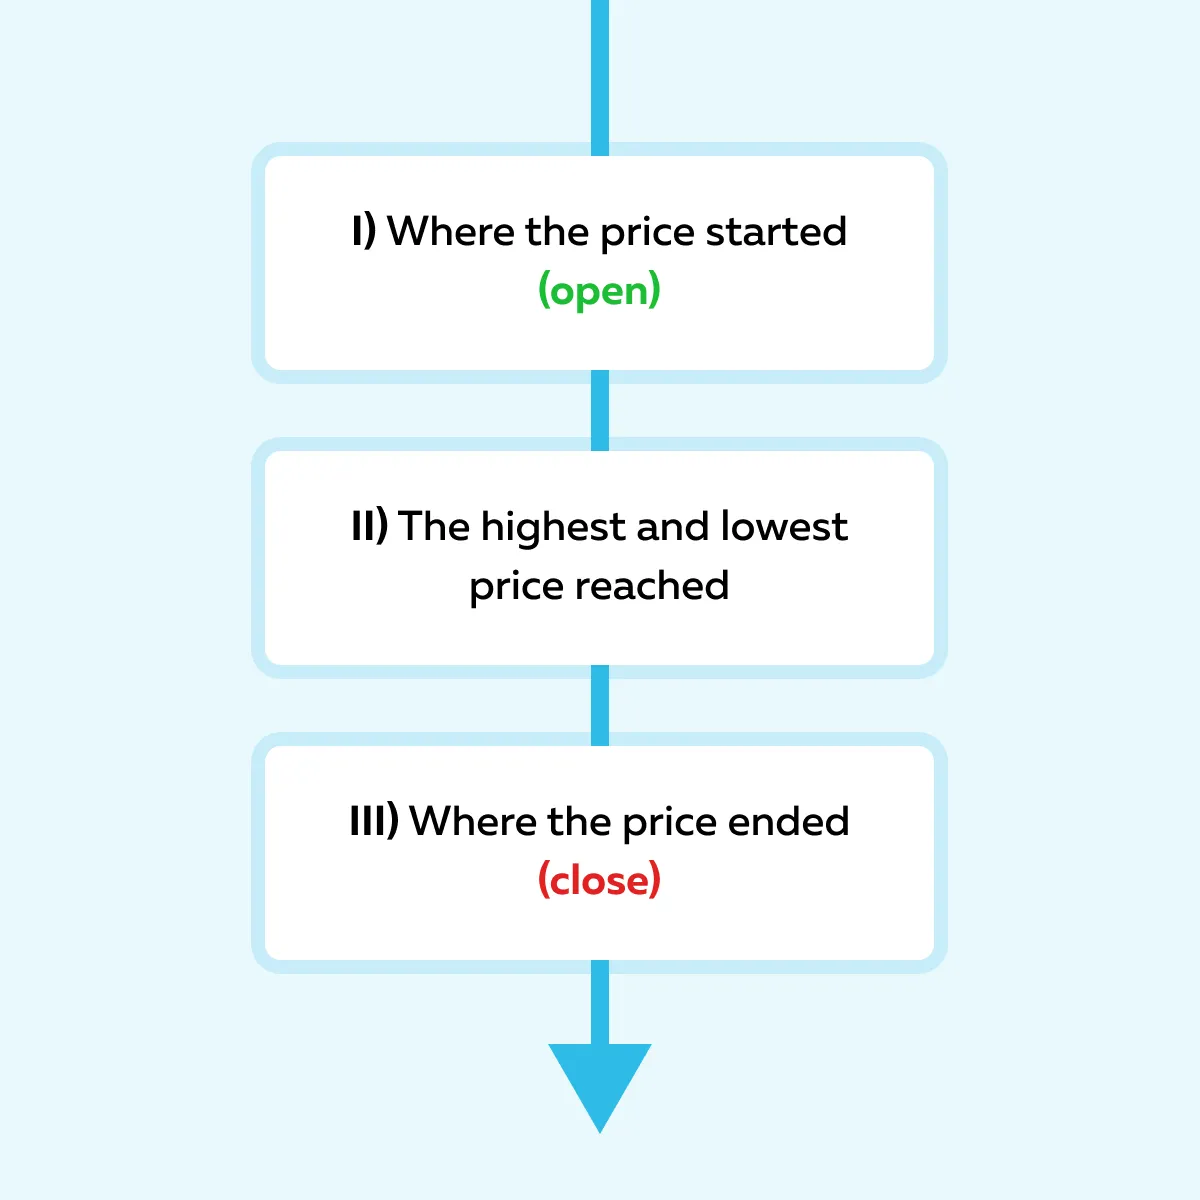
Sometimes you will also see total volume displayed in a separate bar. However, it won’t show where that volume happened. The negatives? You do not get to know the deeper story:
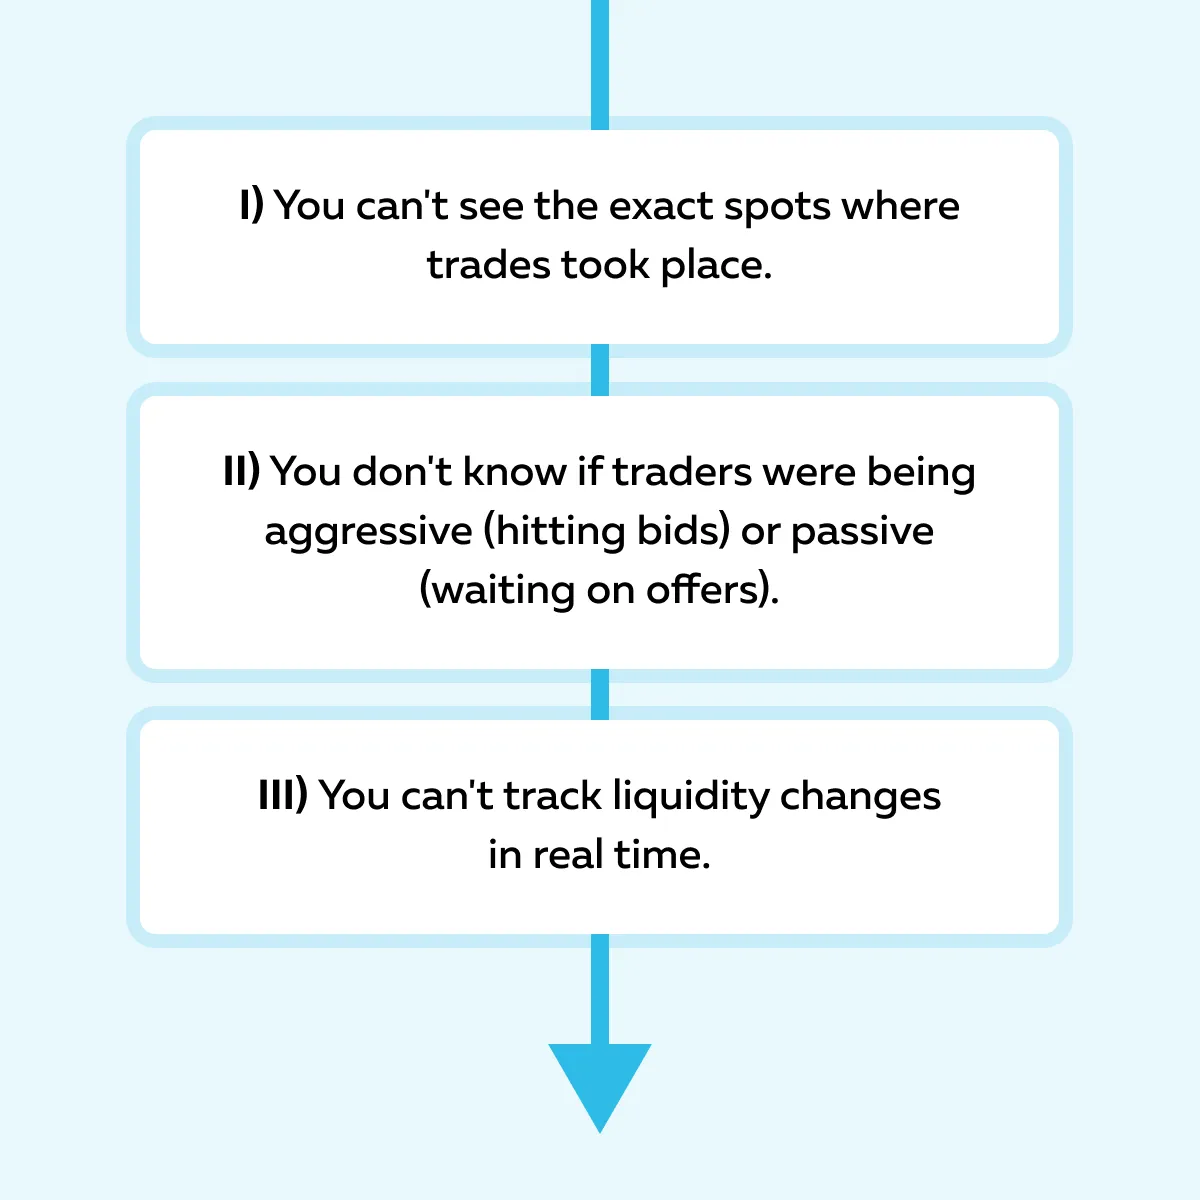
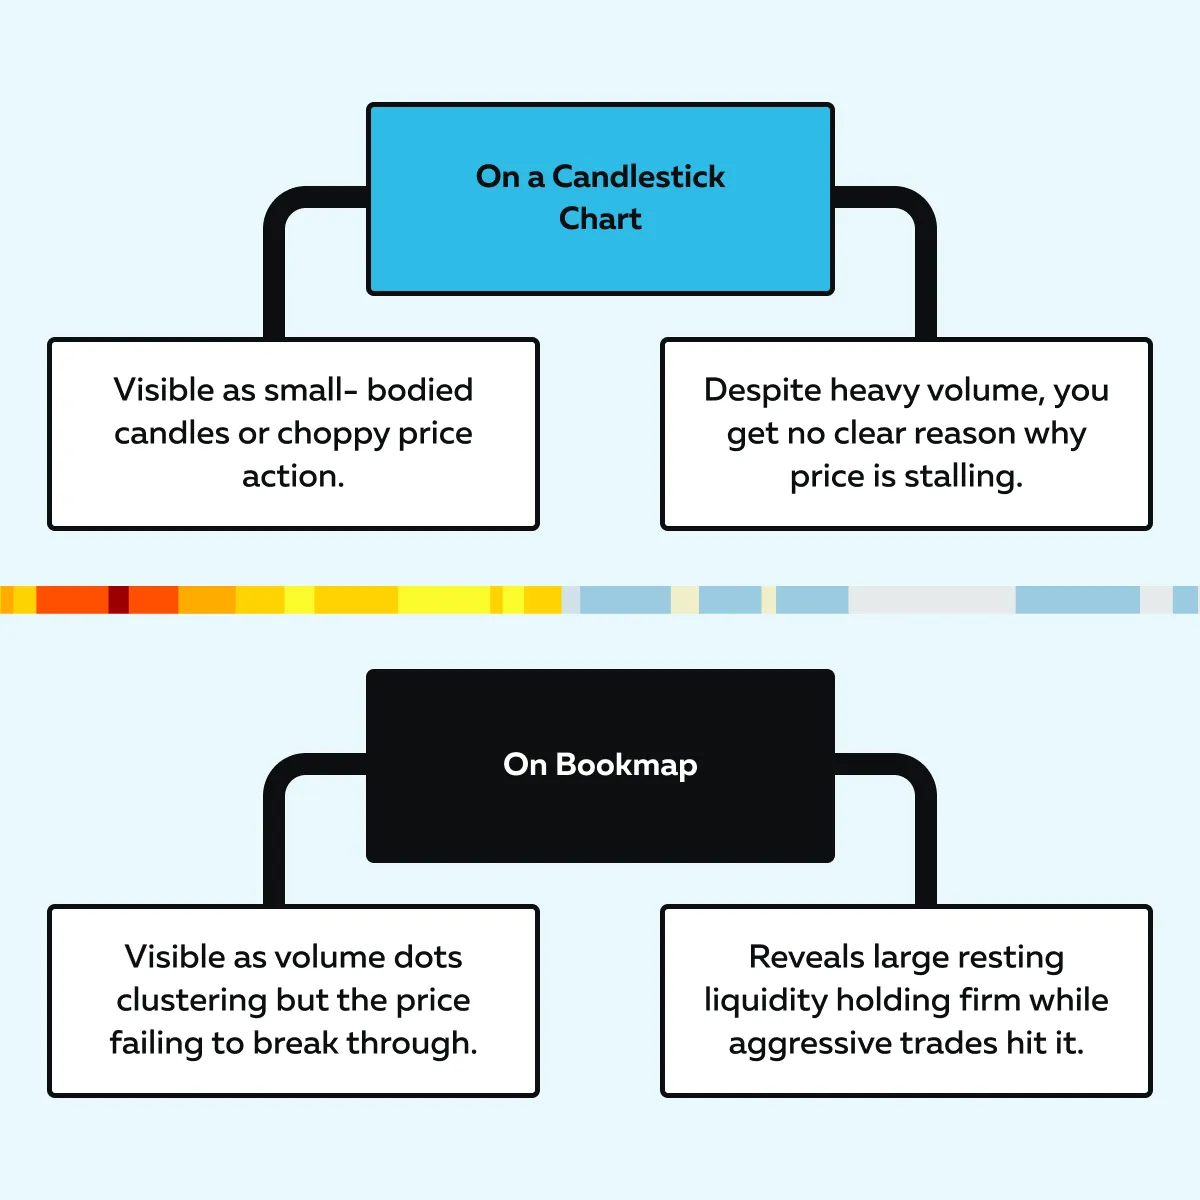
Due to these limitations, big moves happen inside a candle, but you do not know their exact reason. A candle only tells you about the final numbers for that time slice and not what actually drove the move.
Need a Solution? – Our Bookmap Can Help You!
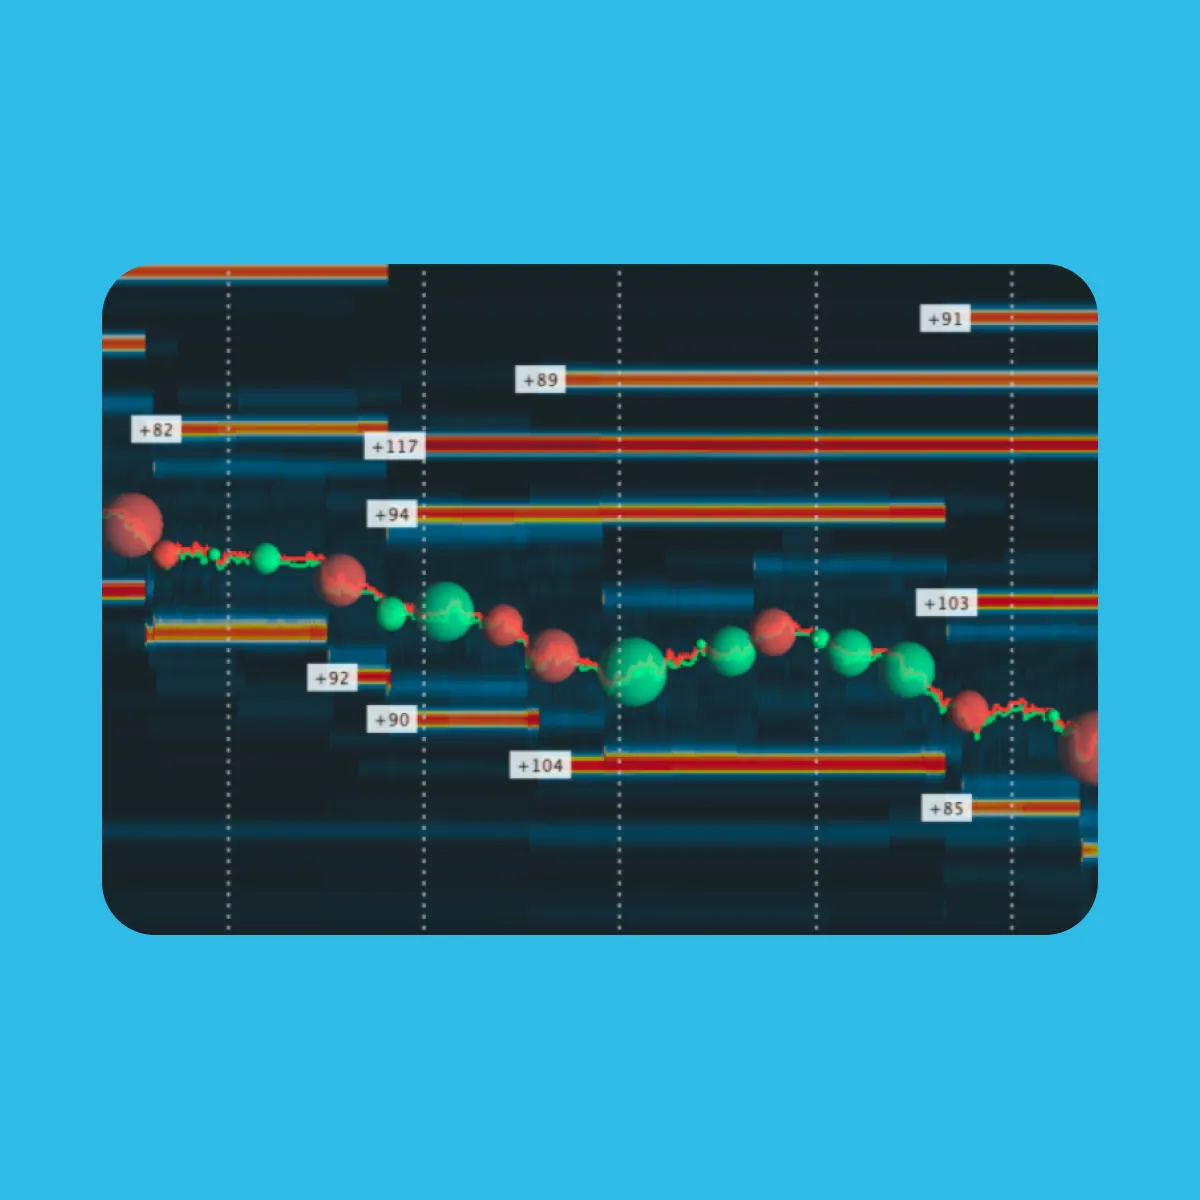
Our market analysis tool, Bookmap, works differently! It does not just give you a summary. Instead, it shows every single market event in real-time. You can see exactly where trades are taking place, whether:
- Buyers are aggressively lifting offers,
or
- Sellers are hitting bids.
You can also observe liquidity movement in real-time, second by second. This way, you are not guessing! On our advanced real-time market analysis tool, Bookmap, you can watch the actual battle between buyers, sellers, and available liquidity.
What Liquidity Shows That Price Doesn’t
Price action tells you what happened. But liquidity shows you what might happen next! And that is why many traders treat liquidity as a leading indicator. As a trader, you must realize that liquidity reveals the market’s intent. It highlights three major results:
| Result I: Pre-trade Levels | Result II: Order Flow Changes | Result III: Hidden Interests and Their Impact |
| Where traders are prepared to buy or sell before the price gets there. | Whether big orders are being added or pulled at key levels. | How visible orders interact with hidden interest, such as iceberg orders or passive absorption. |
But how important are these results? Highly important! Yes, this matters because liquidity can signal expected movement. Let us check out three cases to learn how:
| Case I | Case II | Case III |
|
|
|
Your regular candlestick charts do not show any of this:
- They do not reveal where resting liquidity sits.
- They do not tell you where the actual trades happened.
- They cannot show whether buyers or sellers are truly in control.
Thus, liquidity + volume is the real framework beneath price action. When you can see that structure, you can predict market moves better rather than just reacting after they happen. Don’t trade blind. Compare Bookmap packages and start seeing what candlesticks miss!
Common Scenarios Where Liquidity Leads
Liquidity often moves before price does! Yes, and that is what makes it a powerful clue for traders. By watching how orders appear, disappear, or change, you can easily spot moves that are likely to fail or take off. These shifts can occur even before candlestick charts confirm anything!
For more clarity, check out some common scenarios where liquidity as a leading indicator comes out on top:
Fake Breakouts into Thin Liquidity
Sometimes, the price looks like it is breaking out, but there is no real support from liquidity. For example,
- Let us say, sell orders (offers) above suddenly disappear, or buy orders (bids) below vanish.
- This means the price move has no foundation.
- Thus, the price is more likely to snap back instead of continuing.
Our Bookmap vs. Your Candlestick Charts
Our market analysis tool Bookmap’s heatmap makes this visible in real time. It shows you when liquidity pulls away. Candlestick charts, on the other hand, only show you the result after it has happened.
This is why traders treat liquidity as a leading indicator. It can warn you of a false breakout before the chart confirms it.
Absorption at Key Levels
Sometimes large buy or sell orders hit the market, yet the price barely moves! Why? This means:
- Someone is passively absorbing all that volume,
and
- They are matching every aggressive order without letting the price break through.
For those unaware, absorption signals a reversal or a failed breakout in the making. Now, let us see how it is visible:
This is another reason most traders see liquidity as a leading indicator. It exposes hidden strength or weakness before the price reacts.
Liquidity Shifts Before Big Moves
Do you know what happens right before a major price move? Liquidity often changes first! Yes,
- Large resting orders suddenly disappear (pull) to clear the path,
or
- New orders get stacked to create a wall.
These moves are sometimes intentional and are particularly set ahead of news releases or at major support and resistance levels. Here also, if you watch these shifts in liquidity, you can anticipate moves before they appear on a candlestick chart.
Liquidity as a Leading Indicator: How to Use It
For most veteran traders, liquidity is the market’s blueprint! It shows where trades want to happen before the price follows. You can use liquidity as a leading indicator as follows:
Read this step-by-step guide further for a deeper understanding:
Step I: Prepare your workspace
Use these three things:
- Our market analysis tool, Bookmap’s live order-book heatmap,
- A Time and Sales/ tape view, and
- A simple price chart.
Pick a timeframe that matches your style. Ideally, go for 1 to 5 minutes for scalps, 5 to 30 for intraday, and longer for swing work.
Step II: Identify Real Liquidity Zones [Support / Resistance (S/R) in Real Time]
On our trading platform Bookmap’s heatmap, look for bright “horizontal bands”. Those are big resting orders. After this:
- Note their price and size,
and
- Mark the nearest band above and below the current price as real-time S/R.
Step III: Watch How Heatmap Behavior Changes
Now, you could come across three different situations:
| Situation I: Fades/pulls | Situation II: New blocks / adds | Situation III: Shifting zones |
|
|
|
Step IV: Combine Liquidity with the Tape (Volume + Time) to Read Intent
Firstly, you must understand this:
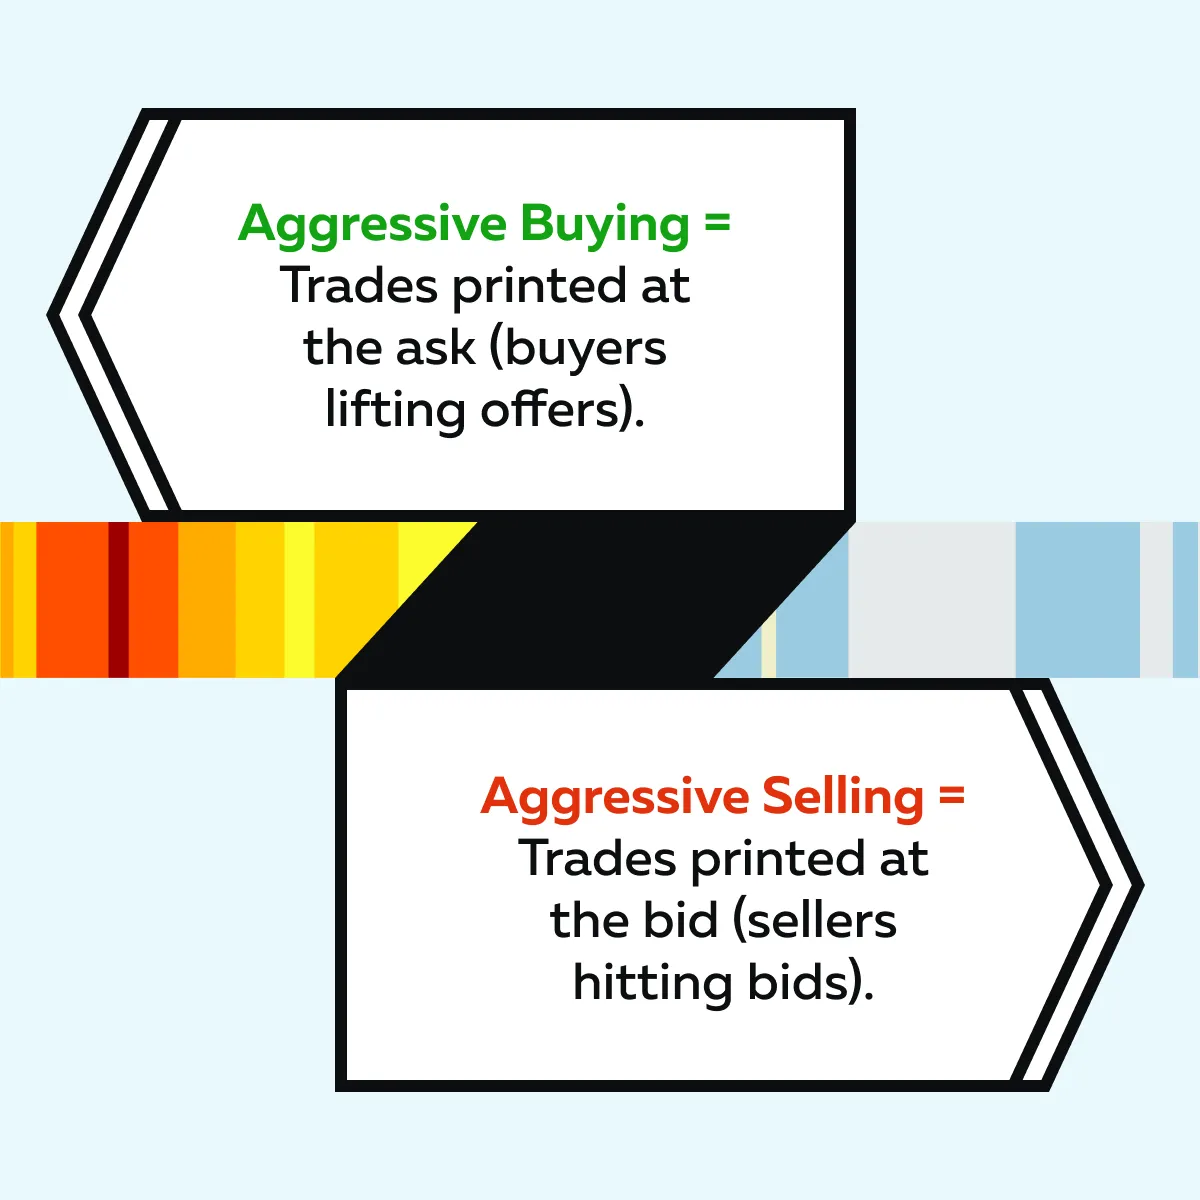
Now, if many aggressive trades eat through an offer band and the band is not replenished, the price usually continues.
In contrast, if aggressive trades hit a band but its size holds (or only shrinks slowly), that’s absorption. Now, there will be a likely reversal or failed breakout.
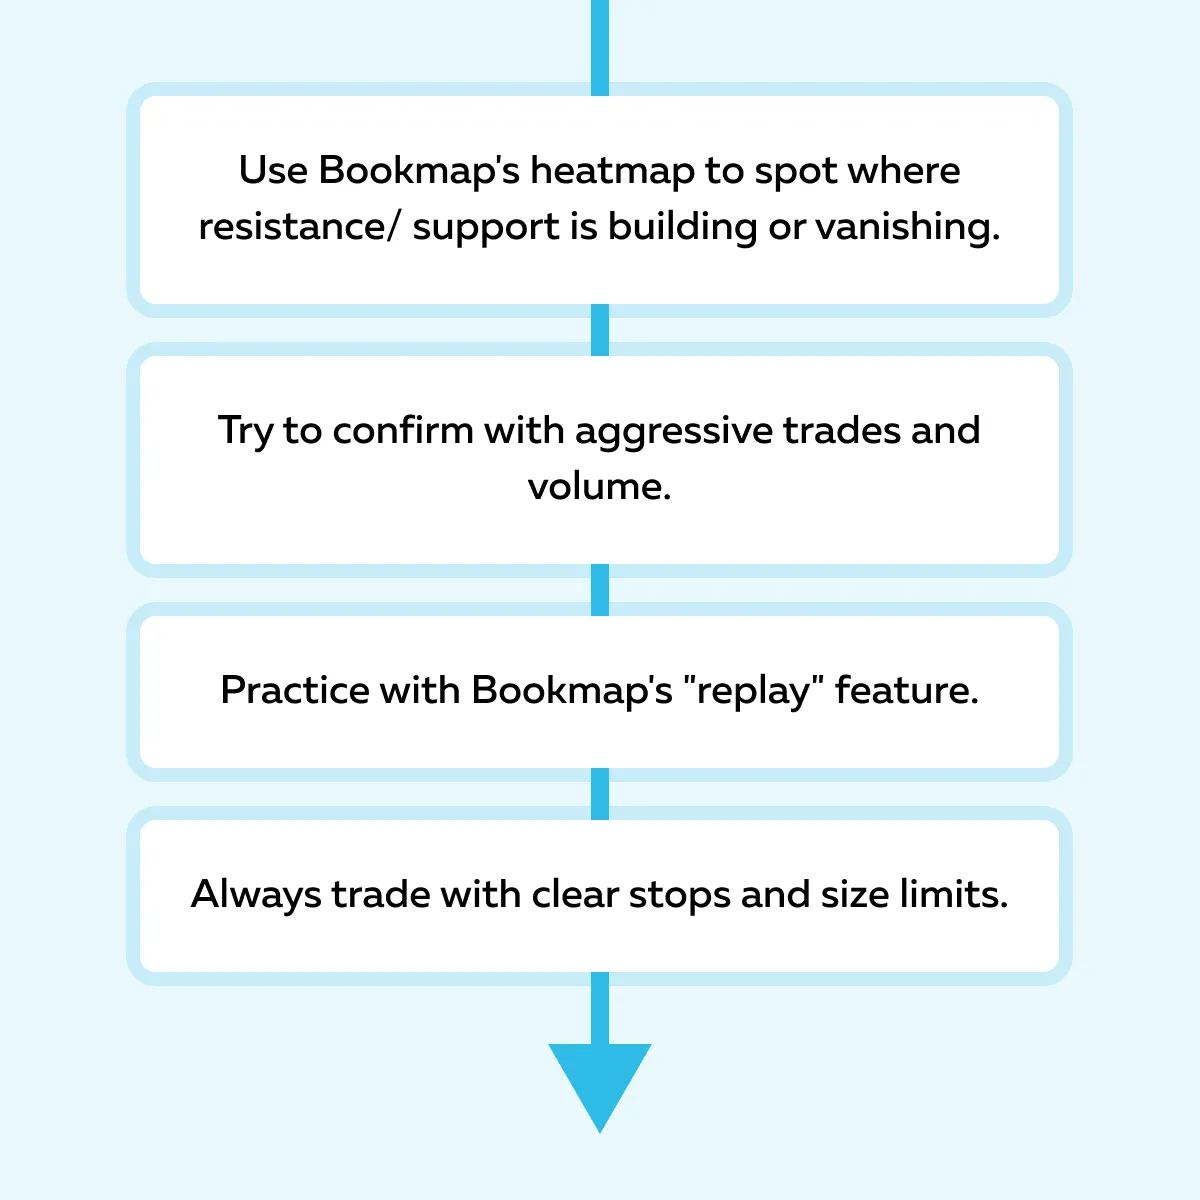
Some Pro Trade Tips You Must Follow!
- Wait for confirmation. Do not jump on the first price poke!
- Confirm that aggressive prints are actually eating liquidity, and the heatmap band is being reduced or not replenished.
- Stop beyond the next meaningful liquidity band. Now, target the next opposite band or a fixed “risk: reward ratio.”
- Always size so that a single loss does not hurt your account.
- Practice with our trading tool, Bookmap’s replay feature. It is one of the fastest ways to learn liquidity as a leading indicator.
- Pick a known breakout day. Replay Bookmap + candles side-by-side.
- Use the heatmap offered by Bookmap, which shows historical order changes, not just current Level II data.
- Filter by order size to ignore noise.
Want to see hidden liquidity before price reacts? Try Bookmap’s real-time heatmap.
Why So Many Traders Still Rely on Candles
Many traders use candlestick charts simply out of habit! Almost every charting platform shows them by default, so they are the first thing new traders learn.
Furthermore, they are also easy to memorize. Patterns like doji, hammer, or engulfing have clear textbook definitions (however, mastering them is much harder).
The Real Problem with Candles
In today’s markets, liquidity is fragmented across venues. It is often hidden through iceberg orders and constantly moves in real time. Now, candles cannot show you these liquidity changes as they happen. Why? That is because they only summarize the price after the move.
In 2025, if you are relying on candles alone, it is like reading breaking news after the event is over. Yes, you are getting the story, but you are too late to act!
Thus, most traders have started treating liquidity as a leading indicator. This approach allows them to see the setup before the candle closes. This gives them a crucial timing edge!
Getting Started with Liquidity-Based Trading
If you are new to using liquidity as a leading indicator, the first step is watching (NOT TRADING)! Perform these three steps as a beginner trader:
| Step I: Open the analysis tool, Bookmap’s heatmap tool | Step II: Pay attention to the reaction | Step III: Make Complete Use of our market analysis tool, Bookmap |
|
|
or
|
Keep practicing on our market analysis tool, Bookmap, and gradually, this constant observation builds your intuition. You will start spotting when a move has genuine liquidity support and when it is just bait meant to trap traders.
Conclusion
By now, you should understand that candlestick charts only give you a summary of past action. However, liquidity shows you the “intentions” that will influence the next move. When you use liquidity as a leading indicator, you start to see:
- Where traders are adding or pulling orders,
- How aggressive buyers and sellers are behaving, and
- Where real support or resistance is forming.
What is the benefit of this knowledge? You can easily spot traps early and trade with more confidence rather than making blind guesses. To watch real-time changes in liquidity, you can try our Bookmap. Ready to upgrade your view of the market? See how Bookmap reveals liquidity in real time.
FAQs
1. What’s the difference between liquidity and volume?
| Particulars | Liquidity | Volume |
| Meaning | Liquidity is the pool of orders set to be traded in the future. | Volume is the record of trades that have already happened. |
| Signal/ Benefit | Liquidity shows expected future activity. It acts as a leading indicator for price moves. | Volume tells you past activity. |
2. Is liquidity always visible?
No! Some traders hide their orders, called iceberg orders, or place fake orders through spoofing to trick others. Even so, you must watch how visible liquidity appears, disappears, or moves. This gives you useful clues about the “true market intent.”
3. Can I use liquidity analysis without giving up candlesticks entirely?
Yes! Many traders keep candlesticks for context while conducting liquidity analyses. Nowadays, most give more weight to liquidity changes when deciding on trades. That is largely because liquidity shows intent before candles confirm it.
Sign Up Now