See market more clearly in real time.
Compare plans to access deeper market visibility for market.
Trading Basics
September 24, 2025
SHARE
Overcoming Market Microstructure Myths: How to See the Market as It Really Is

Do you get excited by simply spotting a big order on the screen? And next, you bet on it? If this were a definite clue, why are you still trading and not sipping cocktails on a private island by now?
The reality of market dynamics is far messier than it appears. What you see in the order book is often only half the story. Hidden liquidity, spoof orders, and changing spreads easily mislead traders. Now, these gaps in understanding lead to some of the most common market microstructure myths, such as believing the DOM shows everything or assuming market makers control every tick.
So, want to see how the market really is? In this article, we’ll debunk five major myths one by one and explain what’s really happening under the hood. Also, we will tell you how our advanced real-time market analysis tool, Bookmap, can give you a 100% clearer and fact-based edge.
Myth 1: The Order Book Shows All Available Liquidity
This is one of the classic market microstructure myths! It’s easy to think the DOM/Level II shows “everything,” but that screen is only a window into part of the market, not the whole room.
What the DOM actually shows
Through the DOM, you can see visible and resting limit orders at each price on the venue your feed covers (e.g., one exchange).
Next, you can use it to see the best bid and ask about the spread. For those unaware, it is the highest displayed buy vs. the lowest displayed sell. It’s important to note that the DOM does not reveal hidden size or what’s sitting on other venues. Read the next section for more clarity.
What the DOM does not show
A DOM does not show hidden/iceberg orders. That’s because only a small “tip” is displayed in it, and the larger “reserve” stays invisible. Additionally, you can’t see the following on the DOM:
| Market and stop orders (until they trigger) | Dark pools / off-exchange trades (in stocks): | Other Venues | Fleeting quotes/cancellations |
|
|
|
|
Why this Order Book Misconception Is Important for You to Know?
Leaning on visible “walls” can backfire! If you base your trading decisions on a distorted DOM, you might spot false support/resistance levels. Furthermore, there could be:
-
- Execution surprises as sudden moves often come from hidden liquidity being hit or off-exchange prints you couldn’t see.
- Venue bias, which involves making decisions based on one venue’s book in a multi-venue market, is a liquidity myth. You’re missing the rest of the picture!
How Does Bookmap Help?

By using our advanced real-time market analysis tool, Bookmap, you can visualize “full-depth” feeds from supported exchanges/ venues. It is important to note that “full-depth” means full depth for that feed and not the entire market. Also, you can plot executed volume against historical liquidity.
Both these features allow you to:
- See more than the top-of-book
and
- Spot absorption, like an iceberg refreshing.
Trade with clarity by seeing the truth behind market microstructure.
Myth 2: The Bid/Ask Spread Reflects True Market Supply and Demand
This is another common trading myth that trips up new traders! Many assume the bid-ask spread tells you who’s stronger – “buyers or sellers”. But that’s an order book misconception.
Learn What the Spread Really Is
The bid/ask spread is the gap between the highest displayed buy order (best bid) and the lowest displayed sell order (best ask). It does not mean the following:

As a trader, you must note that the spread’s size often reflects these three main technical factors:
| Factor I: Tick Size | Factor II: Order Flow Speed | Factor III: Liquidity Provider Behavior |
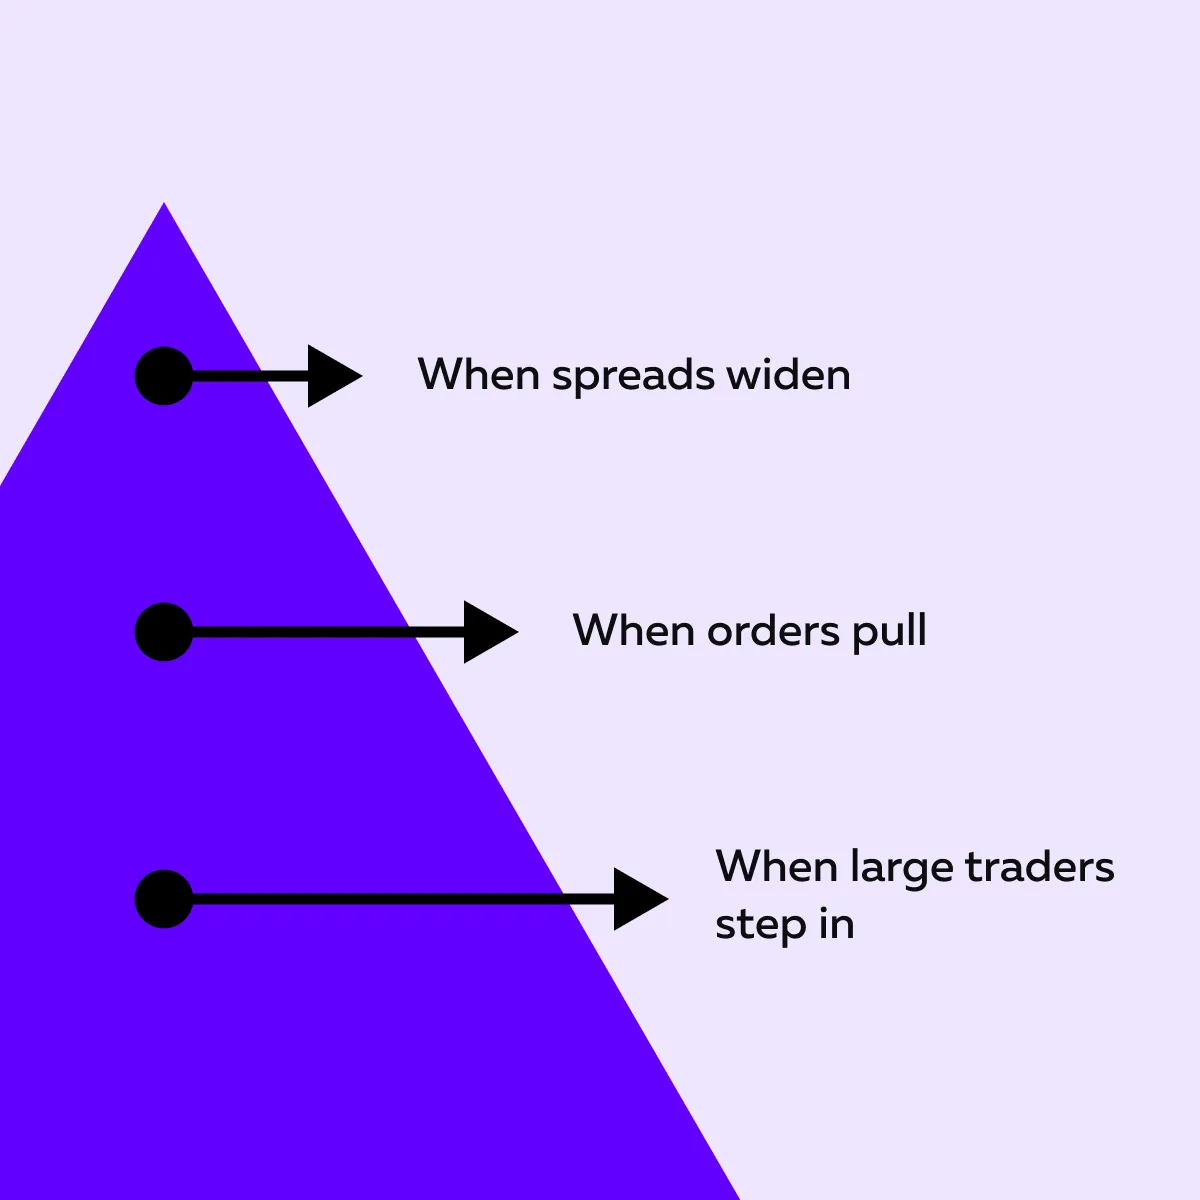
| Bigger tick sizes can lead to wider spreads, even if liquidity is strong. | In volatile markets, spreads widen. This happens as quotes struggle to keep up. | Sometimes, market makers pull back quotes when there is uncertainty. This widens the spread temporarily. |
Why the Spread Can Mislead
Just outside the spread, there might be large hidden liquidity waiting. That supply or demand matters far more than the tiny spread you see! Be aware that the spread is like the “front door” of the market. Usually, the real crowd is standing just behind it.
Why You Must Know This Liquidity Myth
Do you think a tight spread = strong liquidity? There is a high chance that you might get tricked into poor timing. You must realize that price can still move sharply if the visible orders are thin.
A wide spread doesn’t always mean “no demand.” It might just be that market makers stepped back for a moment.
What You Must Actually Watch
As a trader, you must track how liquidity inside and outside the spread changes. Analyze and find – Do orders appear, cancel, or shift higher/lower?
Next, you can look for absorbing liquidity just beyond the spread, such as big buy or sell orders that soak up aggressive trades.
Need to make this analysis easier? You can start using our market analysis tool, Bookmap, or depth-of-market feeds. Both let you visualize hidden liquidity dynamics and not just the headline spread. Watch order flow unfold in real time with Bookmap’s advanced visualization tools.
Myth 3: Large Visible Orders Always Move the Market
This is a classic order book misconception! When traders see a huge order sitting in the DOM, they often assume the price must move toward it. But the truth is more complicated.
What’s Really Going On
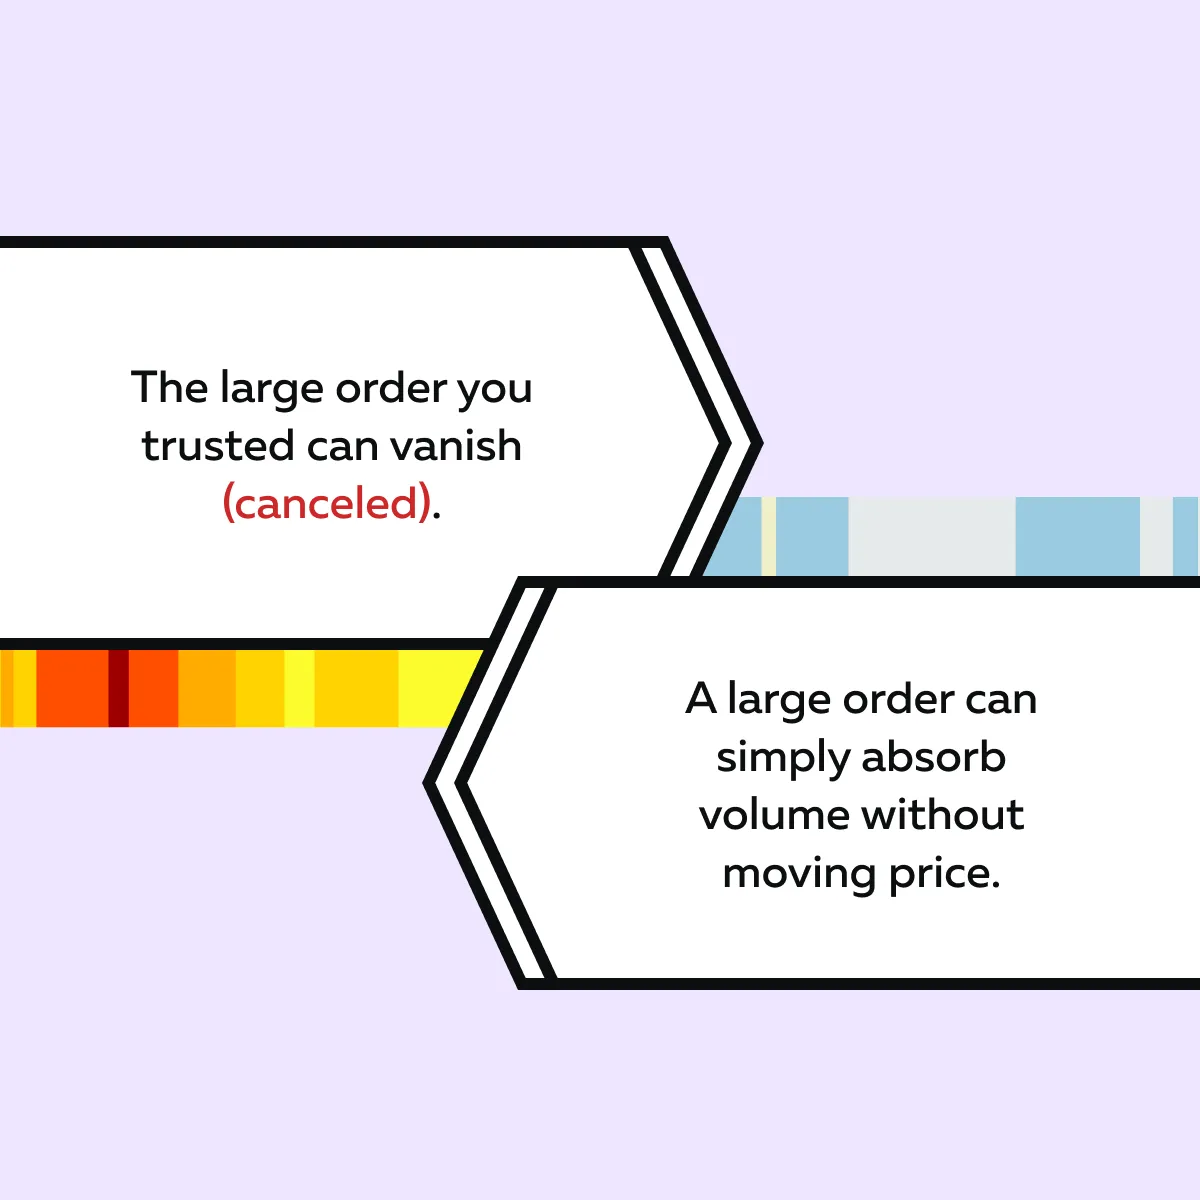
Large orders can be genuine. There could be real buyers or sellers waiting for their orders to be filled. But at the same time, they can also be spoof orders! Such spoof orders are usually placed to trick others. Later, they are canceled as soon as the price gets close.
Furthermore, some big orders are “passive liquidity”. Instead of pushing price, they simply absorb aggressive traders hitting into them. In this way, they act like a cushion.
Thus, don’t assume size = direction. A big order can be bait and not fuel.
Why You Can’t Ignore This Myth
If you blindly follow visible size, you might end up chasing a liquidity trap. Yes, let’s see what can happen:
Need a smarter way? You should watch what happens when the price interacts with that order.
- Is it being hit and refreshed (iceberg/absorption)?
or
- Does it disappear before getting touched?
By using our avant-garde real-time market analysis tool, Bookmap, you can easily track not just large orders on the book but also whether those orders are actually being executed or pulled. Through Bookmap, you can easily separate real liquidity from fake walls.
Myth 4: Volume Always Confirms the Move
Need another big market microstructure myth? It is that “high volume means the move is strong.” It sounds logical, but in reality, volume without context is misleading!
The Truth About Volume
Yes, a high volume of trade can sometimes confirm momentum. In these situations, aggressive traders take the price forward. However, this does not always happen. A surge in volume can also mean “exhaustion”. In this event, trapped traders bail out at the top or bottom.
Furthermore, the same volume spike can mean two very different things. It all depends on who is in control:
| Say Buyers are in Control | Say Sellers are in Control |
| A volume spike could mean aggressive buy orders are lifting the ask and are pushing the price higher (continuation). | The same spike suggests that buyers are getting trapped at the top. If we talk about sellers, they are absorbing their orders and then pushing the price back down (reversal). |
So, same spike, but opposite meaning. Always remember that the key is not the size of the volume, but whether it’s the dominant buyers or sellers behind it.
Why Myth 4 Is Dangerous
If you assume “more volume = continuation,” you’ll often get caught in false breakouts or reversals. What counts is the quality of order flow:
- Is the volume mostly aggressive buyers lifting offers, or aggressive sellers hitting bids?
or
- Is it being absorbed by hidden liquidity on the other side?
How to Read it Better
Instead of looking at the number alone, you should watch how volume interacts with the order book. For example:
- Let’s say massive buy volume hits the ask.
- However, the price barely moves.
- Now, that signals absorption, not strength.
At this time, if sellers dump volume but bids hold firm, buyers may actually be stronger than the chart suggests.
Myth 5: Market Makers Control Price Completely

Many traders blame every tick against them on market makers! They believe these players secretly control everything. But that’s an order book misconception. Let’s learn how:
| The Fake Ideology | The Reality |
|
|
Market Makers Have Limited Influence
Yes, market makers can influence short-term flows by stepping back or leaning one way. However, they don’t have unlimited power. You must realize that in modern markets, there are:
- Multiple competing market makers
+
- Institutional traders
+
- Funds
+
- Retail flow
Thus, no single player can dictate the whole market. Furthermore, regulations also limit manipulative behavior like spoofing or layering. So, while bad actors exist, they’re not the entire story!
Ultimately, price is discovered by overall supply and demand from all participants and not just one group.
Why You Must Ignore This Mindset
Believing that market makers are “all-powerful” can create a defeatist mindset. You may start to think that you can’t succeed because the system is rigged. However, in reality, profitable trading opportunities exist in the following:
So, instead of blaming market makers, you should focus on reading order flow and liquidity shifts. Such an understanding will improve your timing. Compare Bookmap packages and start viewing the full depth of market data.
How to See Through Market Microstructure Myths
Need one fastest way to fall for trading myths? You start staring at a static Level II screen and assume it tells you the truth. But this won’t help, as the market is dynamic and liquidity constantly changes.
You must see through order book misconceptions and liquidity myths. And to do so, you need to do the following:
A) Go Beyond Static Data
A DOM snapshot shows only “this instant”. It doesn’t tell you how liquidity got there. For example:
-
- Let’s say you see 500 lots sitting on the bid in ES futures.
- You assume “strong support.”
- But if you checked the history, you’d notice those 500 lots have been flashing in and out.
- That’s likely a bluff! It is not the real intent to trade.
Thus, you must understand whether liquidity has been sitting for hours or is constantly being canceled.
B) Use Tools That Show Liquidity Behavior Over Time
Need a real edge? It comes from tracking how liquidity appears, disappears, and shifts. Our marketing tool, Bookmap’s, heatmap records this history. You can interpret it as follows:
Additionally, in our trading platform, Bookmap:
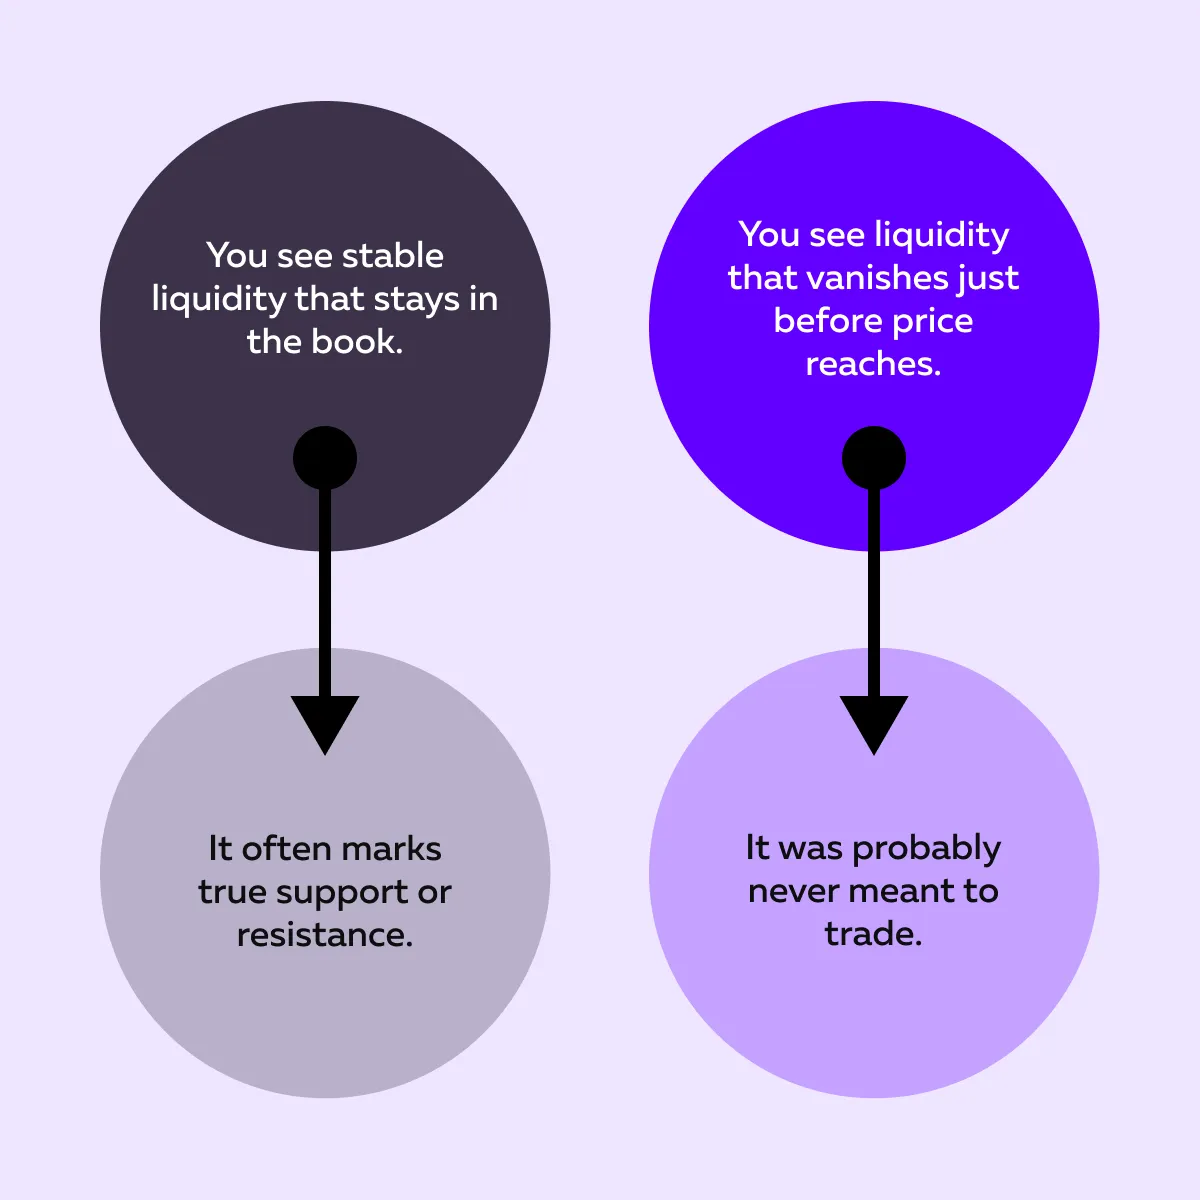
- Bright bands indicate persistent orders
and
- Fading or disappearing bands signal pulled liquidity.
This further makes it easier to spot genuine interest vs. manipulation.
C) Combine Multiple Signals and Context
No single clue is enough! Let’s say you see a big liquidity wall. But it means more when:
- Aggressive volume is actually trading into it.
- Price has repeatedly failed to break through.
- The broader market context, including time of day, volatility, or events, supports the reaction.
For example, say a 1,000-lot sell wall is holding during a slow session. Now, it may show real absorption. But the same wall before a major Fed announcement? It is likely to vanish as risk management.
D) Apply Contextual Filters
As a trader, you must note that liquidity behavior changes with conditions, such as:
| Before Big News | During Thin Sessions (late Friday or pre-holiday) |
| Pulling liquidity is usually risk management and not spoofing. | Even small order book changes can move the price more than usual during this time. |
Thus, you should apply contextual filters. This means judging liquidity and spreads based on market conditions. For example,
- Before big news, liquidity pulls usually signal risk management and not spoofing.
- In thin sessions, even small orders can move the price and widen the bid-ask spread.
Therefore, you should always weigh order book changes against time, volatility, and upcoming events.
E) Practice Observation Before Acting
Don’t rush to trade on every wall or volume spike! Instead, you should spend time observing patterns. How? You can use replay tools to study these classic traps:
- Spoof orders,
- False liquidity walls,
and
- Clusters of size that never get tested.
As you keep on practicing, you’ll learn which signals are real supply/demand and which are part of common market microstructure myths.
Conclusion
Many trading mistakes come from believing market microstructure myths, such as thinking the order book shows all liquidity, or that volume alone confirms direction. These trading myths can lead traders to misread the bid-ask spread, chase false liquidity walls, and assume market makers control everything.
But the truth is, price action reflects a mix of visible and hidden liquidity. By learning to see through these order book misconceptions and applying context, you, as a trader, can avoid common traps and improve timing.
Need a tool? You can start using our avant-garde real-time market analysis tool, Bookmap, to visualize liquidity history and execution. Also, you can get a deeper and fact-based view of the market. So, want to trade with confidence? See real market microstructure in action with Bookmap’s heatmap and volume dots.
FAQs
1. What is market microstructure?
Market microstructure is the study of how the market works behind the price chart. It looks at:
- How buy and sell orders interact in the order book,
- How trades are matched, and
- How participants like market makers, institutions, and retail traders influence short-term price moves.
By analysing a market microstructure, you can understand the mechanics of how every tick in price actually happens!
2. Why is understanding market microstructure important?
Do you only look at price charts? There is a high chance you might misinterpret sudden moves or volume spikes. Now, a market microstructure allows you to understand what’s happening inside the order book, such as
- Who is buying,
- Who is selling, and
- Whether liquidity is genuine or just flashing.
With this knowledge, you, as a trader, can avoid false signals and read order flow better.
3. Can retail traders really see hidden liquidity?
No, retail traders cannot directly see hidden orders like iceberg or dark pool trades. Why? That’s because, by design, they don’t appear in the public order book.
However, if you use our marketing tool, Bookmap, you can get some strong clues. For example,
- On Bookmap, you see that large volume trades keep hitting at one level, but the visible size doesn’t shrink.
- Now, it suggests hidden liquidity is absorbing those orders.
4. Does market microstructure apply to crypto as well?
Yes, market microstructure applies to crypto just like it does to stocks or futures. While the core ideas remain the same, you will find that the exact setup is different. That’s because crypto trades on many fragmented exchanges without the same regulations. However, liquidity, order flow, bid-ask spreads, and hidden orders all play a role.
Sign Up Now