See market activity more clearly in real time.
Compare plans to access deeper market visibility for market activity.
News & Announcements
January 30, 2024
SHARE
Try New Features: Bookmap’s Release #7 is Real Heat

All hands hoay!
Version 7 is here. We put a lot of effort, design thinking, and cups of coffee inside us to make Bookmap a superior product. Ultimately, we responded to your demands and improved the features you already enjoyed. So without further ado, let us introduce you the upgraded trading crew of Bookmap that will assist you with personal strategy.
Historical data
First of all, get your access to the market depth with historical data. As you turn on this instrument, the data on the Bookmap chart will include information that precedes the moment of initial subscription. Thus, it provides better navigation through the market insights.
Market depth data, unlike other forms of market data, includes all the raw data available for a given market. It requires significant bandwidth, which is typically x20 times more than just data on trades, as well as an integration of the historical market depth data with real-time data. No other trading platform offers this.
Bookmap provides historical market depth data for last 48 hours. There are 3 sources of the data:
| Data source: | Recorded sessions on user’s computer | Bookmap servers | DevExperts servers | |
| Supported instruments: | Any | Digital currencies | Stocks | Futures(*) |
| Cost: | Free | Free | Free | Free 1 hour(**) |
The platform will load the historical data which was recorded during a previous trading session and was stored on your computer. If there is no previously recorded data or if it has gaps, Bookmap will download the missing data from one of the other two sources depending on the instrument type.
Colored heatmap
Secondly, Version 7 brings two new colored schemes to the Bookmap’s heatmap that we nicknamed “colormaps”. This lets traders evaluate the differences between market depth sizes at different times and prices easier.
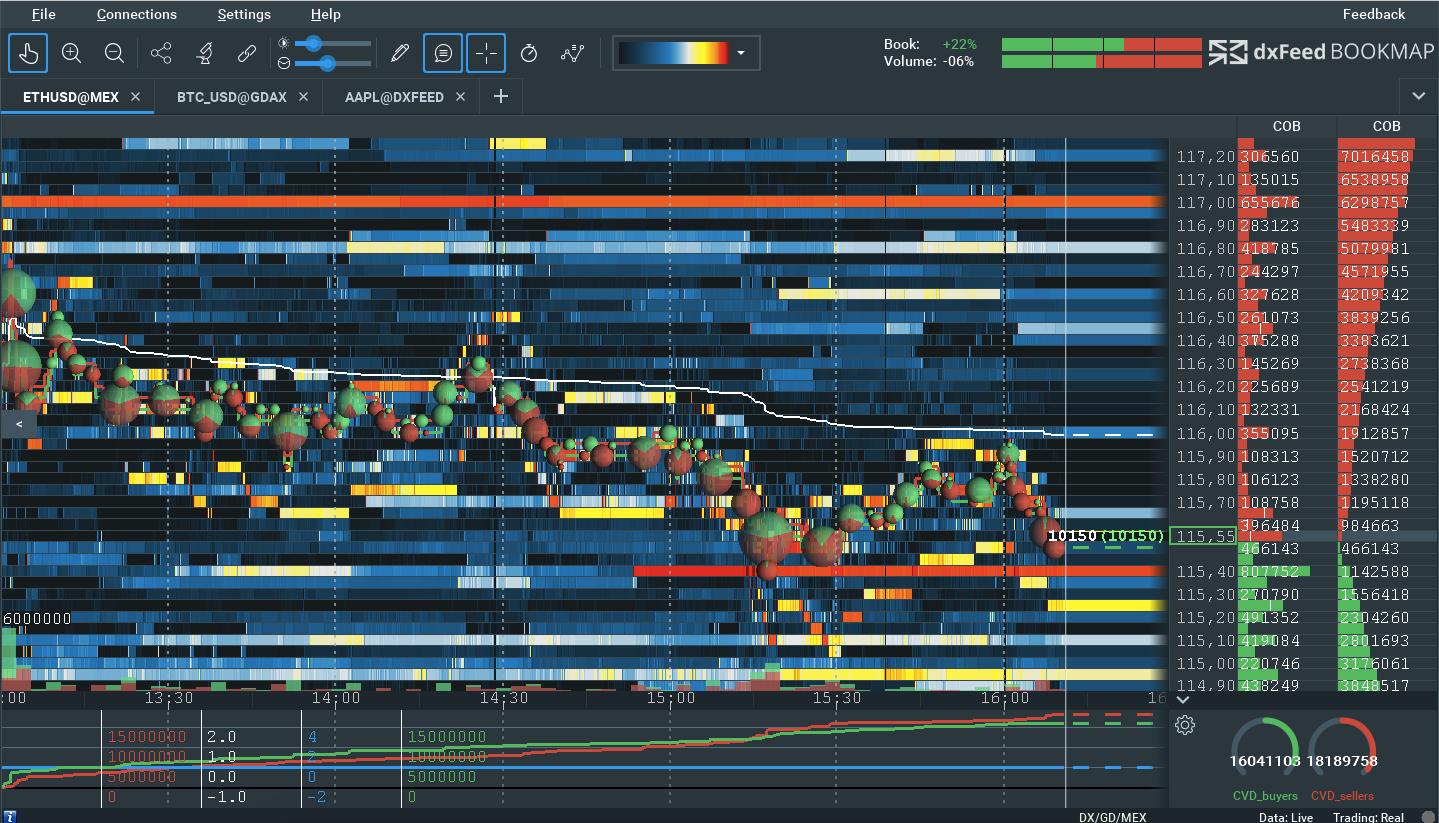
Digital currencies: GDAX exchange
Besides, Bookmap now supports live connection to GDAX. It displays market data and allows you to trade digital currencies directly. GDAX connectivity supports 3 cryptocurrencies: Bitcoin, Ethereum, and Litecoin. These markets are active 24/7.
While simply displaying live market data does not require any account or your credentials, you will need a funded account with GDAX for actual trading.
Advantages of trading and visualizing digital currencies on Bookmap include:
- Placing the smallest order for a buy or sell trade on GDAX: 0.01 BTC, ETH, or LTC. This benefits traders with practicing real trading at low risk.
- Setting different price ticks (minimum price increment) upon subscription to an instrument or pair.
But this is only a beginning. We tweaked the UX for your comfort and advantage. Check it out next.
Trading from columns
Trading is now available from both a chart, as it was previously, and using Trading DOM — a new type of columns. The latter enables traders to place, cancel and modify orders with a left-click only. Also, just right-click on columns area to add the Trading DOM column.
It contains several subcolumns and traders may add or remove them. Each subcolumn configuration can be reached via “right-click > configure” and contains two sections:
- VISUAL OPTIONS that defines what this column should display, and
- ACTIONS which specifies what actions should be performed on that sub-column. For example, sending an order or canceling it.
This approach provides maximum flexibility and permits traders to set up the most convenient way to trade from columns.
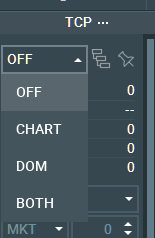
To enable trading, click on the lock icon ![]() on the toolbar and then choose an option:
on the toolbar and then choose an option:
Right-click menu
New right-click menus have been added in different sections of the platform for easier access to features and configurations such as heatmap chart, volume dots, volume bars, and indicators.
Volume dots: aggregation by price
What is more, Version 7 got a new Volume Dots clustering method: aggregation by price. With this clustering method, all the volume traded on the same price level is aggregated until a new trade occurs on a different price level. The horizontal position of aggregated volume dot represents the average time of all aggregated trades, weighted by their volume.
VWAP indicator
We also added the Volume Weighted Average Price indicator. The VWAP line can be reset from studies panel or through the right-click menu when hovering over the indicator’s line.
POC
The point of control (POC) line has been added to the chart too. POC is the price level that had the largest size of a measured activity during a sampled period. For example, if the measured activity is traded volume, POC will show the price level at which the largest aggregate volume size was traded during the sampled period.
Some more technical stuff follows here but keep on reading what best answers your questions. Bookmap supports POC indication for the Volume, Trade Counter, and Quote Counter columns. The POC line is drawn on the chart and is session based so it cannot be activated when the column is based on the visible chart range.
Different connection to data and trading
Wow, there is so much to the 7th release. But hold on, more is coming. We added the ability to use different connections for data and execution, and now users can get their data from one connection but trade through another. As a starting point, this only applies to US equities: users are able to obtain the full market depth data of the US equities through dxFeed(provided by DevExperts) and to trade through Interactive Brokers.
Performance improvements
Furthermore, under the hood Bookmap 7 contains innovative technological solutions that grant effortless manipulation of Bookmap chart even when it displays millions of market data events. It is incredible how modern technologies allowed us to do this relying on CPU and RAM only — parts of a standard personal computer.
Stability
Finally, all the above would not be possible without optimization delivered with Version 7. We tested it using advanced automated tests and simulated extreme market conditions with various crash tests to prove the product readiness. Yet, if you notice anything strange, please let our team know, and we will resolve the issue as soon as possible.
We are glad you made it so far because there is a little bonus as well.
Other changes
- Changes to the toolbar:
- New colored heatmap drop down menu added.
- Contrast configuration panel moved into Heatmap settings in the Studies panel.
- New heatmap configuration button near the slider added.
- New slider for the Dots size + icons for fast access to the settings added.
- Moved the strategy/API button to the trading configuration panel (TCP column).
- Moved the “configuration” button to the Settings menu and right-clicked menu.
- Menu “Feedback” now allows to report a problem or communicate with us.
- Candlesticks include VWAP lines (see settings in Studies panel).
- Improved visibility of numerical values of columns in a zoomed out view.
- Last price coloring based on aggressor side included.
- New icons on columns header to indicate when volume reset is enabled.
- Updated the content under
 button for quick access to visible components
 - Automatic settings of memory (RAM) allocation for Bookmap based on computer hardware. It can be manually updated via the settings menu.
- Additional minor improvements are in place as well.
Now, get ready for the hot trading with Bookmap!
Note: The historical part of the data is not recorded in the Bookmap data files “.bmf”. These files will contain only the real-time data since subscription to the instrument.
Sign Up Now