Track structural shifts as they develop, not after.
Compare plans to follow evolving market themes and positioning.
Market Analysis
March 18, 2026
SHARE
2026 Trading Themes: Structural Shifts Traders Need to Know

Markets do not change because traders “think differently.” They change as participation patterns, liquidity, and access to execution evolve over time. In 2026, faster technology and continuous trading are changing how prices move during the day.
Markets now spend more time moving within ranges and expand only when strong participation enters. At the same time, liquidity adjusts more dynamically, and value areas can relocate within the same session as new participation enters. In addition, news events and social platforms trigger immediate reactions.
To succeed in such environments, traders must understand both participation and liquidity behavior rather than relying solely on price levels. This article explains the major structural changes influencing the market behavior in 2026 and what they mean for trading decisions.
Theme 1: Longer Balance Periods With Sharper Expansion
One of the defining 2026 trading themes is the increase in “time spent in balance” before directional expansion. Balance refers to a condition in which buyers and sellers temporarily agree on value. During this phase, price rotates within a defined range rather than trending strongly in one direction.
In such conditions, price usually shows three characteristics:
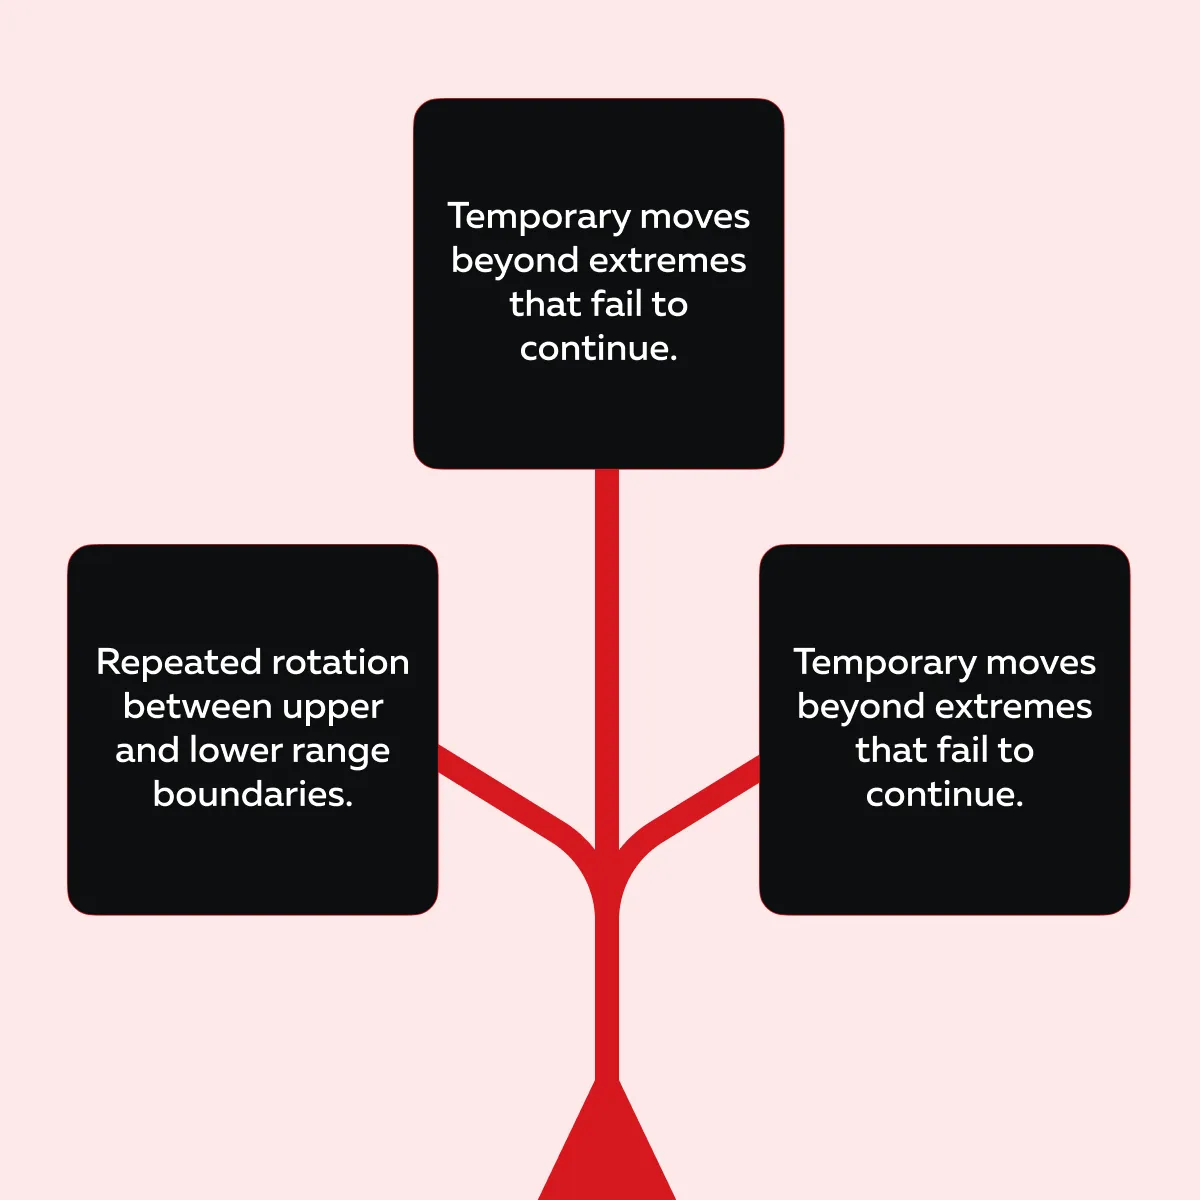
These rotations indicate equilibrium rather than trend formation. Market participants actively transact at both extremes, but neither side has sufficient conviction to establish control. As a result, the price oscillates within the range instead of expanding directionally.
Balance persists until new participation enters and disrupts the existing equilibrium.
Transition from “Balance” to “Trend”

This transition occurs when new participation enters the market. It creates an imbalance between buyers and sellers due to:
- Increased volume,
- Stronger conviction, and
- Broader participation.
This phase is called “exploration,” where price moves away from the prior value area to discover a new equilibrium. During such transitions, early price probes beyond the range boundary often fail. This happens because they lack participation support.
Additionally, sustained continuation develops only when the market moves with expanding volume and broader participation. This confirms that the balance phase has resolved. The following example illustrates the difference between a fragile breakout and structural acceptance:
| Assume Fragile Breakout Above 4260 | Assume Structural Acceptance Above 4260 |
|
|
These two scenarios reflect fundamentally different structural conditions. In the fragile breakout scenario,
- Price moves above resistance but encounters persistent passive sell liquidity.
- When aggressive buyers transact into this liquidity but fail to move the price higher, the buying pressure is absorbed.
- Absorption prevents continuation and signals that sellers are still in control of that level.
- As a result, transaction flow slows, and the price fails to remain above the range.
- This indicates that the market has not accepted the higher level as fair value.
The market still remains in a “negotiation phase,” where both buyers and sellers continue to agree on value within the original range.
In contrast, structural acceptance develops when liquidity conditions shift. In this phase:
- Passive sell liquidity above the level begins to reduce or withdraw.
- This removal of resistance allows aggressive buying to move the price higher more easily.
- At the same time, new liquidity builds below the price and creates support.
- This reflects increasing confidence among buyers at higher price levels.
- Most importantly, “pullbacks” during this phase show reduced selling pressure.
- They confirm that sellers are no longer dominant.
- Consequently, the price spends more time above the prior resistance.
- This signals that the market is establishing a new value area.
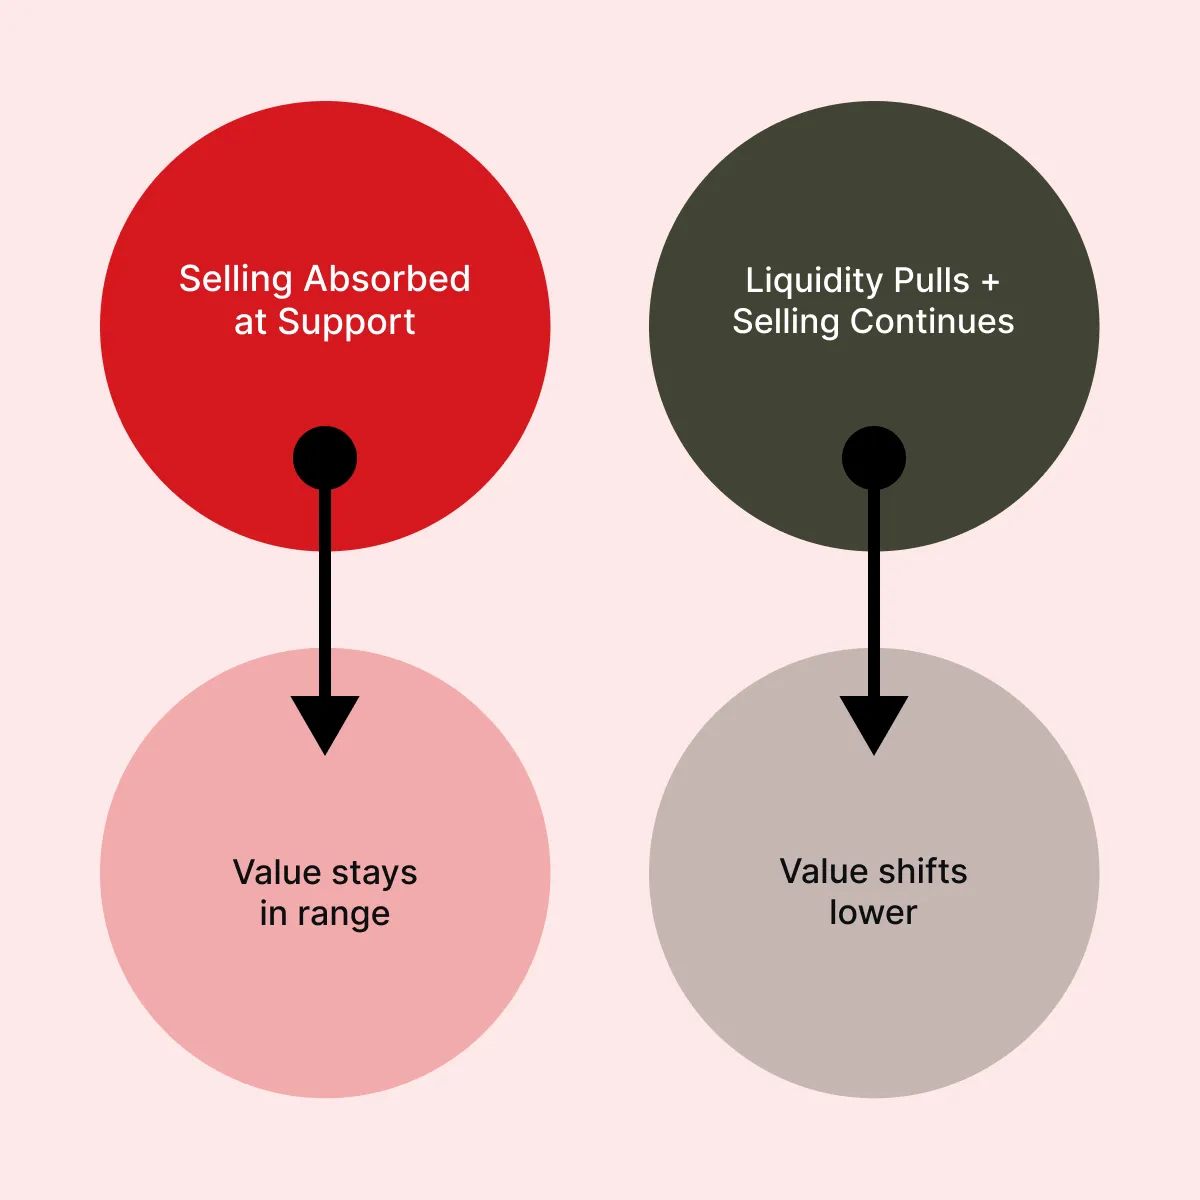
The Same Principles Apply to “Downside Moves”
When selling is absorbed near support, it signals “incomplete auction activity”. On the other hand, when liquidity withdraws below support and aggressive selling increases, it confirms a lower value migration.
Theme 2: Integration Between Social Platforms and Trading
In early 2026, social media platforms are evolving from information channels into direct trading environments. Platforms such as X, led by Elon Musk, are introducing in-app stock and cryptocurrency trading. This allows users to execute trades directly from their social feeds through features, such as “smart cashtags,” which:
- Display live price data
and
- Enable immediate order placement.
This development removes the delay between discovering information and executing a trade. Previously, retail participants had to move from social media to brokerage platforms. Now, discovery, analysis, and execution occur within the same interface. This structural shift changes how liquidity enters financial markets. Impact on Market Structure and Liquidity Flow
Integration of social platforms and trading changes market behavior in three important ways:
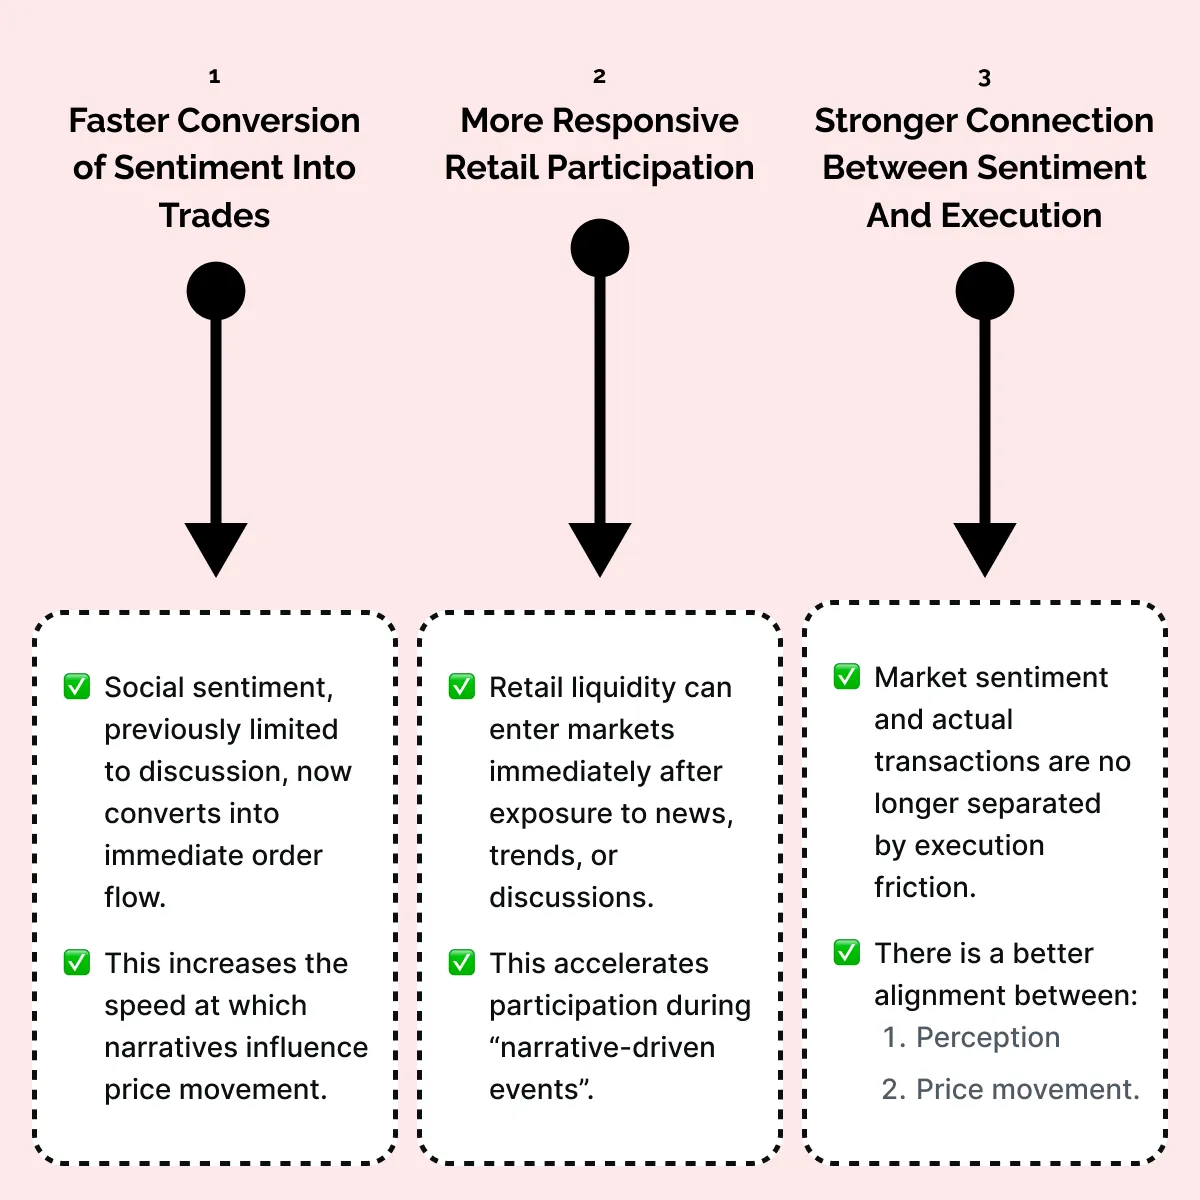
Execution and Participation Implications
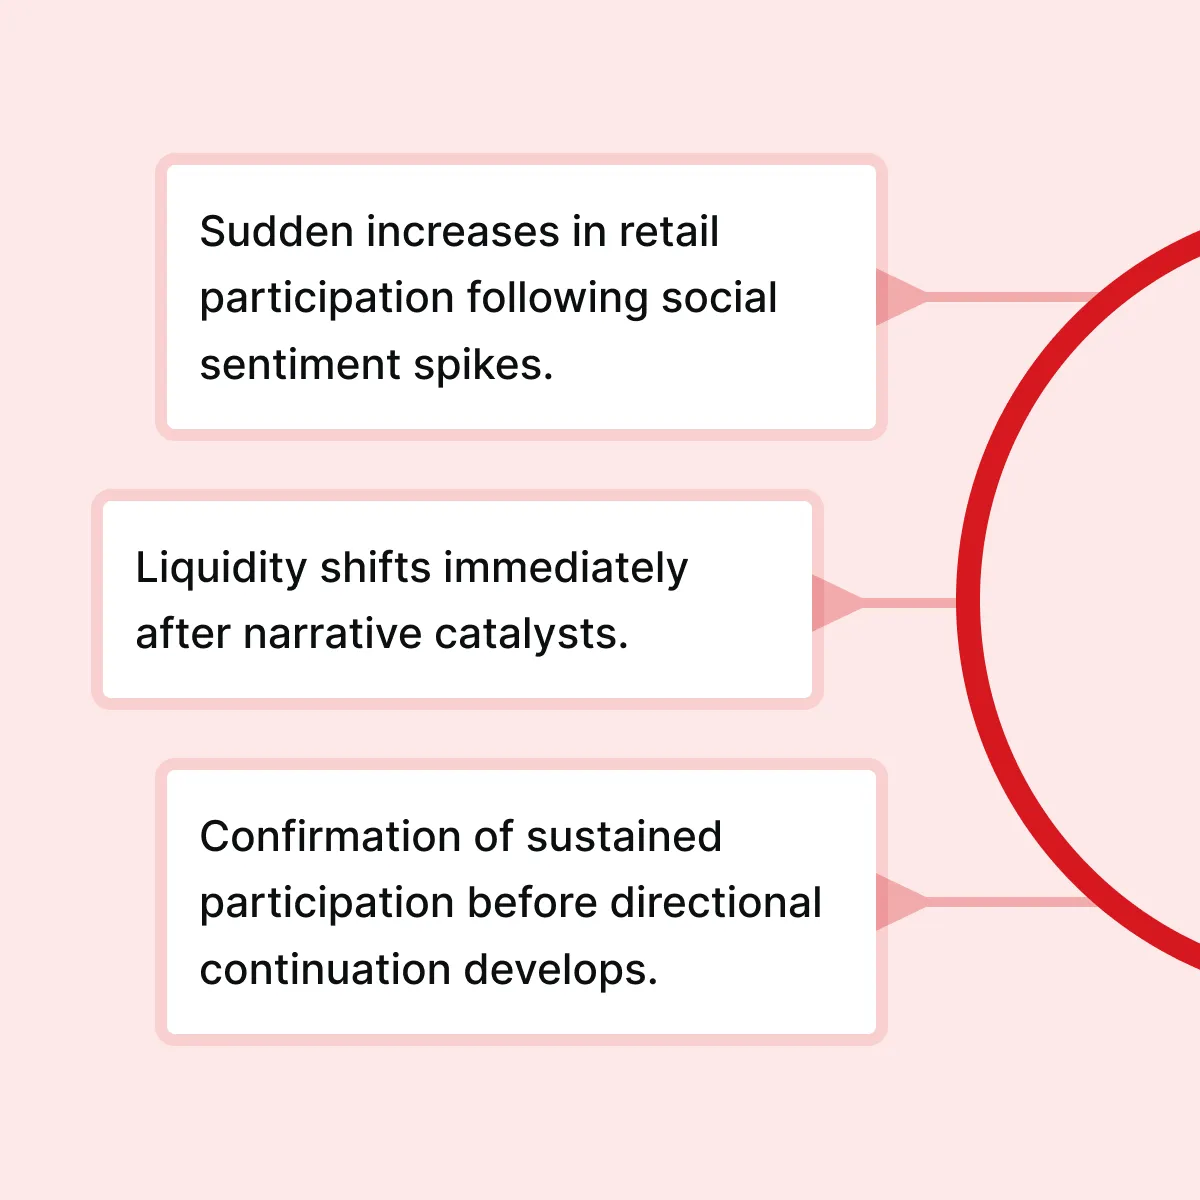
This environment increases the importance of monitoring participation quality rather than sentiment alone. Here, these signals become more relevant:
So, in 2026, information spreads instantly, and order flow responds faster than in previous cycles. However, sentiment alone does not create trends. Sustainable moves require continued participation and structural acceptance. See how participation and liquidity shape structural trends.
Significance Within the Trading Outlook 2026
The integration of trading into social platforms has increased the speed of liquidity entry. However, it does not change the underlying process of price discovery. Markets still require a sustained imbalance between buyers and sellers for directional expansion.
Participation, not visibility, determines market direction. Social platforms may increase “visibility,” but directional continuation still depends on liquidity commitment.
Theme 3: Crypto and Institutional Market Connectivity
Nowadays, major exchanges such as CME Group are preparing to offer continuous trading for cryptocurrency futures and options. These instruments will trade nearly 24 hours a day, including weekends and holidays, through institutional platforms such as Globex. This structural shift has important implications for liquidity and risk transfer.
Continuous Liquidity Across All Trading Periods
Historically, traditional markets operated within fixed trading hours, while cryptocurrency markets remained open continuously. This created “liquidity gaps” between asset classes.
- Crypto markets used to move significantly during weekends or overnight periods,
Whereas
- Institutional futures and equity markets remained closed.
In 2026, this structural gap began to close due to institutional crypto derivatives trading moving toward continuous access. As a result, liquidity and price discovery can now occur consistently across all periods. This reduces the likelihood of delayed reactions when traditional markets reopen.
Stronger Cross-Asset Synchronization
Institutional crypto trading is becoming increasingly integrated with broader financial markets. As a result, price movements across asset classes are expected to become more synchronized. Also, risk events influencing crypto markets may now transmit more quickly into:
- Equity index futures,
- Currency markets, or
- Other derivatives.
This integration creates a more unified global risk environment. Market participants can now adjust positions immediately, rather than waiting for traditional market sessions to reopen. Consequently, price adjustments can occur closer to the actual timing of information release.
Impact on Liquidity and “Imbalance Resolution”
Previously, large price imbalances in crypto could remain unresolved until traditional markets reopened. This created sharp opening gaps and sudden directional moves.
But now with continuous futures and options trading, imbalances can resolve gradually through ongoing participation.
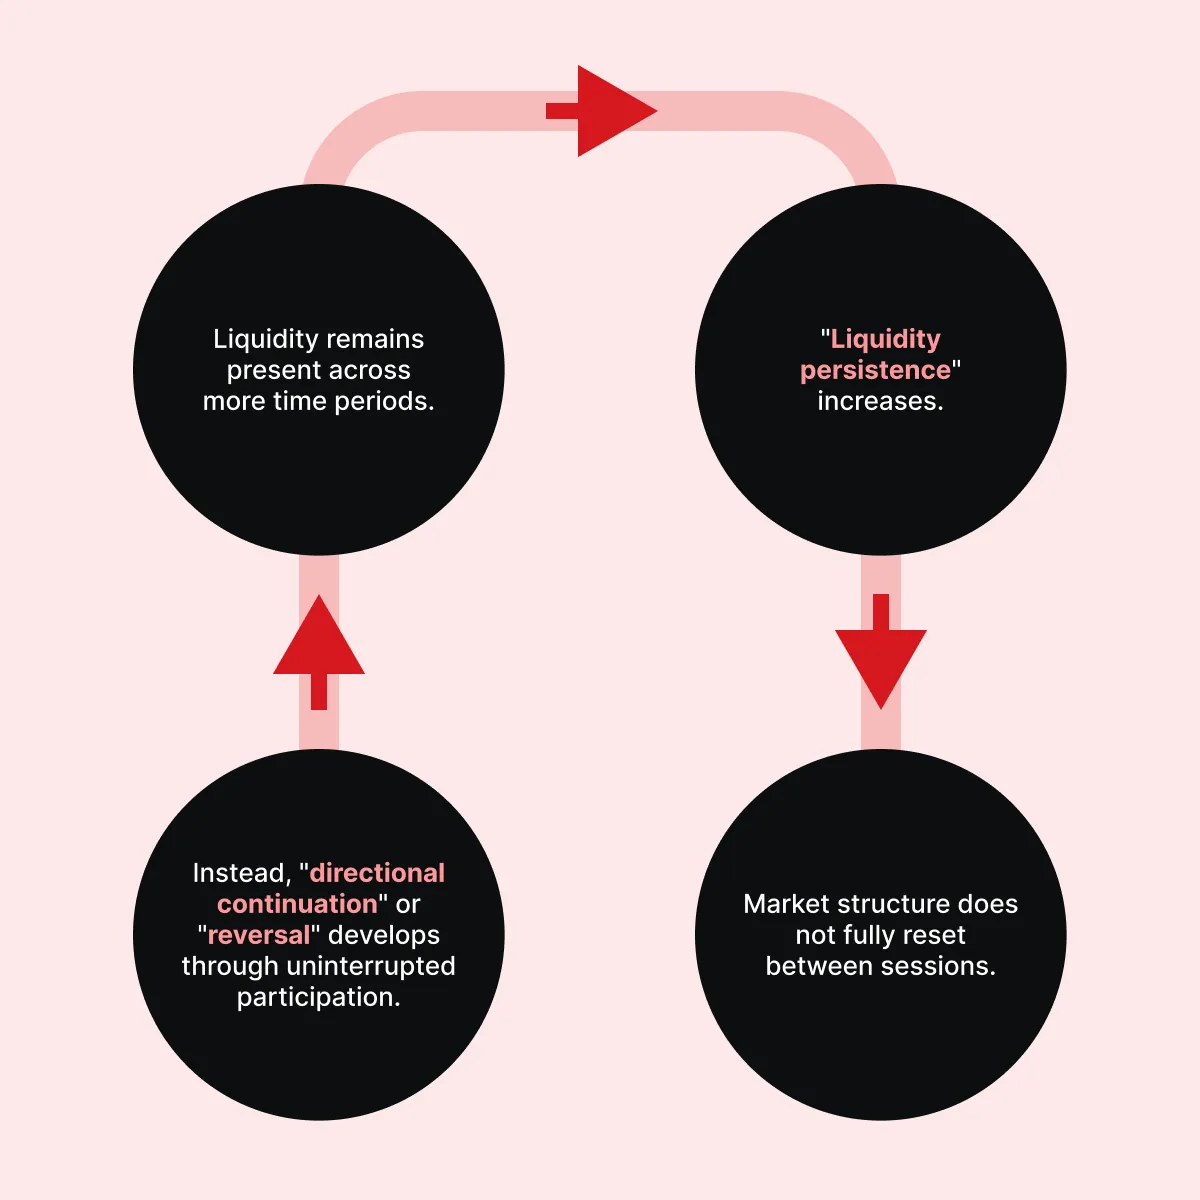
This integration represents one of the most important 2026 trading themes, as it fundamentally changes when liquidity enters and exits the market. Risk transfer now occurs continuously rather than being concentrated in specific sessions.
Theme 4: Liquidity Mobility Sets Up New Support/Resistance Dynamics
One of the defining 2026 trading themes is the increasing mobility of liquidity. Liquidity, which refers to resting buy and sell orders, no longer remains fixed at specific price levels for extended periods.
Causes of Dynamic Liquidity
The primary reason for this change is the evolving composition of market participants. Today’s markets are dominated by technologically advanced and systematic participants, such as:
- Algorithmic execution systems, which adjust orders continuously,
- Market-making models, which update quotes in milliseconds,
- Institutional participants, which distribute large orders across multiple venues, and
- Systematic funds, which respond automatically to volatility and price changes.
These participants actively manage risk and inventory. Moreover, liquidity providers no longer place static orders and wait for execution. Instead, they continuously adjust their positions to maintain balance and reduce exposure.
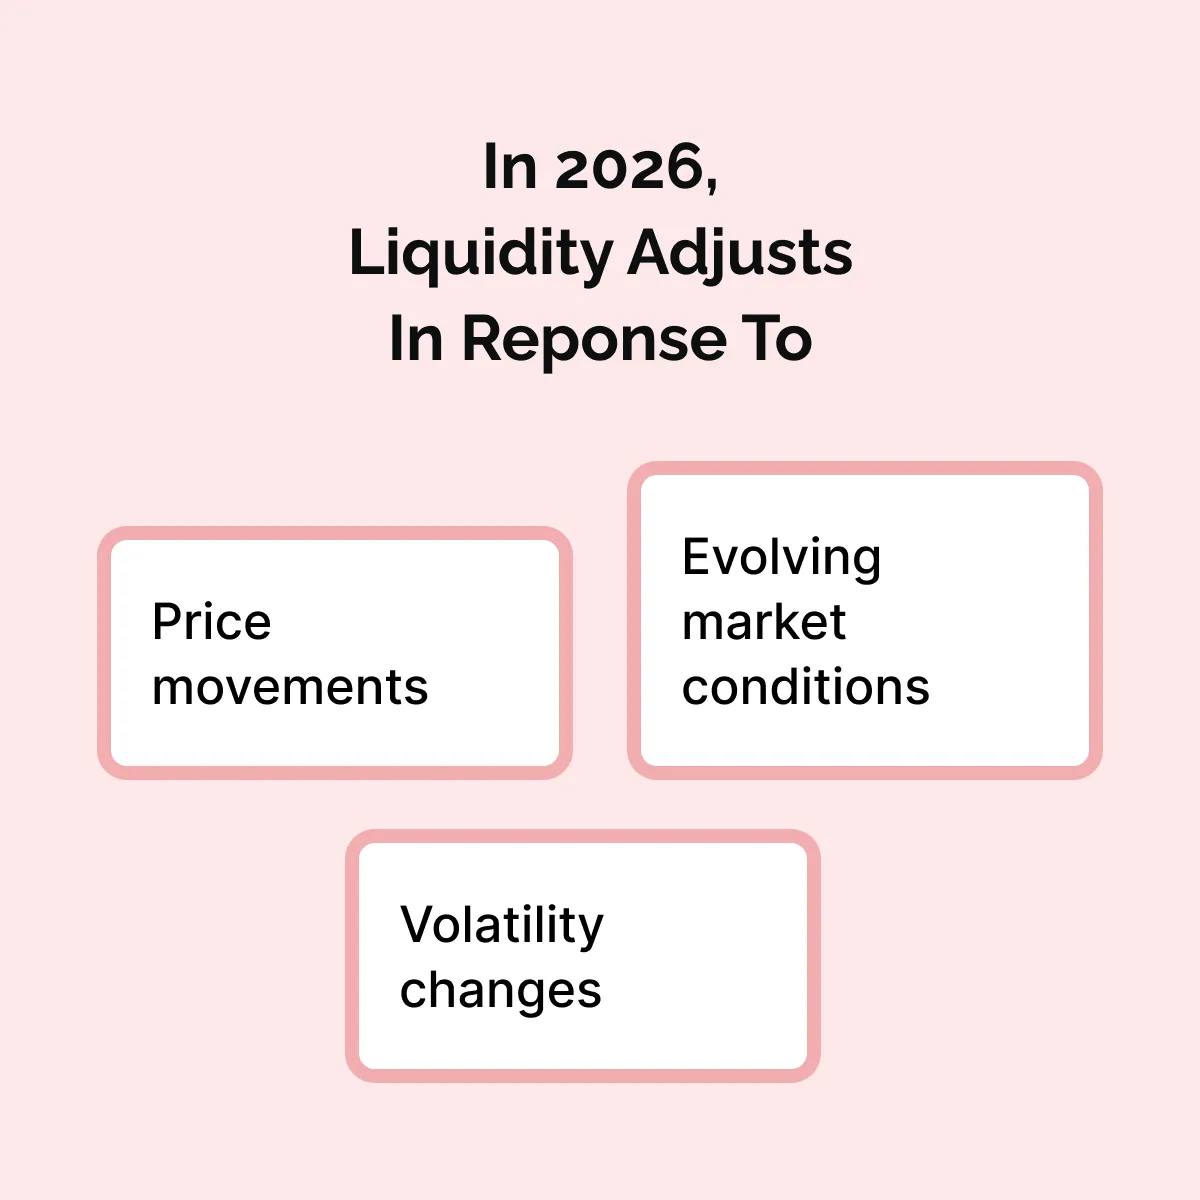
In 2026, this behavior creates a market structure where liquidity responds to price rather than remaining fixed at predefined levels. Understand how evolving market behavior affects execution.
Shift from Static Liquidity Levels to Adaptive Liquidity Zones in 2026
In previous market environments, support and resistance levels usually remained stable. Liquidity accumulated at specific prices, forming visible clusters. These levels served as “reference points” because liquidity remained present and provided stability.
In contrast, the current 2026 market behavior shows liquidity that refreshes, withdraws, or relocates.
- Support levels may disappear when liquidity providers pull buy orders.
and
- Resistance levels may weaken when sell orders are removed or absorbed.
As a result, price levels no longer function as permanent barriers. Instead, they represent “temporary areas of participation” that evolve in response to real-time liquidity conditions. This also explains why support can quickly turn into resistance, and resistance can turn into support. Once liquidity withdraws or shifts, the structural role of that level changes.
How Liquidity Behavior Defines Structural Strength
In 2026, the durability of a support or resistance level depends on participation strength rather than historical price interaction alone, as illustrated below:
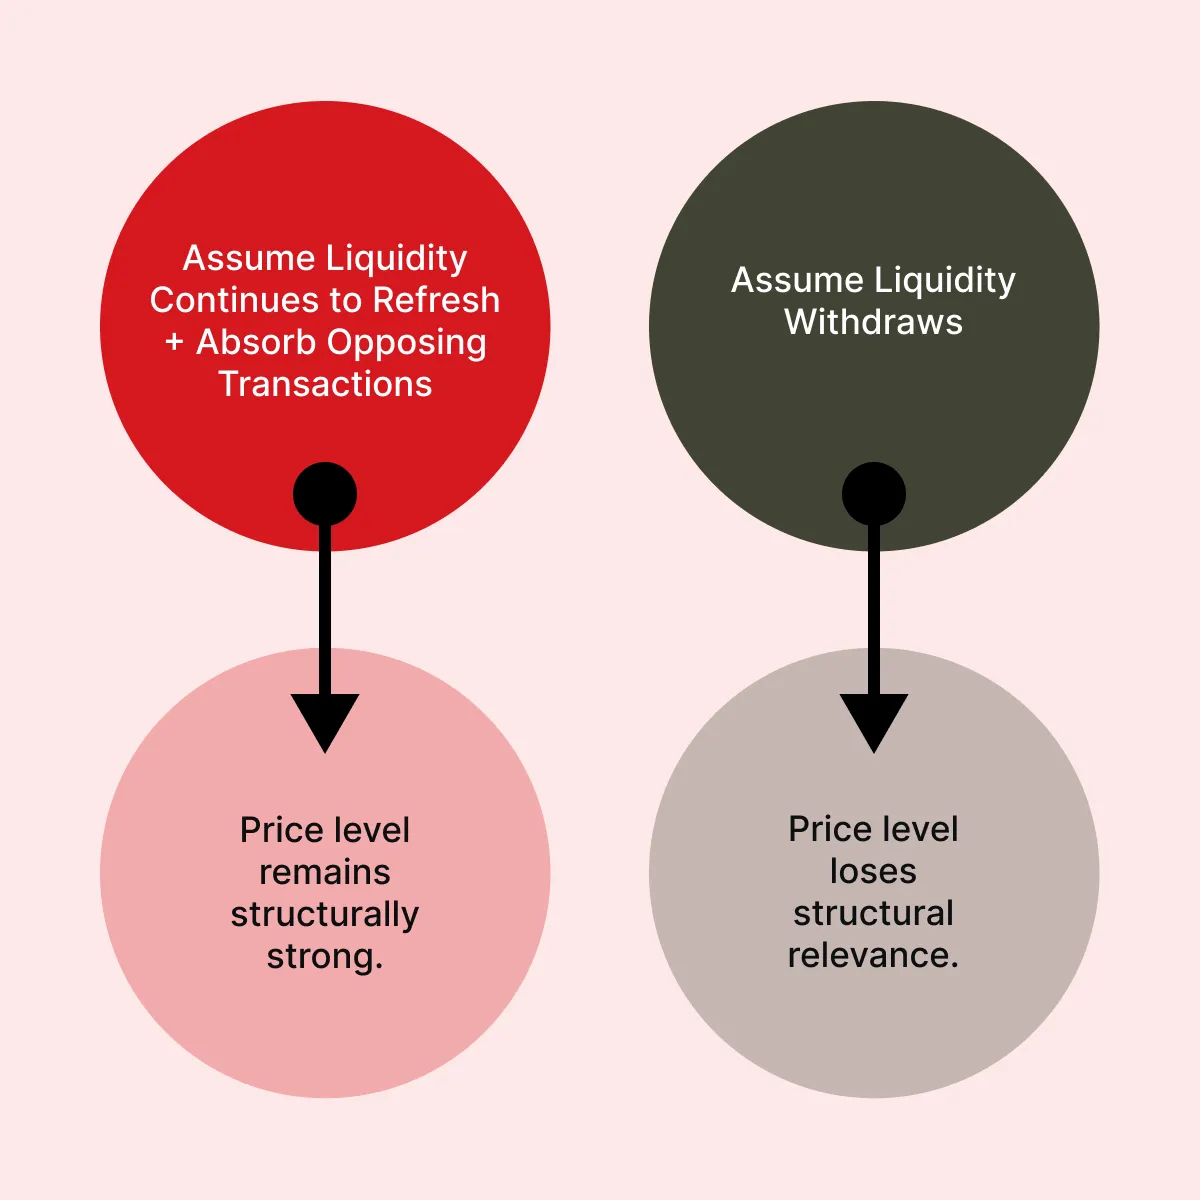
This makes liquidity behavior more important than static price levels. Nowadays, whether the price will hold or continue to move depends on:
- Structural acceptance,
- Liquidity replenishment, and
- Participation persistence.
Thus, traders may monitor participation and liquidity response rather than relying solely on historical levels.
Theme 5: News and Event Response Becomes More Transaction-Driven
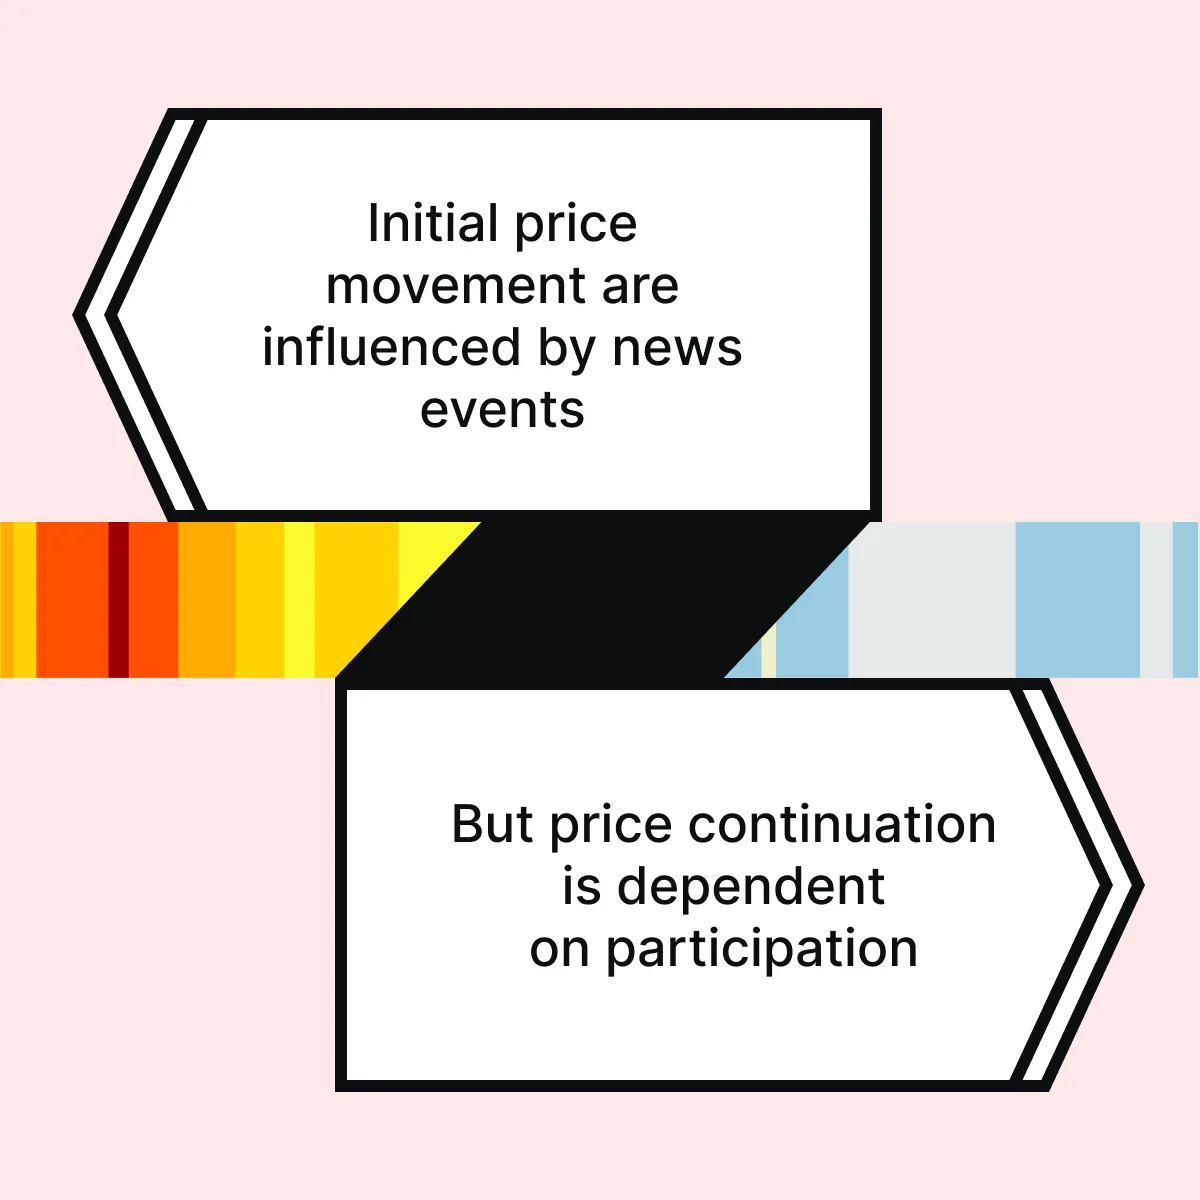
A defining feature of 2026 market behavior is that news events, economic data releases, and policy announcements continue to initiate price movement. However, these initial reactions no longer guarantee sustained directional continuation.
Previously, major news events often triggered immediate and sustained trends. Price moved rapidly and continued in the same direction as participation aligned with the narrative. In contrast, the current market structure shows a different pattern as delineated below:
- Sharp initial price movement following the news,
- Temporary stabilization near new price levels,
- Clustering of transactions as participants evaluate value, and
- Directional continuation only after sustained participation emerges.
This indicates that markets now require “transaction confirmation” before establishing trends.
In 2026, Participation Determines Directional Strength
Price movement alone does not establish durable trends. Sustained direction develops only when new transactions continue to enter the market and reinforce the move. Without ongoing participation, the price usually stabilizes or returns toward prior value areas.
Within the trading outlook 2026, markets require confirmation through:
- Ongoing transactions,
- Liquidity support,
- Structural acceptance,
This evolution also influences what to trade in 2026, as durable trends emerge from sustained participation following events, not only from the initial reaction.
Theme 6: Faster Value Migration Within Sessions
In 2026, the speed at which value forms and shifts during a single trading session has considerably increased. Value refers to the price area where the highest concentration of transactions occurs. This area reflects agreement between buyers and sellers.
The following structural changes explain this shift:
Intraday Value Is No Longer Static
In previous market environments, value often remained stable throughout the session. Early reference levels, such as the opening range or initial balance area, are used to serve as “structural anchors”.
In contrast, modern markets now show frequent intraday value migration. As new participants enter and transaction flow increases at different price levels, value shifts accordingly. This creates multiple value zones within the same session rather than a single stable reference area.
Participation Defines Emerging Value Areas
In 2026, new value areas form when sustained transactions cluster at different price levels. These clusters indicate that market participants accept a new price range as fair value. Once participation concentrates at a new level, prior reference points lose structural importance.
This “dynamic re-anchoring” shows ongoing price discovery. That’s because rotations that initially appear temporary may evolve into new value areas when participation persists.
Conclusion
The market themes for 2026 are not about predicting price movements. Instead, they are about understanding how markets behave internally. That’s because markets now spend more time moving within a range. Strong trends only happen when more buyers or sellers actively enter and support the move.
Also, liquidity has become more dynamic. Buy and sell orders move quickly, so old support and resistance levels do not always hold. At the same time, social platforms and 24/7 trading allow participants to react faster, which means sentiment can turn into real trades almost instantly.
This trading outlook 2026 shows that participation, liquidity, and value shifts are the main factors that influence real and lasting market moves. Explore tools designed to analyze modern market conditions.
FAQs
Is 2026 likely to be more volatile than prior years?
In 2026, volatility is more concentrated in short bursts rather than long and continuous trends. Price may move sharply for brief periods, but can later return to balanced conditions. This creates fewer sustained trends but more sudden expansions.
Will social platforms impact real trading behavior?
Social platforms now allow direct trade execution, which reduces the delay between discovering information and placing trades. This increases the speed of retail participation and order flow. As a result, sentiment can influence price faster.
Does 24/7 crypto access change futures markets?
Continuous crypto futures trading allows risk transfer at any time, including weekends and holidays. This reduces gaps between sessions and improves liquidity continuity. As a result, markets can adjust to new information immediately.
Should traders use old support and resistance models in 2026?
Traditional static levels are less reliable because liquidity now moves dynamically. In 2026, support and resistance depend more on “active participation” than fixed price points. Levels can weaken or shift quickly if liquidity withdraws.
How should traders think about breakout behavior?
Breakouts require sustained participation to continue. Price moving beyond a level alone does not confirm a true directional shift. Continuation develops only when liquidity supports the move and transactions increase.
Sign Up Now