See shaped more clearly in real time.
Compare plans to access deeper market visibility for shaped.
Education
February 12, 2026
SHARE
B-Shaped and P-Shaped Market Profile: How Deviations From Balance Create Weak Highs and Weak Lows
Market profile always begins with balance. When buyers and sellers agree on a price, the market naturally moves back and forth. Gradually, this activity creates a “bell-shaped curve”. How should one interpret this? The market is comfortable trading near the center of the range, where value is clearly accepted.
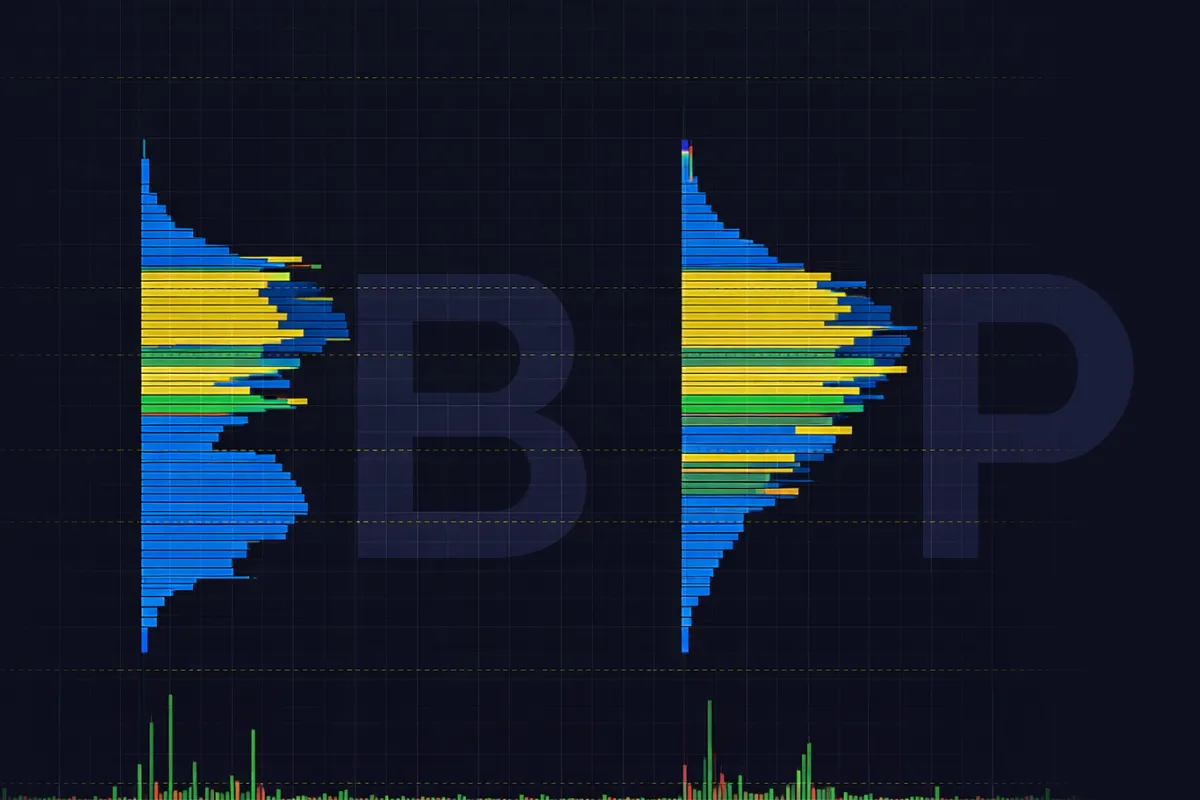
Okay, but do markets stay balanced forever? Never! As conditions change, one side, i.e., the buyers or sellers, becomes more aggressive. Slowly, value begins to shift away from the middle. The result? Profile no longer looks perfectly symmetric. Instead, it stretches toward one side, forming a B- and P-shaped market profile.
Want to understand them in detail? Read this article first to learn how and why these b-shaped and p-shaped market profile structures form. You’ll learn what they reveal about participation, value acceptance, and auction completion. Next, we’ll connect the profile structure to order flow, so you know when value is building and when it’s being exhausted.
The Bell-Shaped Curve as the Foundation
So, let’s start with what the bell-shaped curve in a market profile shows. It shows balance. It tells us that buyers and sellers broadly agree on price. Instead of price trending strongly in one direction, it keeps rotating around a central area called the “point of control (PoC)”. This PoC is where
- Most trading activity happens, and
- The market is comfortable doing business.
Okay, and when is it developed? A bell-shaped market profile usually forms when trade is two-sided. In such a market phase-
- Buyers are willing to buy,
- Sellers are eager to sell, and
- But neither side is strong enough to push the price away for long.
Since the participation is balanced, value is accepted at these prices rather than rejected. However, remember that this bell curve is not fixed. It can stretch, compress, or tilt depending on how participation changes. For example-
- Let’s assume that one side becomes increasingly aggressive over time.
- Now, value stops building in the middle.
- Instead, it starts forming closer to one edge of the profile.
This is where b-shaped and p-shaped market profile structures come from. Let’s understand better:
The similarity? You can observe that in both cases, the market is moving away from perfect balance.
From Balance to Deviation
Do you know why the markets move out of balance? That’s because of “deviation”. It happens when the price starts spending time away from the center of value. It does not rotate evenly around it. In such situations, trade remains active but is no longer symmetrical.
Moreover, in such situations, usually:
- One side of the market begins to dominate, and
- Price favors one edge of the distribution.
When this happens, the profile does not lose its bell-shaped nature. It simply becomes skewed. You still see a bell-shaped distribution, but it is deviated towards one extreme rather than sitting in the middle. Now this point is crucial.
Realize that b-shaped p-shaped market profile structures are not incomplete auctions. They only show value formation and tell us where the market has chosen to do business, rather than where it failed.
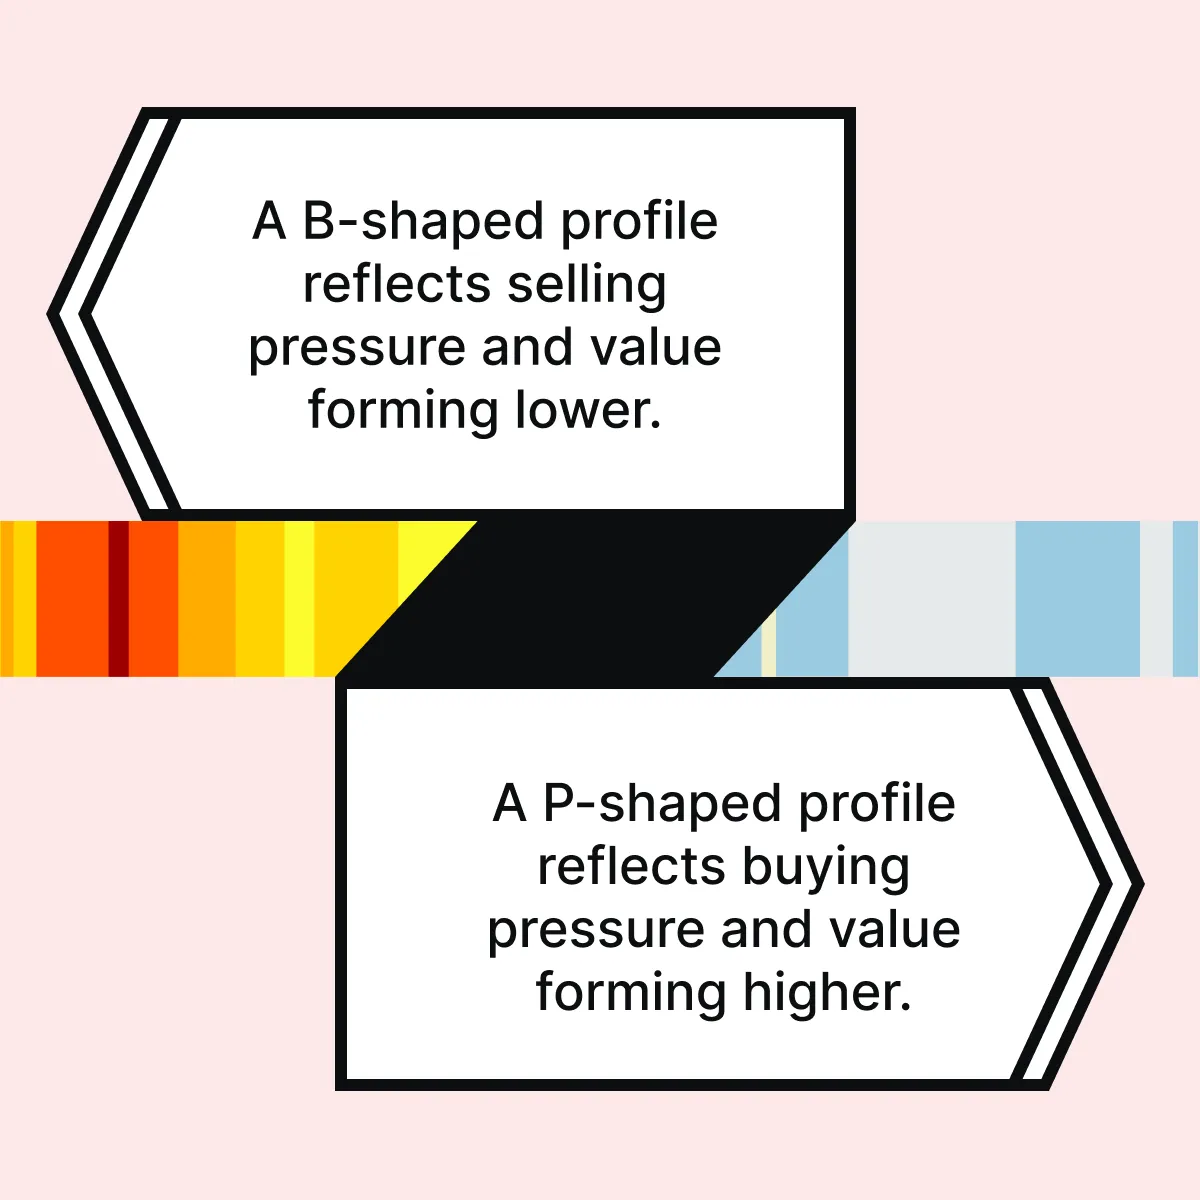
B-Shaped Profiles: Value Building Lower
A b-shaped profile forms when value builds in the “lower part of the distribution”. Price moves down and then stops trending. Instead, it begins trading near the lows. As this happens, volume starts to accumulate, and a new point of control develops lower. Let’s understand this better through a process flow:
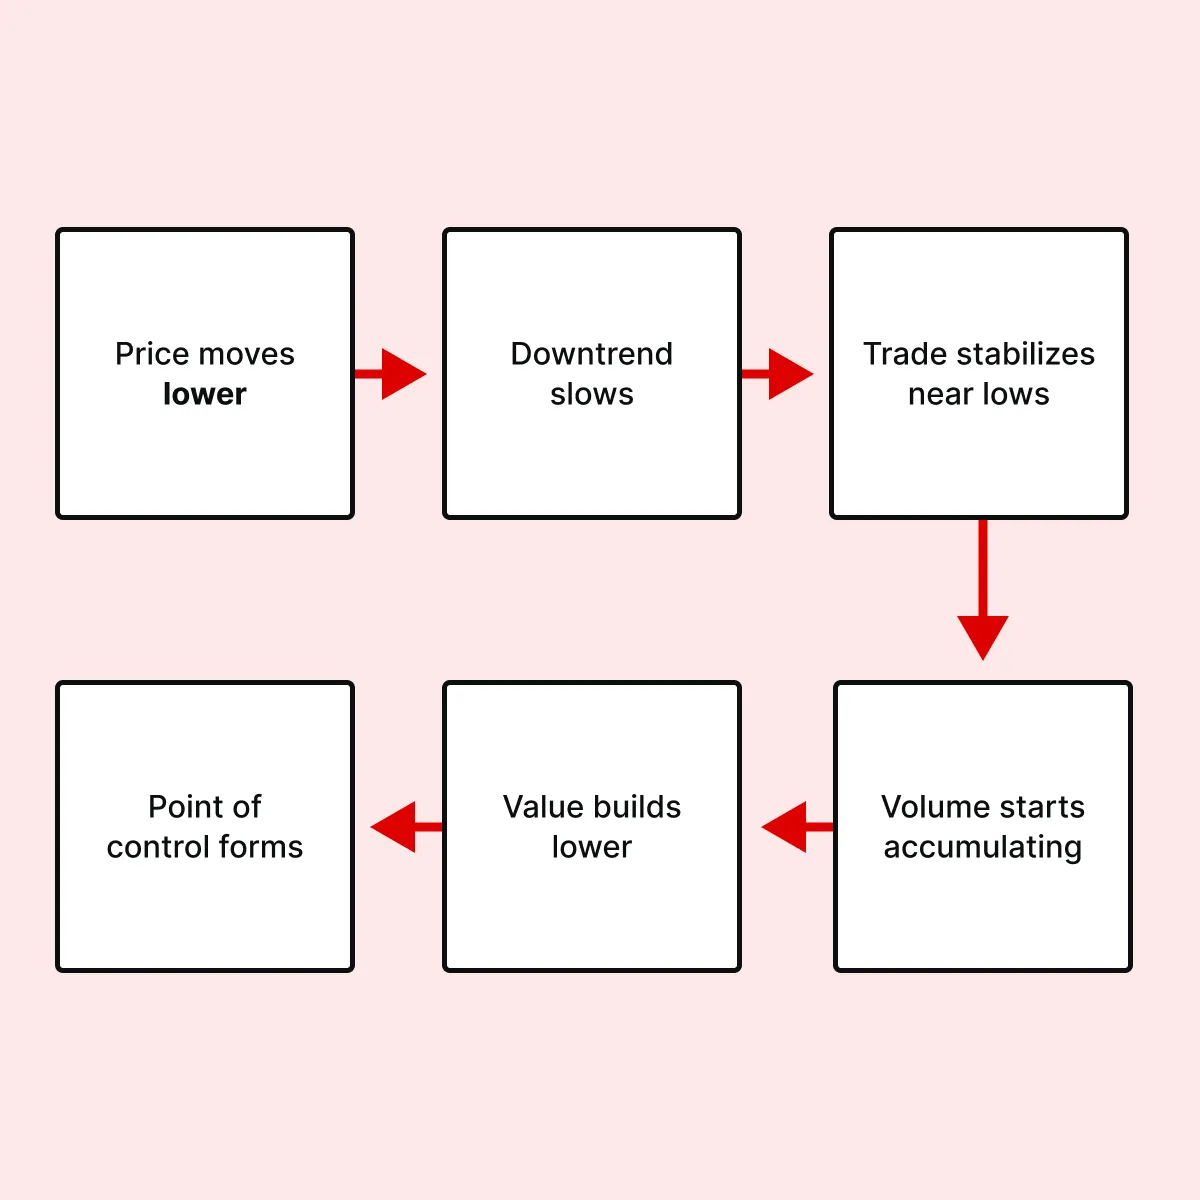
On a lower timeframe, this looks like a complete bell-shaped curve forming near the bottom of the move. Interpretation? Selling pressure has been accepted. Now, the market is comfortable trading at these lower prices. Additionally, it also shows that:
- A new value area is forming lower,
and
- The auction is completing at these prices.
So, now you know what makes the profile asymmetric? It is not a rejection of the lows. Instead, it is the concentration of value near the bottom. That concentration defines the b-shape and explains how balance evolves into structured deviation.
Why the Lower Area Becomes the Weak Point

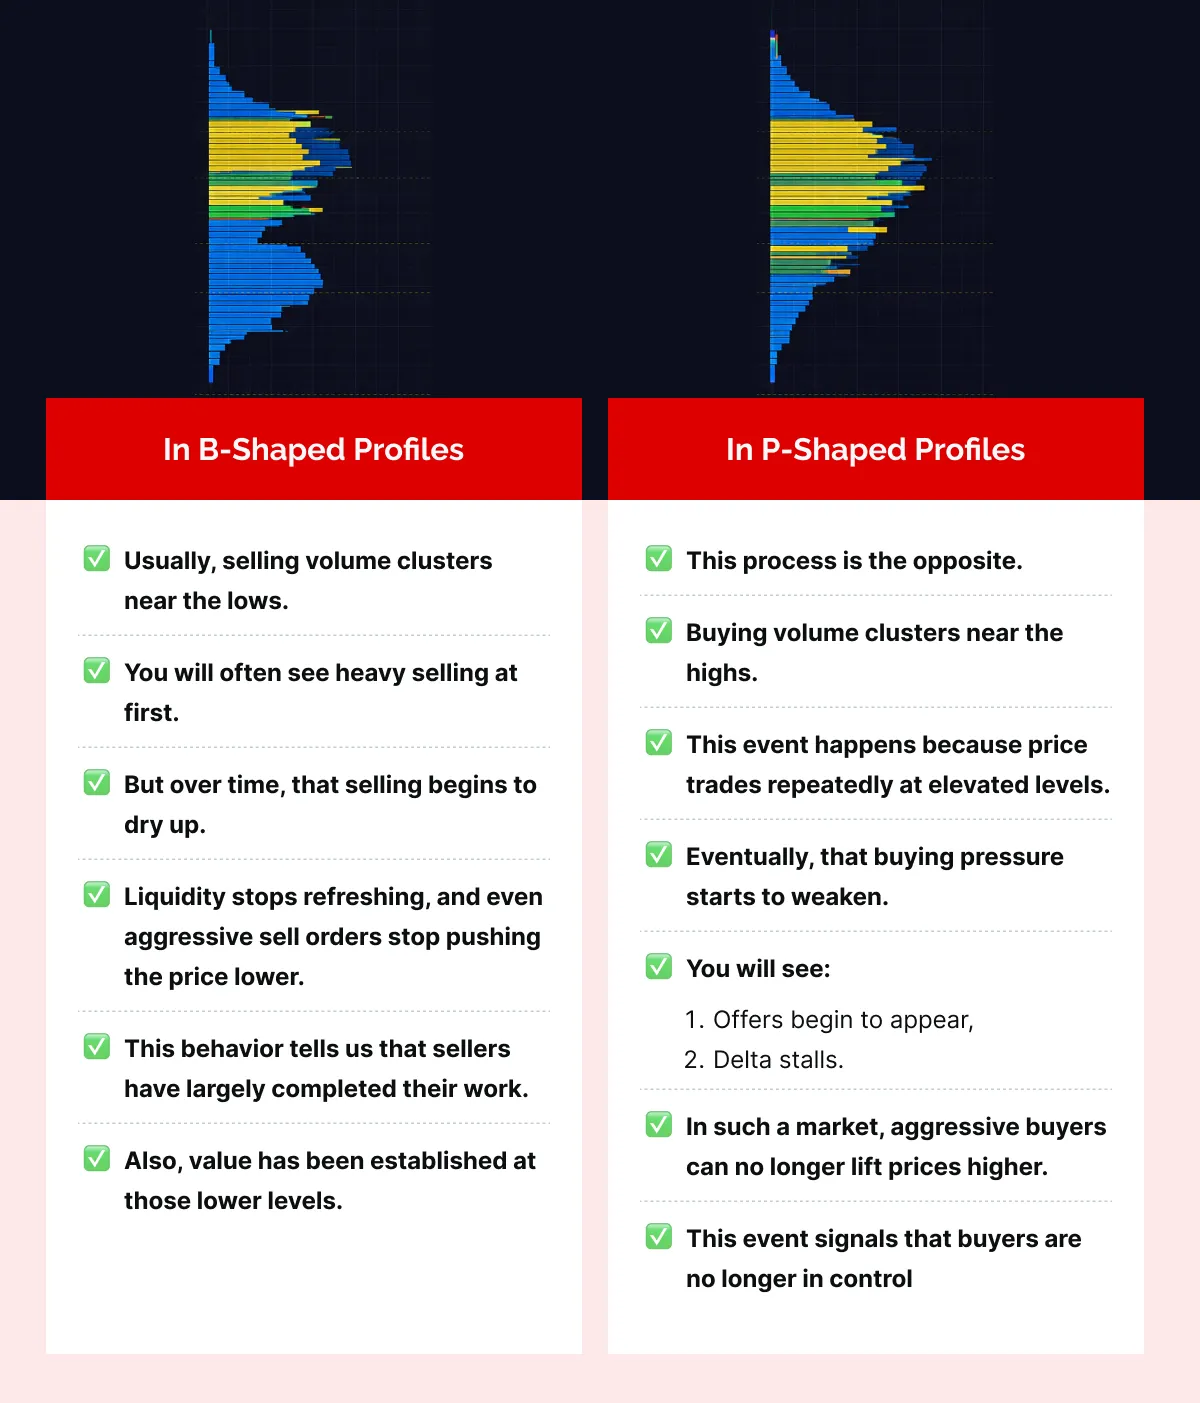
As more trading happens near the lows in a b-shaped structure, the market slowly becomes one-sided. How? Sellers continue to transact at lower prices. Thus, buyers become less active or step aside. So even though value is being built, it is being formed under “imbalanced participation”.
Now, this is why the lower area becomes weak. Is it because the auction is unfinished? Nope! That’s because the market begins to run out of sellers. Once most willing sellers have already sold, there is little left to keep pushing the price lower or even to hold it there.
Later, when the price eventually moves away, the break does not happen because the lows were suddenly rejected. It occurs because the selling pressure that created the value area has completed its job. Now, there are no fresh sellers to sustain trade at those levels. As a result, the price naturally increases.
P-Shaped Profiles: Value Building Higher
A p-shaped profile is the mirror image of a b-shape. Instead of value building lower, value builds near the highs.
- Price moves up,
- Then stops trending, and
- Lastly, begins to trade repeatedly at higher prices.
Also, volume accumulates, and a control point forms near the top of the distribution. Again, let’s understand this better through a process flow:
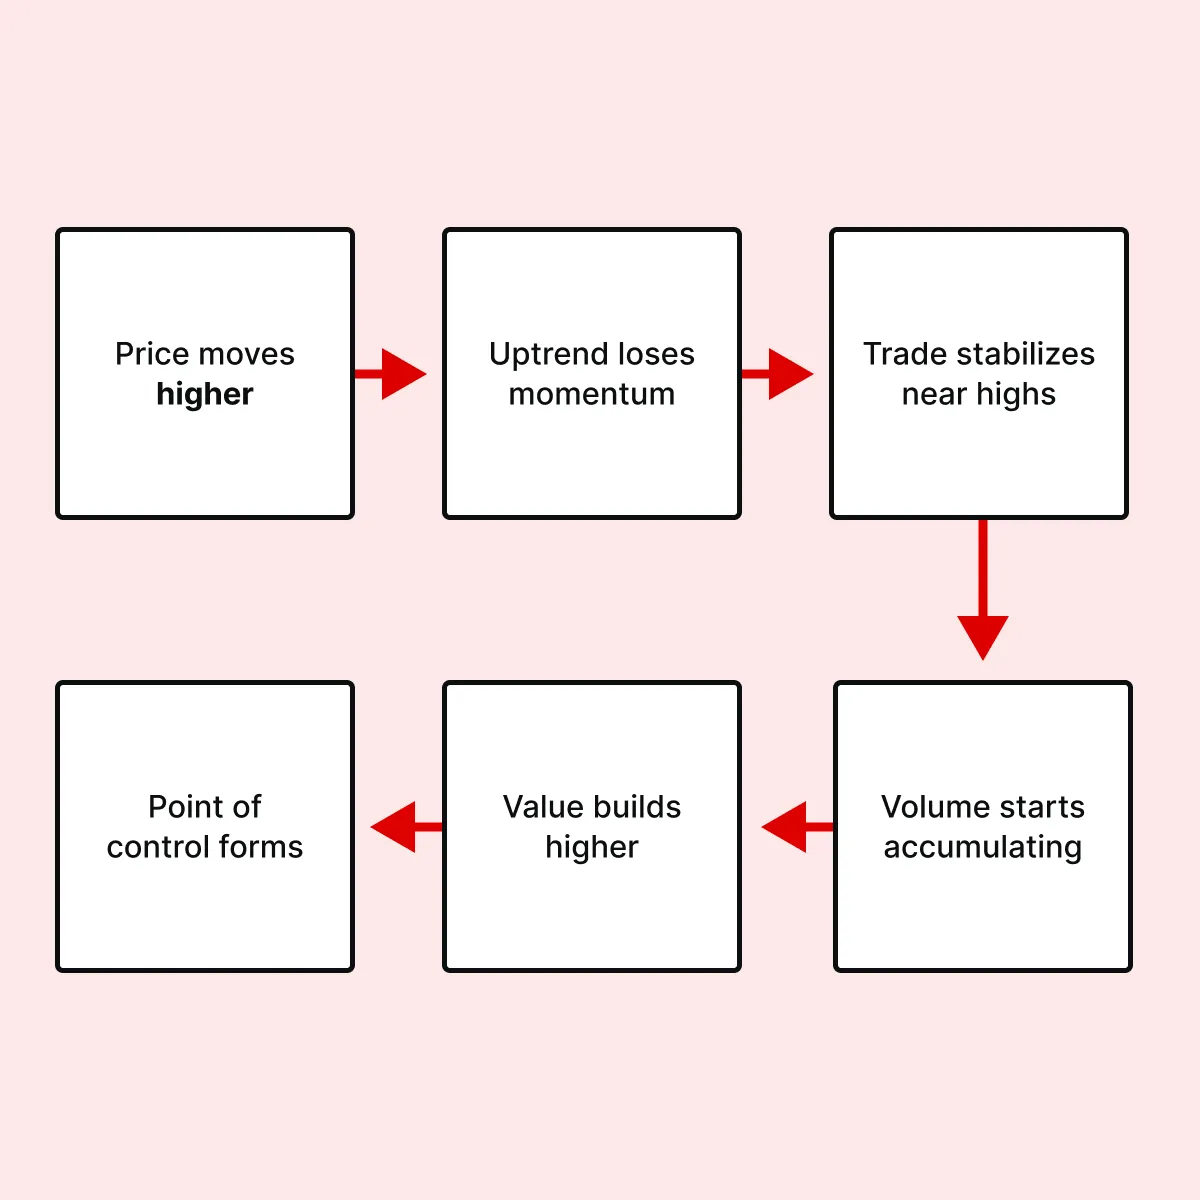
On lower timeframes, this again looks like a standard bell-shaped curve. It forms near the extreme rather than in the center. Interpretation? This type of structure reflects:
- Acceptance of higher prices,
- Sustained participation near the highs, and
- Completion of the auction at elevated levels.
Okay, so what do both these bell shapes have in common? Together, b-shaped and p-shaped market profile structures show how value can shift away from balance. They explain:
- Where the market is comfortable doing business
and
- Why can those areas later become essential reference points.
Understand who is trapped using market profile structure → Compare Packages.
Why the Upper Area Becomes the Weak Point
Note that in a p-shaped structure, value builds near the top of the range. As this happens, participation often becomes one-sided. How? In this market phase:
- More buyers continue to transact at higher prices, but
- Sellers turn passive or step away.
For a while, this supports higher prices. But gradually, the buying pressure finishes its work. Reasons? Most willing buyers have already bought. Now, there are fewer new buyers left to step in. As a result, there is little initiative to keep pushing prices higher, which makes the upper area weak.
Is it because the price was rejected? Nope! It is because the buying that supported it has been completed, which is why p-shaped profiles usually come before rotational or corrective moves. Always remember that once buying activity peaks and participation drops, the market naturally rotates away from those highs.
Auction Completion and Timeframe Context

Want to know one common misunderstanding about B-shaped and P-shaped market profile structures? It comes from timeframe confusion. In the session timeframe, these profiles look asymmetric and unfinished. But when you zoom in to a shorter timeframe, you will see something different.
At the lower timeframe, the price has already formed a complete bell-shaped distribution near the high or low. Now, what does this mean?
- The auction has been completed locally, and
- The market has already found where it is comfortable doing business at that level.
Now, what comes next is not a continuation of the same auction. It is a reaction to its completion. Understanding this distinction is highly important for traders. When you have this knowledge, you will not:
- Fade value too early, and
- Chase price after participation has already peaked.
See weak highs and lows form through order flow → Compare Plans
Reading These Profiles With Order Flow
Order flow analysis is one of the best ways to confirm where value is truly forming, not just where price has been. It shows:
- Whether participation is still active,
or
- Starting to fade at key areas of the profile.
Let’s understand how you can make an order flow analysis in both types of bell distributions:
In both cases, order flow changes show that participation at the extreme has finished, rather than failing. So this is how order flow adds clarity to B-shaped and P-shaped market profile structures. They confirm:
- When value formation is complete,
and
- The market is ready to respond.
Conclusion
Till now, you must have understood that B-shaped p-shaped market profiles do not signal rejection or a broken auction. Then what do they show? They indicate that value is being built away from the center of balance. The market is still doing business, and now this business is being done closer to one extreme of the distribution.
Next, you must understand that the weakness in these structures does not come from unfinished auctions. Instead, it comes from “completed auctions”, where participation has become one-sided and then exhausted.
Realize that sellers finish their work in b-shaped profiles, and buyers finish their work in p-shaped profiles. Once that happens, there is little left to sustain the price at those levels.
So, how can all this knowledge help you? By understanding how b-shaped and p-shaped market profile structures form, you can better recognize when price is likely to rotate or transition. Connect profile shape with real liquidity behavior → Compare Packages
FAQs
1. Are b-shaped and p-shaped profiles unfinished auctions?
No, these profiles represent completed auctions on a lower timeframe. Note that the price has already spent enough time near the high or low to build value. At this moment, they look incomplete only on the session view. But structurally, the market has already finished doing business at that level.
2. Why do these profiles often lead to reversals?
Reversals usually happen because participation becomes one-sided and then fades.
- In b-shaped profiles, sellers finish selling.
and
- In p-shaped profiles, buyers finish buying.
Once that activity is exhausted, there is little reason for the price to stay there. As a result, the market often rotates.
3. Do b-shaped and p-shaped profiles always reverse?
No, a reversal depends on context and confirmation. B-shaped and P-shaped market profiles do not show market direction. They are used just to describe structure.
Without signs of participation fading or order flow changing, the price can still hold or even continue.
4. How does Bookmap help interpret these profiles?
Bookmap is an advanced real-time market analysis tool. Using it, you can visualize:
- Where volume builds
- How liquidity appears or disappears
- When aggressive buyers or sellers stop moving the price
The advantage? This makes it easier to see when b-shaped and p-shaped market profile participation is completing near the extremes.
Sign Up Now