See price more clearly in real time.
Compare plans to access deeper market visibility for price.
Stocks
August 6, 2024
SHARE
Exploring Market Moves: A Trader’s Guide to Price Action in Stock Trading

“Price action” refers to the analysis of historical price movements. Instead of relying on indicators or complex algorithms, price action traders study patterns, trends, support and resistance levels, and other factors in the price chart to make trading decisions. Following this strategy, traders interpret price movements in real time.
This article will help us understand the fundamentals of price action and understand how traders can go beyond traditional candlestick patterns to detect price movements and trading volume.
We will also study several advanced price action strategies and see how traders can identify high-probability trade setups using real-time data. Read on to delve deep into the topic and refine your trading approach.
The Fundamentals of Price Action in Trading
For a long time, price action has involved the analysis of candlesticks. However, modern traders have expanded the scope by studying price movements and trading volume through advanced visualization tools, such as Bookmap. This expanded definition provides traders with deeper insights into market behavior.
Let’s see how traders use Bookmap
Bookmap is an advanced market analysis tool. It provides a detailed visual representation of market data, including:
- Liquidity,
- Volume, and
- Price levels.
It enhances the understanding of price action by providing:
- Heatmaps
-
-
- Bookmap’s heatmap displays the order book.
- The heatmap shows areas, where buy and sell orders, are concentrated.
- Areas with a high concentration of orders (high liquidity) appear brighter.
- This insight allows traders to identify potential support and resistance levels in real-time.
-
- Volume Dots
-
- These dots overlay the heatmap and represent actual trades.
- The size and color of the dots indicate the volume and type (buy or sell) of trades.
- Traders analyze volume dots to gain insights into:
- Market sentiment
and
- The strength of price movements.
-
- This indicator shows the net difference between buying and selling volume over time.
- A rising CVD indicates buying pressure.
- Conversely, a falling CVD indicates selling pressure.
What is the importance of visual maps in trading?
Modern tools like Bookmap provide visual maps that offer real-time insights into market dynamics. They offer information using which traders can react quickly to changing conditions. Furthermore, visual maps help in:
- Identifying hidden liquidity,
- Enhancing risk management, and
- Confirming Price movements.
Let’s understand how:
| Identifying Hidden Liquidity | Enhancing Risk Management | Confirming Price Movements |
|
|
|
Price Action Strategies for Stock Trading
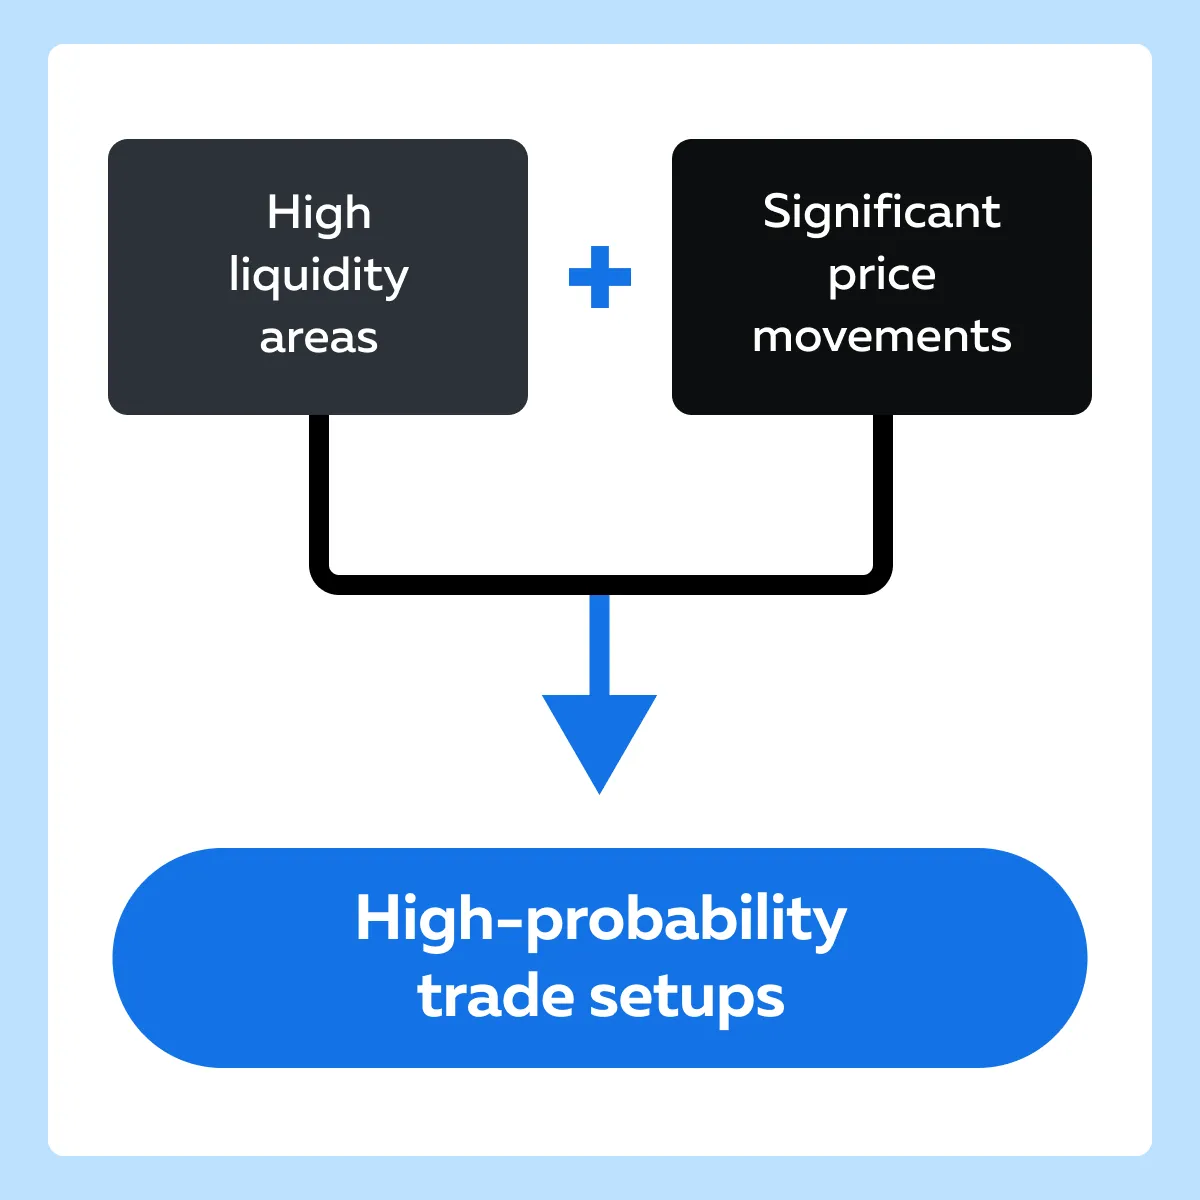
To enhance the chances of trading success, traders identify high-probability trade setups. These setups occur when certain market conditions align to signal potential entry or exit points. One effective strategy involves observing the convergence of:
- High liquidity areas
with
- Significant price movements.
Let’s understand this strategy in detail:
- High Liquidity Areas
-
- These are “price levels” where there is a large concentration of buy or sell orders.
- These areas often act as strong support or resistance levels.
- That’s because they represent points of significant interest from market participants.
- Sudden Increase in Liquidity
-
- A sudden increase in liquidity at a specific price level signals a major:
- Support zone
- A sudden increase in liquidity at a specific price level signals a major:
or
- Resistance zone.
- For example,
- Say a large number of buy orders appear at a particular level.
- This appearance suggests that many traders see this level as a good buying opportunity.
- Sharp Price Movements
-
- When the price moves sharply toward a high liquidity area, it often indicates that the market is testing this level.
- If the price hits this area and bounces back, it confirms the presence of strong support or resistance.
- Combining Liquidity and Price Movements
-
- Traders look for the convergence of:
- Liquidity
- Traders look for the convergence of:
and
- Price movements.
- Mostly, a sudden increase in liquidity combined with a sharp price movement toward this level signals a high-probability trade setup.
- For example,
- Assume that the price sharply declines to a level with high buy orders.
- Then it starts to rise.
- This situation signals a good entry point for a long position.
How do time trades use real-time data?
Real-time data is crucial for timing trades with greater precision. It allows traders to observe the evolution of:
- Price movements
and
- Liquidity in real-time
This observation helps in quickly adjusting strategies. For example,
- Assume a long position is taken.
- The real-time data shows increasing sell orders at a nearby level.
- The trader decides to exit the position early to avoid potential losses.
Additionally, real-time data helps in:
| Catching Breakouts | Avoiding False Breakouts |
|
|
How Do Real-Time Insights Help Manage Risk?
Real-time insights are essential for effective risk management. They provide immediate data on:
- Price stability
and
- Liquidity conditions.
Most traders use this data to:
- Set Dynamic Stop-Losses
-
- Real-time data allows traders to set dynamic stop-loss levels based on current market conditions.
- For example,
- Say a trader enters a long position.
- To manage risk, they place a stop-loss just below a high liquidity area where buy orders are concentrated.
- As the market evolves, the trader adjusts the stop-loss.
- This adjusted stop-loss reflects new liquidity levels.
- Assess Price Stability
-
- An observation of real-time data helps in assessing price stability.
- If the price is volatile and lacks clear direction, it is usually prudent to:
- Reduce position size
or
- Avoid entering new trades.
- This strategy can be followed until stability returns.
Let’s understand risk management better using a hypothetical example:
- Assume that a trader enters a long position in a stock.
- This stock has shown strong support at $100.
- Using real-time data, the trader notices a significant increase in sell orders at $105.
- The trader adjusts their stop-loss to just below $100.
- This adjustment protects them against a potential downturn.
- Also, they set a take-profit target of around $105.
- This placement helps in capitalizing on the expected resistance.
Advanced Price Action Techniques
When traders integrate price action with order flow analysis, they gain a comprehensive understanding of market dynamics. This approach becomes particularly powerful when using tools like Bookmap, which provides unique features, such as the Heatmap for visualizing live order flow and volume.
It is pertinent to note that these features unveil hidden patterns of market behavior that go beyond what traditional price action analysis alone can reveal. Let’s understand better through a hypothetical example:
Market Observation
- A trader watches a market that has been declining steadily over the past few trading sessions.
- The trader observes price action signals (lower highs and lower lows) indicating a bearish trend.
Heatmap Analysis
- Using Bookmap’s Heatmap feature, the trader identifies a key resistance level.
- At this level, a large sell order cluster has formed.
- This cluster is depicted by intense red coloring on the Heatmap.
- This kind of coloring shows significant selling pressure at that level.
- This means sellers are heavily positioned at the resistance level.
Alignment with Price Action Signals
- Concurrently, the trader observes a downward price action signal.
- They spot a bearish candlestick pattern.
- This pattern confirms the bearish sentiment in the market.
- Also, it aligns with the insight gained from the Heatmap and indicates a convergence of signals.
- This market situation points towards a potential short-sale opportunity.
The decision to Execute the Trade
- The trader decides to execute a short sale trade based on the combined analysis of:
- Price action
and
- Order flow visualizations
- This short sale is executed at the key resistance level identified on the Heatmap
- The presence of the large sell order cluster adds conviction to the trade
- It suggests a high probability of continued downward pressure at that level
Risk Management Considerations
- Before entering the trade, the trader sets appropriate risk management parameters.
- They set a stop-loss order to limit potential losses if the market moves against the trade.
- Additionally, the trader also tried gradually scaling into the position to manage risk exposure effectively.
Trade Execution and Monitoring
- The trader enters the short sale position as planned
- They monitor the market closely for any signs of:
- Reversal
or
- Weakening selling pressure.
- Throughout the trade, the trader continues to reference both:
- Price action
and
- Order flow visualizations.
- This kind of analysis helps in:
- Assessing the validity of the trade thesis
and
- Making any necessary adjustments to the position.
Profit Taking or Exiting the Trade
- Now, the trader can choose to exit the short-sale trade either partially or entirely.
- This decision is usually dependent on the:
- Trader’s profit-taking strategy
or
- If the market conditions change.
- Moreover, the trader will make this decision based on their analysis of price action dynamics and order flow patterns.
Visualizing Price Action with Bookmap
Bookmap is a powerful market analysis tool. Being the choice of several traders, it provides a detailed visualization of market activity and tells:
- What are the key price levels?
- Where are trades getting executed?
- How can these areas signal potential price movements?
- What are the directions of prevailing trends?
By utilizing features like heatmaps and volume dots, traders can identify potential reversals without relying on traditional candlestick formations. Let’s understand both of these features individually:
How to Use Heatmap Visualization?
- Bookmap’s heatmap visualizes the order book, showing the concentration of buy and sell orders at different price levels.
- Areas with high liquidity (large numbers of orders) appear as bright spots on the heatmap, while low liquidity areas are darker.
- Here’s how traders interpret the heatmap:
| Support and Resistance Levels | Liquidity Shifts |
|
|
- By observing how the price interacts with these bright areas, traders can gauge market strength.
- If the price approaches a bright area and then reverses, it confirms the presence of strong support or resistance.
How to Use Volume Dots?
- Volume dots on the Bookmap chart represent executed trades.
- The size of the dot corresponds to the trade volume.
- The color of the dot indicates the trade type (e.g., blue for buys, red for sells).
- Here’s how traders interpret the volume dots:
| Trade Clusters | Volume Surge |
|
or
|
- When a price approaches a known support or resistance level, observing the volume dots provides “confirmation”. For example,
- Say a large number of buy dots appear as the price hits a support level.
- This appearance indicates that the price level is likely to hold.
How to Use Bookmap’s Features to Identify Key Price Levels, Trend Directions, and Reversals?
Most traders use Bookmap’s advanced visual tools like heatmaps and volume dots to identify:
- Key price levels,
- Trend directions, and
- Potential reversal.
Let’s see how:
| Parameters | Explanation |
| Key Price Levels | Support and Resistance
Order Book Depth
|
| Trend Directions | Price Flow
Volume Patterns
|
| Potential Reversals | Liquidity Absorption
Divergence
but
|
Let’s understand the practical application better using a hypothetical example:
Identifying Support Level
- Suppose the heatmap shows a bright area around $50.
- This is an indication of high buy orders.
- As the price approaches this level, large blue volume dots appear.
- This appearance confirms strong buying interest.
- Traders can place a long position near this support level and anticipate a bounce.
Catching a Breakout
- The heatmap shows a bright resistance area at $55.
- A strong breakout is signaled if all these conditions are met:
- The price approaches this level.
- The volume of dots is increasing.
- The price eventually breaks through with a surge of blue volume dots.
- Now, traders can enter a long position just as the breakout happens.
- This way, they can ride the momentum.
Avoiding False Breakouts
- A false breakout is signaled when:
- The price nears a resistance level, and
- There is a bright heatmap indication.
- The volume dots, however, do not show significant buying activity.
- In this case, traders should wait for confirmation from volume dots before committing to a trade.
Conclusion
Utilizing real-time visualization tools like Bookmap is crucial for effective price action analysis in stock trading. This tool offers immediate insights into market dynamics and helps traders make informed decisions. By understanding how order flow and price action are interconnected, traders can refine their strategies and better spot market trends.
Also, Bookmap’s features, such as the heatmap, reveal hidden patterns of behavior that traditional analysis may miss. Thus, traders are encouraged to use these advanced tools to improve their trading outcomes. Looking for more in-depth information? Discover how order flow and price action are interconnected in our detailed exploration.
Sign Up Now