See cause effect more clearly in real time.
Compare plans to access deeper market visibility for cause effect.
Trading Basics
April 2, 2024
Updated
SHARE
Cause and Effect in Trading: Understanding Market Influences for Beginners
Do you wonder how successful traders precisely predict market movements and strategically position themselves? They do this by understanding cause and effect in trading. This vital skill helps traders reduce risks and enhance their chances of success.
In this article, we will understand what cause and effect mean in trading – how different events and factors can affect the prices of stocks, currencies, and commodities. You’ll also learn about how some common factors, such as economic indicators, central bank decisions, and geopolitical events impact trading and price movement.
Also, we’ll discuss advanced market analysis tools like Bookmap and the usage of trendlines and heatmaps, that help traders recognize patterns and trends. Let’s get started.
What is Cause and Effect in Trading?
In the context of trading and financial markets, cause and effect refer to the relationship between events or factors and the subsequent impact on asset prices. Let’s understand the terms individually:
| Cause | Effect |
| Cause represents the event or factor that influences the market. | Effect is the resulting impact on asset prices in response to the cause. |
Traders and investors analyze these cause-and-effect relationships to make informed decisions about buying or selling financial instruments. They strive to understand the reasons behind price movements to anticipate future trends. Usually, a cause and effect analysis involves identifying and interpreting the “factors” that drive market behavior.
Which Factors Influence Market Movements?
This is a list of major factors that influence market movements:
- Economic data, such as GDP growth, employment figures, and inflation rates
- News related to a company’s earnings, product launches, or management changes
- Geopolitical events, natural disasters, or changes in international relations
- Central bank decisions on interest rates
- Investor perception, fear, and greed
Now, let’s understand the concept of cause and effect through some examples:
| Example | Cause | Effect |
| Company Performance |
|
|
| Economic Indicators | Government releases a report showing a higher-than-expected increase in employment. |
|
| Interest Rates | Central bank announces an interest rate hike |
|
Common Causes in Trading
Understanding the impact of some common causes that affect trading is crucial for investors and traders to make informed decisions. Let’s explore them below:
- Economic Indicators:
-
-
- Economic indicators, such as GDP growth, unemployment rates, and consumer spending, provide insights into the health of an economy.
- Positive economic data boosts investor confidence and leads to an increase in buying activity.
- For example,
- A country reports higher-than-expected GDP growth.
- Investors interpret it as a sign of a thriving economy.
- This interpretation causes:
- An increase in the demand for that country’s currency and
- A rise in stock prices.
-
- Central Bank Decisions:
-
-
- Central banks, like the Federal Reserve in the U.S. or the European Central Bank, influence markets through interest rate decisions and monetary policy.
- Changes in interest rates impact:
- Borrowing costs,
- Spending, and
- Investment decisions.
- For example,
- A central bank raises interest rates to curb inflation.
- This rise increases the borrowing costs for businesses and individuals.
- Consequently, the economic activity slows down and affects stock prices as well as currency values.
-
- Geopolitical Events:
-
-
- Political events, such as elections, trade tensions, or conflicts, significantly impact market sentiment.
- Uncertainty or instability in geopolitics often leads to increased volatility.
-
- Corporate Earnings:
-
- The financial performance of individual companies directly influences their stock prices.
- Positive earnings reports attract investors, while disappointing results lead to a decline in share prices.
How do Interest Rates Impact Mortgage Rates and Currency Values?
Changes in interest rates set by central banks affect various aspects of the economy. Higher interest rates:
- Increase borrowing costs,
- Impact consumer spending, and
- Alter business investment plans.
Changes in interest rates deeply impact mortgage rates and currency values. Let’s understand what happens when there is an increase in the interest rates:
| Mortgage Rates | Currency Values |
|
|
The Effect on Asset Prices
As discussed above, “causes” impact the prices of different asset classes such as stocks, currencies, and commodities. Let’s understand it further using some common industry events:
- A country reports robust job creation figures. Investors interpret this as a sign of a healthy economy, leading to increased demand for stocks
- A central bank lowers interest rates to stimulate economic activity. Since borrowing becomes more attractive, this cause leads to higher stock prices. Also, higher rates attracted foreign capital, leading to currency appreciation.
- Due to geopolitical tensions, an environment of uncertainty is created, leading to increased volatility in stock prices. This cause:
- Leads to a sell-off in stocks as investors seek safer assets and
- Affects the supply and demand dynamics of commodities.
- A tech company releases a new product that surpasses revenue expectations. This cause results in a surge in its stock price.
Short-Term vs. Long-Term Factors
In trading, investors need to consider both short-term and long-term factors. This helps adapt their strategies based on the nature and duration of the catalysts influencing asset prices. Let’s understand their impact on asset prices below:
| Short-term | Long-term |
| In short-term, market reactions to events like economic data releases or geopolitical events are swift and result in immediate price fluctuations. | Trends driven by factors like sustained economic growth, consistent corporate performance, or prolonged changes in interest rates have a gradual and lasting impact on asset prices over time. |
Analyzing Market Trends and Patterns
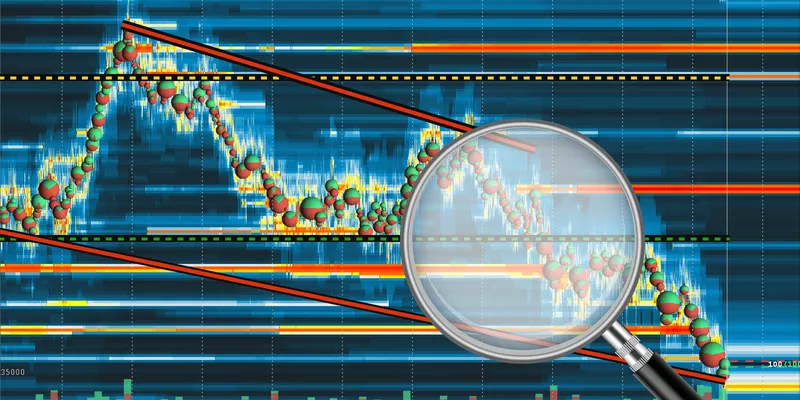
Traders can identify and analyze market trends by examining historical price data to:
- Predict recurring patterns and
- Understand the cause-and-effect relationships that drive those trends.
Several tools and techniques can be used to spot trends. However, one common approach is to analyze charts and patterns. Read the 3-step process below to understand and identify trends with historical price data:
| Steps | Explanation | Indication/Method |
| Perform Technical Analysis | It refers to studying historical price charts and patterns to make predictions about future price movements. | Technical analysts use the following tools to identify trends:
|
| Recognize Trend Directions | Traders spot trends to predict future price movements. |
|
| Analyze Historical Price Data | Traders examine historical price data to identify patterns and trends. |
|
Let’s understand the step-by-step process of trend identification using a specific example related to quarterly earnings reports on stock prices.
- Step I: Gather historical data on a particular stock. Include quarterly earnings reports and corresponding stock prices recorded over several years.
- Step II: Examine how the stock price typically reacts to the earnings reports. Look for recurring patterns, such as:
- A consistent increase following positive reports or
- A decline after disappointing ones.
- Step III: Apply technical indicators to the stock chart to confirm:
- Trends and
- Potential reversal points.
- Step IV: Categorize earnings reports into positive, negative, or neutral outcomes. Note how the market reacts to each category.
- Step V: Analyze the fundamental factors influencing the earnings reports, such as:
- Revenue growth,
- Profit margins, and
- Guidance provided by the company.
- Step VI: Relate the cause (earnings performance) to the effect (stock price movement) to understand the market’s reaction.
- Step VII: Develop or adjust trading strategies based on the identified patterns.
Some Basic Tools and Indicators
Traders can refer to the following tools and indicators for identifying patterns and predicting price movements:
| Tools & Indicators | Meaning |
| Trendlines | Drawn on price charts to identify the direction of the trend. |
| Support and Resistance Levels | Horizontal lines that indicate price levels where an asset tends to stop moving and may reverse. |
| Moving Averages (MA) | MAs give price data that helps in identifying trends over a specific period. |
| Relative Strength Index (RSI) | Measures the magnitude of recent price changes to evaluate overbought or oversold conditions. |
| Moving Average Convergence Divergence (MACD) | Compares two moving averages to identify potential trend reversals. |
How Bookmap Can Help
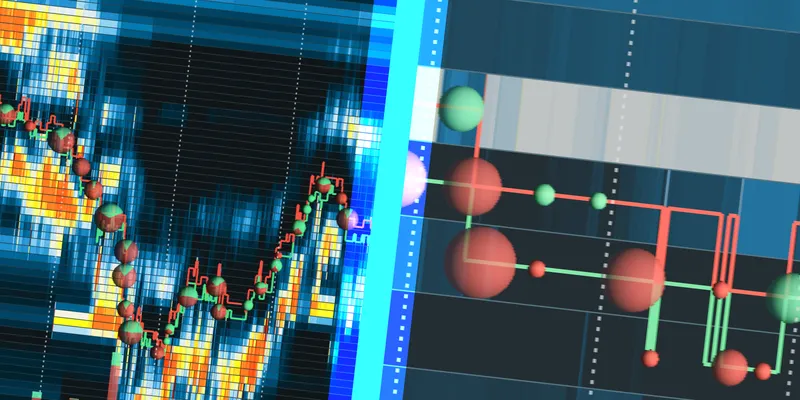
Bookmap is an advanced market analysis tool that provides real-time visualization. It helps traders understand market liquidity and order flow. Some notable features include:
- Heatmaps:
-
-
- Visualize market depth and liquidity by displaying areas of high and low trading activity.
- Help traders identify significant price levels where large orders are clustered.
-
- Volume Indicators:
-
- Display volume profiles to show where most trading activity occurs.
- Allow traders to identify areas of high or low liquidity and potential support or resistance levels.
How Important are Context and Background Information?
Context and background information provide a comprehensive understanding of market dynamics. Since global events and financial markets are interconnected, this contextual awareness enhances the accuracy of analysis.
Often, geopolitical events, policy changes, or macroeconomic reports precede significant market movements. By considering these factors, traders gain a broader context for interpreting market movements.
Let’s understand how it happens:
- Increased geo-political tensions in the Middle East lead to a rise in oil prices, affecting various sectors.
- Central bank decisions and changes in monetary policy influence:
- Interest rates and
- Currency values.
- Releases such as GDP growth, employment figures, or inflation rates provide insights into the overall health of an economy and influence investor sentiments as well as market trends.
The Practical Usage of Bookmap
Let’s consider a situation where there’s a sudden increase in oil prices due to geopolitical tensions affecting global oil supply. Traders can use Bookmap to track the real-time impact of this event on different sectors. Let’s understand how:
- Using Heatmaps:
-
-
- Traders can use Bookmap’s heatmaps to:
- Visualize market liquidity and
- Identify areas with significant trading activity related to oil-sensitive sectors.
- Traders can use Bookmap’s heatmaps to:
-
- Analyzing Volume Indicators:
-
-
- Using volume indicators, traders can observe trading volumes in sectors like:
- Energy,
- Transportation, and
- Manufacturing.
- Higher volumes may indicate increased investor interest.
- Using volume indicators, traders can observe trading volumes in sectors like:
-
- Perform Real-Time Analysis:
-
- Using Bookmap, traders can track how energy sector stocks respond to rising oil prices in real time.
- They can do so by looking for increased demand in energy stocks as investors anticipate higher profits for oil companies.
Strategies for Navigating Cause and Effect
Navigating cause-and-effect relationships requires a combination of:
- Strategy,
- Analysis, and
- Risk management.
Beginners can benefit from understanding these principles and gradually developing a disciplined approach to trading. Now, let’s understand some common strategies below:
| Strategy | Explanation |
| Contrarian Investing |
|
| Diversification and Risk Management |
|
For a better understanding, read a hypothetical example below and see how savvy traders respond to an overreaction in the stock market after a political event.
Scenario
A major political event triggers an abrupt market downturn due to panic selling.
The Initial Reaction
- Contrarian investors see this as an opportunity to buy undervalued stocks, expecting a correction.
- Being savvy traders, they use advanced tools like Bookmap for real-time data visualization.
- They carefully analyze the market’s immediate response by using features such as:
- Heatmaps to pinpoint crucial support and resistance levels, and
- Volume indicators to gauge the intensity of panic-driven selling.
Market Evaluation & Taking Action
- Traders evaluate the situation and recognize that the initial market reaction may not accurately reflect the event’s long-term consequences.
- They identify undervalued stocks and strategically enter positions by going against prevailing sentiment.
Market Stabilization & Booking Profits
- Days later, the market stabilizes and panic subsides.
- Stock prices rebound as the market begins to comprehend the true implications of the political event.
- These traders witness a correction and square off their positions to book profits.
How to Stay Informed about Market-Moving Events and News?
- Monitor News Regularly
-
-
- Stay updated on financial news through reputable sources to be aware of events that could impact the markets.
-
- Refer to an Economic Calendar
-
-
- Refer to an economic calendar that highlights upcoming:
- Economic reports
- Central bank meetings, and
- Other key events.
- Refer to an economic calendar that highlights upcoming:
-
- Utilize Financial News Platforms
-
-
- Follow financial news platforms and social media accounts for real-time updates and expert analyses.
-
- Subscribe to Research Services
-
-
- Subscribe to research services or newsletters that provide in-depth analysis and insights into market-moving events.
-
- Utilize Market Analysis Tools
-
- Utilize market analysis tools and platforms, like Bookmap, and Bloomberg or Reuters, which offer comprehensive information on global markets and economic indicators.
Conclusion
Understanding cause and effect in trading is crucial for informed decision-making, strategic positioning, and risk management. It enables traders to analyze the factors driving market movements and identify contrarian opportunities.
The knowledge gained from cause-and-effect analysis helps traders make proactive decisions based on economic indicators, central bank decisions, and geopolitical events. Additionally, it underscores the importance of diversification, allowing traders to spread investments across different asset classes for risk mitigation.
Using advanced market analysis tools like Bookmap, and its modern features such as Heatmap and Volume indicator, can also gain traders a competitive advantage.
Curious about how deeper psychological factors influence the cause and effect in trading? Expand your understanding by reading our insightful article “Beyond the Numbers: Understanding the Impact of Trading Psychology.” Uncover the hidden psychological aspects that shape market dynamics. Explore it here.
Sign Up Now