


See economic calendars more clearly in real time.
Compare plans to access deeper market visibility for economic calendars.
Education
October 5, 2026
Updated
Using Economic Calendars for Trading: A Comprehensive Guide

Have you ever wondered how some traders prepare for market moves instead of reacting to them?
The answer is often the economic calendar. Don’t let the jargon scare you away; think of it as a schedule of when markets are most likely to move.
In this article, we’re diving deep into the world of economic calendars,
breaking down the complex stuff into bite-sized pieces. We will also explain how economic events move markets and how you can use them to plan your trades. Let’s get started.
Table of Contents
- Understanding Economic Calendars
- Analyzing Economic Events for Trading Opportunities
- Economic News Trading Strategies
- Trading Macroeconomic Announcements
- Fundamental Analysis Day Trading
- Trading US Non-Farm Payrolls Volatility
- Integrating Economic Calendars into Your Trading Strategy
- How to Handle Slippage During High-Impact News Events
- How to Set a Stop Loss Before a CPI Announcement
- Straddle Strategy for Economic Data Releases
- Pre-News Positioning vs. Post-Release Momentum Strategies
- Manual Execution vs. Automated Algorithmic Strategies
- Conclusion
- FAQs
Understanding Economic Calendars
Economic calendars serve as indispensable tools for investors, traders, and
analysts. They provide a comprehensive overview of scheduled economic events
and releases.
Economic calendars focus on scheduled central bank meetings and data releases. Many also list scheduled political and commodity meetings, such as G7 summits or OPEC+ meetings, but no calendar can list surprises such as conflicts, sanctions or unscheduled announcements. A thorough analysis of these indicators enables traders to gain
insights into the state of the global economy. Let’s explore this in more
detail.
What is an Economic Calendar?
An economic calendar is a chronological compilation of upcoming:
-
Events
-
Announcements, and
-
Data releases
These calendars encompass a wide array of information, including but not
limited to economic indicators, central bank meetings, government reports,
and corporate earnings releases.
Key Inclusions
Economic calendars include certain crucial aspects, which are:
-
Time zones:
-
Economic calendars include time zones.
-
This inclusion enables the investors to anticipate and react to
economic developments promptly, irrespective of their
geographical location.
-
-
Significant indicators:
-
Economic calendars feature several significant indicators.
-
These indicators range from employment reports and inflation
data to manufacturing indices and GDP releases. -
Investors use these indicators to:
-
Gauge the health of economies and
-
Make informed decisions regarding their portfolios.
-
-
Economic Events vs. Geopolitical Events
It’s important to distinguish economic events from geopolitical events.
Geopolitical developments such as conflicts, sanctions or surprise policy announcements can move markets at any time and usually cannot be scheduled. Economic calendars focus on events with a published date and time, such as central bank decisions and data releases. This emphasis on pre-planned events allows investors to:
-
Anticipate market movements based on data and forecasts
-
Prepare their trading strategies accordingly
Key Features of Economic Calendars
Economic calendars have several features that help traders and investors prepare for scheduled events. Let’s go through them in turn.
A) Time Zones
-
With economic events unfolding across different regions and time
zones, economic calendars play a pivotal role in ensuring timely
responses. -
A well-designed economic calendar will display events in their
respective local times, helping users grasp the chronological
sequence of events worldwide. -
This feature is particularly valuable for global traders who need to
align their strategies with market-moving announcements.
B) Event Descriptions:
-
Each event listed in the economic calendar comes with a detailed
description outlining its:-
Nature and
-
Potential impact
-
-
Traders must comprehend these descriptions to assess the
significance of an event. -
Whether it’s a central bank meeting, employment report, or GDP
release, understanding the context and implications of each event is
essential for informed decision-making.
C) Country-Specific Information:
-
Economic calendars provide a breakdown of events by country that
lets users filter events by specific regions of interest. -
This feature is especially beneficial for traders who specialize in
particular markets. -
For instance, a forex trader may customize their calendar to
highlight events in the currencies they are actively trading.
D) Scheduled vs. Unscheduled Events:
-
Some economic indicators follow predictable cycles, such as regular
interest rate decisions or quarterly earnings reports. -
The Consumer Price Index (CPI) is scheduled too: the Bureau of Labor Statistics publishes its release dates in advance, usually at 8:30 a.m. Eastern. What cannot be scheduled are surprises, such as an emergency rate move or an unscheduled central bank statement.
-
Knowing which events are scheduled aids traders in:
-
Anticipating market movements and
-
Adapting trading strategies accordingly.
-
How to Customize and Interpret Economic Calendars?
To gain maximum advantage, traders can customize the economic calendars as
per their specific needs. Read the table below for some effective
customization options:
|
Customization Techniques |
Explanation |
Benefits |
|
Filtering by Country and Impact Level |
Traders can customize economic calendars by filtering |
This targeted approach allows users to focus on the |
|
Setting Personalized Alerts |
Utilize alert features offered by economic calendars to |
This ensures that traders do not miss critical |
|
Historical Data Analysis |
Explore historical data available on economic calendars |
This analysis provides valuable insights into potential |
Major Economic Indicators and Their Impact
Understanding major economic indicators is crucial as they serve as
barometers of economic health and can significantly influence market
movements. Read the table below to understand the breakdown of key economic
indicators and their typical impact on different market sectors:
|
Economic Indicators |
Explanation |
Market Impact |
|
Interest Rate Decisions |
Central banks, such as the U.S. Federal Reserve or the |
|
|
Unemployment Figures |
Unemployment rates reflect the health of the job market |
|
|
Consumer Price Index (CPI) |
CPI measures the average change in prices paid by |
|
|
Gross Domestic Product (GDP) |
GDP represents the total value of goods and services |
|
Analyzing Economic Events for Trading Opportunities

Economic events play a pivotal role in:
-
Shaping market dynamics
-
Understanding market trends, and
-
Spotting profitable market opportunities
Now, let’s learn how to interpret economic events.
Interpreting Economic Events
Analyzing economic events involves more than just understanding the numbers.
It requires insight into how these events can influence
market sentiment
. Let’s learn through an example.
The Event
-
On September 16, 2026, the Federal Reserve raised interest rates for the first time since July 2023.
-
The FOMC voted 12-0 to raise the target range for the federal funds rate by 25 basis points, to 3.75% to 4.00%. The FOMC statement was released at 2:00 p.m. Eastern and was followed by a press conference.
The Interpretation
Traders who anticipated this move took the following steps:
-
Pre-Event Analysis:
-
Before the announcement, traders assessed the economic landscape
by considering factors like:-
Inflation
-
Employment data, and
-
GDP growth.
-
-
A comprehensive understanding of these factors provided them
clues about the likelihood of a rate hike.
-
-
Volatility Expectations:
-
Knowing that interest rate decisions often lead to market
volatility, traders accommodated for potential price swings by:-
Adjusting their positions or
-
Employing risk management strategies
-
-
-
Post-Event Analysis:
-
Following the announcement, traders performed a quick analysis
of market reactions. -
The traders found that:
-
The decision itself was widely expected, so the new information came mainly from the statement, the updated projections and the press conference.
-
The median projection showed the federal funds rate at 4.1% at the end of 2026, which is consistent with another quarter-point increase, and kept attention on the next meeting on October 27 and 28.
-
-
The Benefits
Traders who were prepared for these scenarios:
-
Capitalized on the volatility or
-
Protected their positions.
Economic News and Market Trends
Understanding how
economic news correlates with market trends is a key element of
successful trading. Historical data often highlights patterns where certain
economic indicators consistently impact specific markets. Traders can use
economic calendars to anticipate the following:
|
Identify Trends |
Anticipate Market Movements |
|
By analyzing historical data traders can identify trends
|
By utilizing economic calendars, traders can anticipate
|
|
For instance, strong employment figures may historically |
For instance, if a trader observes a pattern where |
Note: Anticipating market movements based on economic news doesn’t guarantee
success. Therefore, incorporating
effective risk management strategies
is essential. This includes:
-
Setting stop-loss orders and
-
Diversifying portfolios to mitigate potential losses.
Additionally, traders can use advanced market analysis tools like Bookmap
that provide a visually rich environment for traders to analyze market data
and make informed decisions. It offers features such as heatmap
visualization, which allows traders to see market dynamics and depth in a
way that was not possible before.
Practical Application in Trading
Developing a trading strategy around economic calendar analysis involves a
systematic approach that integrates careful planning, risk management, and a
keen understanding of market reactions to specific events. Let’s delve
deeper.
How to Develop a Trading Strategy?
Read the table below for a step-by-step guide:
|
Steps |
Explanation |
|
Identify High-Impact Events |
|
|
Set Up Alerts |
|
|
Analyze Historical Market Reactions |
|
|
Evaluate Market Expectations |
|
|
Plan Trades Based on Expected Outcomes |
Develop a trading plan that aligns with your
|
|
Implement Risk Management |
|
How to Achieve a Balance Between Risk and Potential Reward?
Trading based on economic news involves a delicate balance between risk and
potential reward. You can create a perfect one by considering the following:
-
Evaluate the potential impact of the economic event on the market.
-
Assess the historical volatility associated with similar events to
gauge potential risks. -
Determine the appropriate size of your positions based on the level
of risk you are comfortable with. -
Avoid over-leveraging, as unexpected market movements can lead to
significant losses. -
Spread your investments across different assets or markets to
diversify risk. -
Be prepared to adapt your strategy based on real-time market
developments.
Economic News Trading Strategies
Scheduled releases concentrate volatility into a few minutes, and traders have developed several ways to approach them. They fall into five families:
| Strategy | The idea | Works best when | Main risk |
| Fading the spike | The first move overshoots and price returns | Liquidity is thin and the surprise is small | A real surprise keeps going |
| Breakout or momentum | Trade the direction of the first move that holds | The surprise changes expectations | Whipsaws and slippage |
| Straddle | Buy both directions with options | The actual move exceeds what options priced in | Premium loss and falling implied volatility |
| Pre-positioning | Take a position before the release | You have a view on the surprise | A gap against you, with no way out |
| Post-release drift | Trade continuation after the first reaction | The release resets the trend | Evidence is mixed |
No strategy has an edge by default. Each depends on the instrument, the release and the market’s regime, so test it on past releases before using money. The sections below cover each in turn, and Bookmap’s guides to how to trade the news and economic events and order flow add more background.
Trading Macroeconomic Announcements
A macroeconomic announcement, such as a jobs report, an inflation print or a central bank decision, unfolds in phases:
- Before the release. Traders position or step aside, and liquidity providers often reduce resting size, which makes the book thinner.
- The release. In the first seconds, algorithms read the number and trade it. Spreads widen and prices can jump several price levels at once.
- The first minutes. Spreads begin to normalize, the first move is tested, and it often reverses or extends.
- After. Prices digest the news. Direction here depends on how far the number surprised.
The time of day matters. In the US, most major data lands at 8:30 a.m. Eastern, an hour before the stock market opens, so the first reaction happens in futures and forex, which trade nearly around the clock.
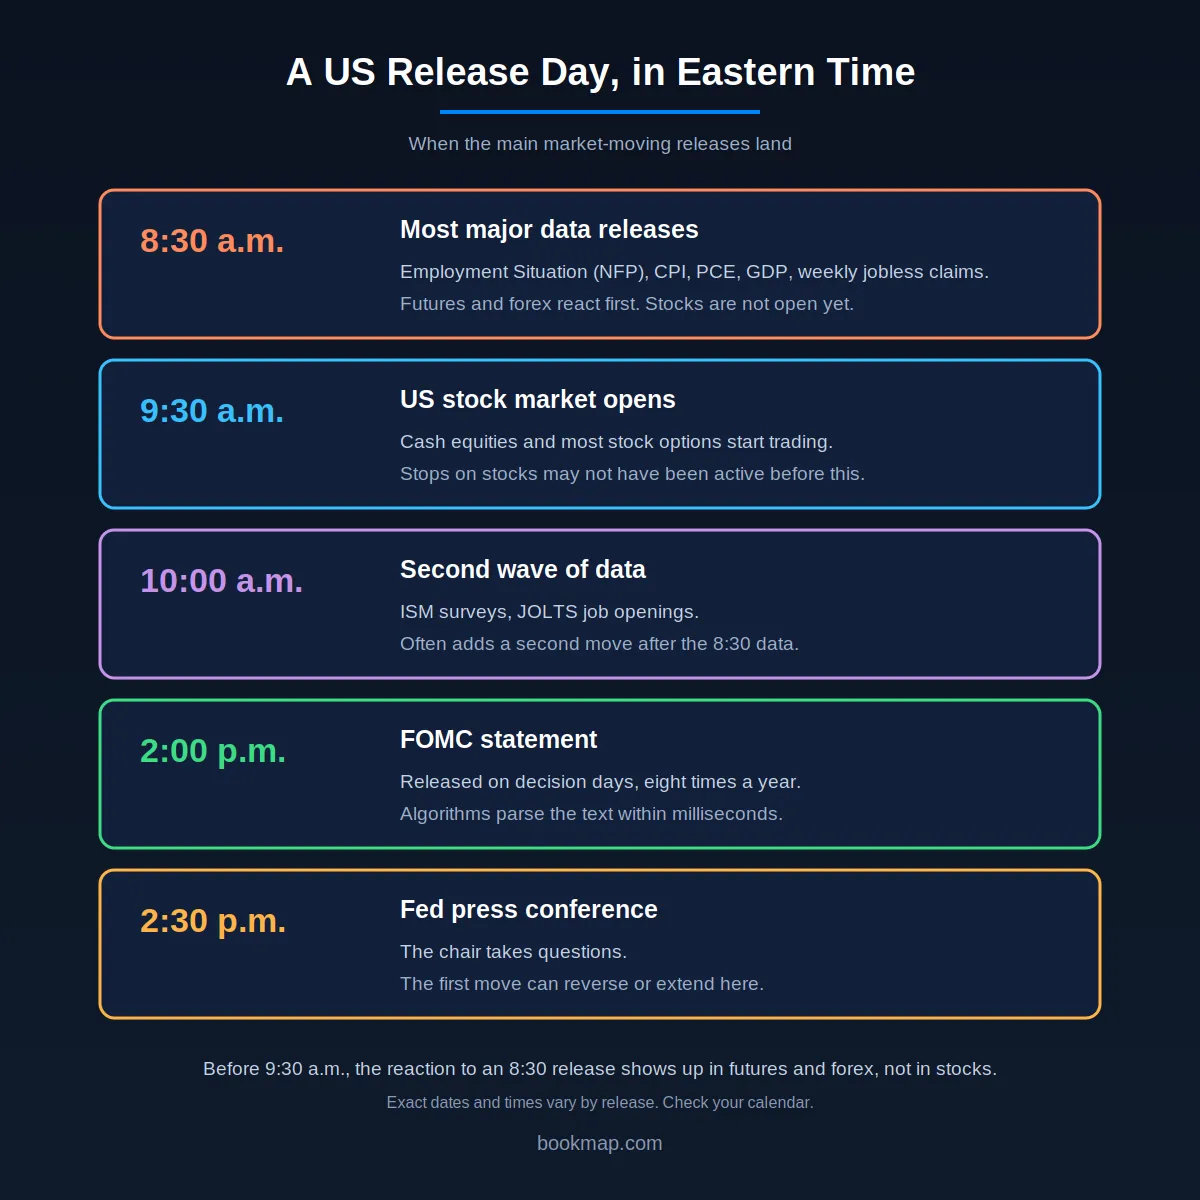
Economic Calendar Event Trading
Trading from an economic calendar works best as a routine:
- Map the week. Filter the calendar by country and impact, and mark the events that move your instrument.
- Note the consensus and the prior reading. The market has already priced the consensus, so the surprise is what matters.
- Check what else is scheduled. Central bank speeches, Treasury auctions and earnings can land close to the release.
- Decide in advance. Will you trade, at what size, and with what stop? Or will you stand aside?
- Define what proves you wrong. Write down the price level that cancels the idea.
- Log the outcome. A trading journal turns each release into data for the next one.
Timing matters here. The September 2026 CPI, for example, is scheduled for Wednesday, October 14, 2026 at 8:30 a.m. Eastern, and the next jobs report is due Friday, November 6. For the planning side, Bookmap’s guide to creating a trading plan covers the rest.
Macro News Breakout Trading
Macro news breakout trading waits for price to leave the range it formed before the release, instead of guessing the direction. A typical rule set, which you should test before using:
- Mark the pre-release range. Use the high and low of the 15 to 30 minutes before the release.
- Let the first spike settle. Do not trade the first seconds, when spreads are widest.
- Enter on a break that holds. Look for price to leave the range and stay outside, with volume or aggressive orders behind it.
- Put the stop back inside the range. If price returns to the range, the breakout has failed.
- Set a target in multiples of the range. For example, one to two times its height.
The main risk is a false breakout. Releases often produce a quick move one way, then a reversal, and a breakout trader who enters on the first move pays the spread and slippage twice. Order flow can help filter these. On a heatmap, a real breakout tends to show resting orders being consumed and not replaced, while a failed one shows price running into large resting size. See Bookmap’s guides to the heatmap and order book depth.
Trading on Economic Data Releases
Prices react to the surprise, the gap between the actual number and the consensus. A strong number that was expected can do little, and a modest miss can move a market a lot. Beyond the headline, traders read the details:
| Release | What to read first | Why |
| Employment Situation (NFP) | Headline payrolls versus consensus, revisions to prior months, the unemployment rate, average hourly earnings | Revisions and wages can outweigh the headline |
| CPI | Core versus headline, month-over-month and year-over-year, services and shelter | Core inflation guides policy more than energy and food |
| FOMC decision | Changes in the statement wording, the projections (quarterly), the press conference | The path of rates matters more than the decision itself |
Compare each release with its consensus and its prior reading, and remember that revisions can change the story after the fact. For example, the September 2026 jobs report showed payrolls up 29,000, which the Bureau of Labor Statistics described as little changed, and traders judged that against expectations and the trend, not on its own.
What Are the Best Economic Indicators to Day Trade?
There is no universal best indicator. The best one for you is the one that regularly moves your instrument and gives a clear surprise. As a rule of thumb, the market-wide movers are the Federal Reserve’s rate decisions, the jobs report and CPI. A second tier includes PCE inflation, weekly jobless claims, GDP, ISM surveys and JOLTS. Some are specific to one market, such as the weekly EIA crude oil inventories for oil traders.
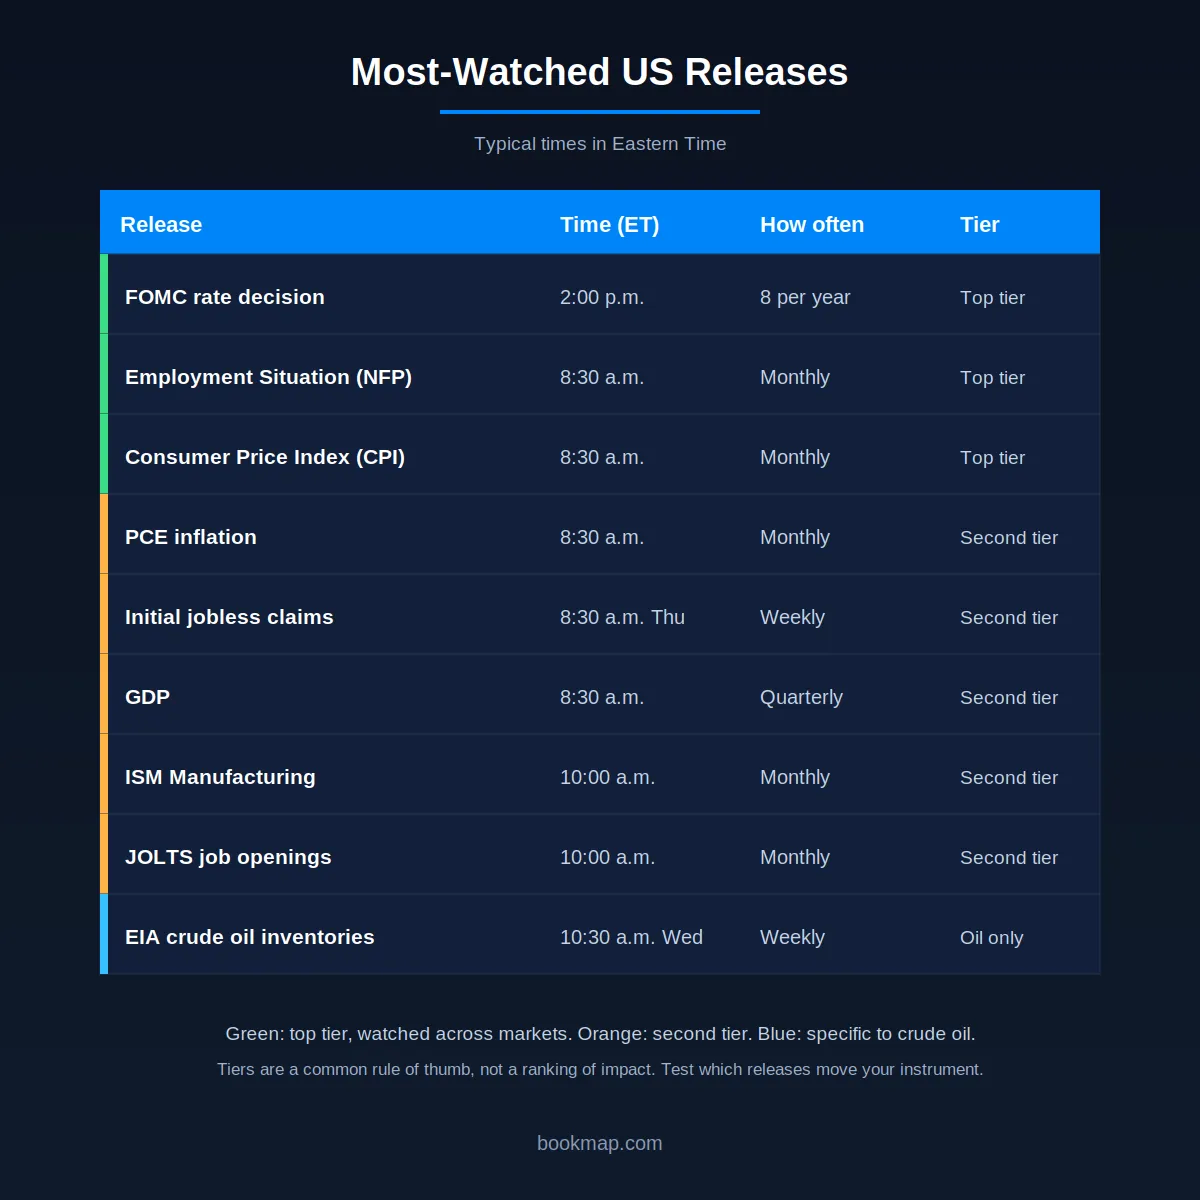
To choose, use the calendar’s historical data to compare how your instrument moved around each release over the past year, and keep the releases that produced moves worth the risk. See Bookmap’s guide to day trading futures for more on picking instruments.
Fundamental Analysis Day Trading
Day traders rarely value companies, but they do use fundamental information. It answers what and whether to trade, while price action and order flow answer where. In practice, fundamentals act as a filter on the day:
| Fundamental input | What it tells a day trader | How it is used |
| The economic calendar | When volatility is likely | Size down or stand aside around releases |
| Consensus versus actual | The direction and size of the surprise | Directional bias for the first hour |
| Yields and the dollar | Risk appetite | Bias for index futures and forex |
| Earnings and guidance | Single-stock gaps and volume | Which stocks to watch at the open |
| Central bank tone | The path of rates | Whether good news is read as good or bad |
A short morning routine is enough: check the calendar, check what moved overnight, note the key levels, and decide which releases you will trade. For the institutional view of how large participants trade around events, see Bookmap’s guide to how to read the market like an institutional trader.
Event-Driven Market Strategies
Event-driven strategies trade a known catalyst, not a chart pattern. The catalysts fall into three groups:
- Scheduled data and policy events. CPI, jobs reports, central bank decisions.
- Corporate events. Earnings, guidance and index changes.
- Structural events. Option expirations and index rebalances, which move volume without news. For example, the quarterly expiry covered in Bookmap’s guide to triple witching, and the daily expiries in 0DTE options.
Unscheduled events, such as geopolitical shocks, produce the same volatility without a warning, so event-driven traders keep risk limits in place for them, too.
Macroeconomic Market Volatility
Macro news changes volatility in a predictable shape. Implied volatility, the volatility priced into options, usually rises into a known event and falls once it has passed. Realized volatility spikes at the release itself and then decays. Two measures help:
- The implied move. The price of an at-the-money straddle on the nearest expiry approximates the move the market expects.
- The realized move. How far price actually moved around the release.
If realized moves are regularly larger than implied ones for an instrument, options buyers have an edge there. If they are smaller, sellers do. In either case, remember that regimes change. With inflation running high and the Fed raising rates in 2026, CPI and Fed decisions are likely to matter more than in years when inflation was quiet. For how to trade through that, see Bookmap’s guide to trading in volatile times.
Trading US Non-Farm Payrolls Volatility
The Employment Situation report, known as non-farm payrolls (NFP), is released at 8:30 a.m. Eastern, usually on the first Friday of the month. It includes headline job gains, the unemployment rate, average hourly earnings and revisions to prior months. It matters because it shapes the market’s view of the labor market and, through it, of Fed policy. The September 2026 report came out on October 2, and the next is due on Friday, November 6, 2026.
NFP produces some of the larger scheduled moves in index futures and forex. A practical structure:
- Before: mark the previous day’s range and key levels, reduce size, and decide in advance whether you will trade the first minutes or wait.
- At the release: do not chase the first tick. Spreads are widest and the first move often reverses.
- After: wait for spreads to settle, then trade a confirmed break or a clean retest, with a stop sized for the new volatility.
The three sections below cover the other releases that behave in the same way: central bank rate decisions, forex spreads and inflation prints.
Algorithmic Reaction to Central Bank Rate Decisions
A Federal Reserve decision arrives in two parts. The statement comes out at 2:00 p.m. Eastern, and the press conference follows at about 2:30. Algorithms read machine-readable feeds and trade the statement within milliseconds, so the first move is usually theirs. Humans cannot compete at that speed, which is why the sensible plan for most traders is to wait.
A common pattern is an initial spike at 2:00, a partial retracement as the market digests the wording, and a second move once the chair speaks. The press conference can reverse or extend the first reaction, because the chair’s comments on future policy can matter as much as the decision. On September 16, 2026, the 25 basis point hike was widely anticipated, so the statement wording, the projections and the press conference carried most of the new information.
Other central banks follow similar rules. The European Central Bank, for example, publishes its decision at 2:15 p.m. Central European Time and holds a press conference at 2:45. On a heatmap, this often shows up as resting orders disappearing around the release and returning afterward. See Bookmap’s guide to what has changed in market microstructure for more on algorithmic trading.
Forex Spread Widening During Economic Data Releases
Forex spreads widen around major releases because liquidity providers widen their quotes when risk rises. Illustratively, a major pair might trade at 0.2 pips normally and 3 pips or more in the seconds around NFP.
This matters in three ways:
- Cost. Every market order pays the wider spread.
- Stops. A buy stop triggers on the ask and a sell stop on the bid, so a widening spread can trigger a stop even when the mid price barely moves.
- Slippage. Quotes move quickly, and fills can come at prices well away from the one you saw.
To reduce the effect, avoid tight stops at the release, use limit orders for entries, wait for spreads to normalize, and look at your broker’s execution statistics. Bookmap’s guide to what a spread is covers the basics, and the section on slippage later in this guide covers the costs.
Post-Release Drift Strategy on Inflation Prints
A post-release drift strategy trades the idea that price keeps moving in the direction of the surprise for minutes or hours after the first reaction. A simple version:
- Classify the print: core CPI above, in line with or below the consensus.
- Wait 15 to 30 minutes for the first spike and spreads to settle.
- Trade in the direction of the surprise only if price holds beyond the post-release range, with volume behind it.
- Exit if price returns inside that range.
The evidence for drift is mixed. A well-known study by Lucca and Moench found that the S&P 500 rose an average of 49 basis points in the 24 hours before scheduled FOMC announcements, but a later study found the effect essentially disappeared after 2015. Some research finds that stocks keep moving in the direction of monetary policy surprises for days, but evidence for inflation prints specifically is thinner. Treat drift as a hypothesis to test on your own instrument, not a rule.
Integrating Economic Calendars into Your Trading Strategy
Economic calendars help traders capitalize on market movements influenced by
economic events. You can integrate these calendars into your trading
strategy by creating a personalized plan and implementing effective risk
management strategies.
Creating a Personalized Trading Plan
Developing a personalized trading plan is essential for aligning your strategy with your trading style and risk
profile. Consider the following strategies based on different risk
preferences:
|
For Risk-Averse Traders |
For High-Risk Traders |
|
Focus on Low-Volatility Events Target events with historically lower volatility to |
Seek High-Impact Events Look for events with the potential for substantial |
|
Conservative Position Sizing Use smaller position sizes to reduce exposure and |
Higher-Risk Tactics Larger positions, leverage and shorter holding periods raise the risk of large losses, so size positions to match. |
|
Long-Term Perspective
|
Stay Informed and Adaptive
|
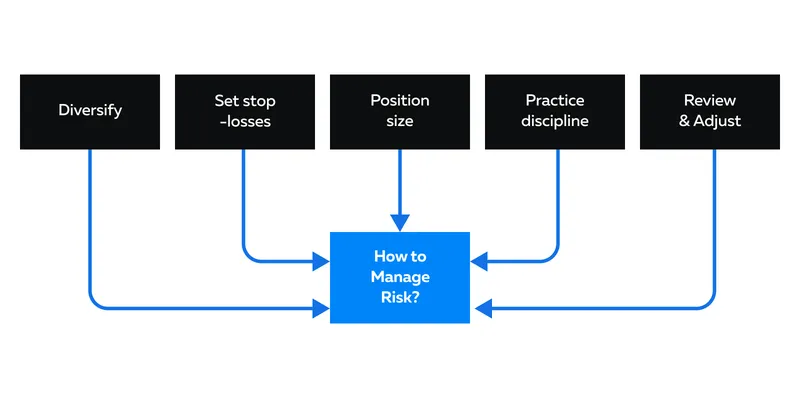
Risk Management Strategies
Effective risk management is paramount in mitigating potential losses and
preserving capital. Consider implementing the following risk management
strategies:
-
Diversification:
-
Spread your investments across different assets or markets to
reduce the concentration risk. -
Diversification helps cushion the impact of adverse events on
your overall portfolio.
-
-
Setting Appropriate Stop-Losses:
-
Establish clear stop-loss levels based on:
-
Your risk tolerance and
-
The volatility associated with the event.
-
-
This ensures that losses are controlled, and emotions don’t
override rational decision-making.
-
-
Position Sizing:
-
Determine the size of your positions based on:
-
Your risk tolerance and
-
The potential impact of the economic event
-
-
Avoid over-leveraging to prevent significant financial setbacks.
-
-
Psychological Discipline:
-
Acknowledge the psychological aspects of trading, especially
during high-impact events. -
Ensure you are adhering to your trading plan and not succumbing
to impulsive decisions driven by fear or greed.
-
-
Regularly Review and Adjust:
-
Periodically review and adjust your risk management strategies.
-
Try to stay adaptive. This ensures that your risk management
aligns with the evolving landscape.
-
How to Maintain Trading Discipline
Trading on economic news can evoke emotional responses, especially during
periods of heightened volatility. To maintain discipline:
-
Adhere to your trading plan, even if market movements trigger
emotional reactions -
Wait for optimal setups and don’t succumb to FOMO (Fear of Missing
Out) -
Stay informed and continuously educate yourself on market dynamics
How to Handle Slippage During High-Impact News Events
News events are where slippage is largest. Liquidity providers pull resting orders, spreads widen, and a wave of market orders arrives at once. A market order can fill several price levels away from the one you saw.
To handle it:
- Use marketable limit orders. Set a limit a few ticks beyond the best price, so the order fills like a market order but cannot go further.
- Use the exchange’s protection. On CME Globex, market orders are handled as market orders with protection, which cap the price range, though a full fill is not guaranteed.
- Reduce size. Smaller orders walk the book less.
- Wait for spreads to settle. The first seconds are the most expensive.
- Budget for it. Assume slippage in your sizing. For example, 2 ticks of slippage on an ES stop is $25 a contract on top of the planned loss.
Bookmap’s guide to slippage covers the causes, calculation and order types in detail, and the guide to tick size explains how to convert ticks to dollars.
How to Set a Stop Loss Before a CPI Announcement
A stop placed tightly before a CPI release is likely to be hit by the first spike and filled at a poor price. Release time is the worst moment for a tight stop, so traders choose between several approaches:
| Approach | What it does | Trade-off |
| Stand aside | Close the position before the release | You miss the move |
| Smaller size, wider stop | Survive the spike with the same dollar risk | Less profit if you are right |
| Options with defined risk | Maximum loss is the premium, with no stop to gap through | Premiums are higher before events |
| Stop after the first spike | Define risk once spreads settle | You are exposed during the spike |
| Stop-limit order | Caps the fill price | May not fill at all |
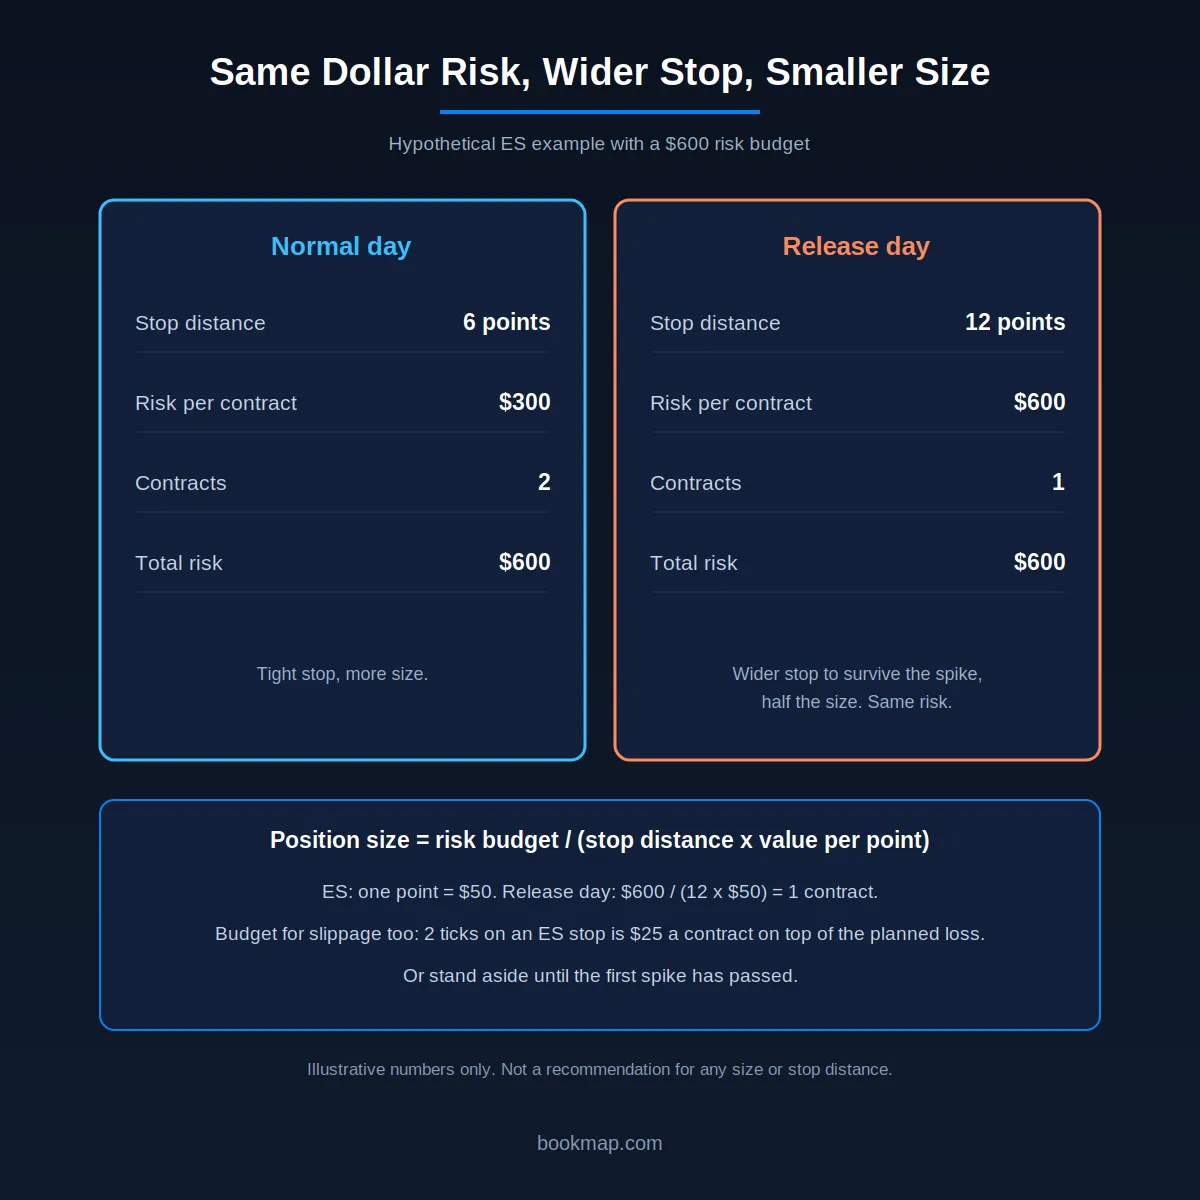
The size calculation is simple: position size equals your risk budget divided by the stop distance times the value per point. With a $600 risk budget in ES, a 6-point stop allows 2 contracts, and a 12-point stop allows 1.
Some details matter by market. On CME, stop orders are handled as stop with protection: once triggered, they become limit orders within a protection range, which caps the price but can leave the order unfilled. For stocks, CPI arrives at 8:30 a.m., before the 9:30 open, and many brokers only trigger stop orders on stocks during regular hours, so check whether your stop is active in the pre-market. For how stop clusters behave, see Bookmap’s guide to stops.
Straddle Strategy for Economic Data Releases
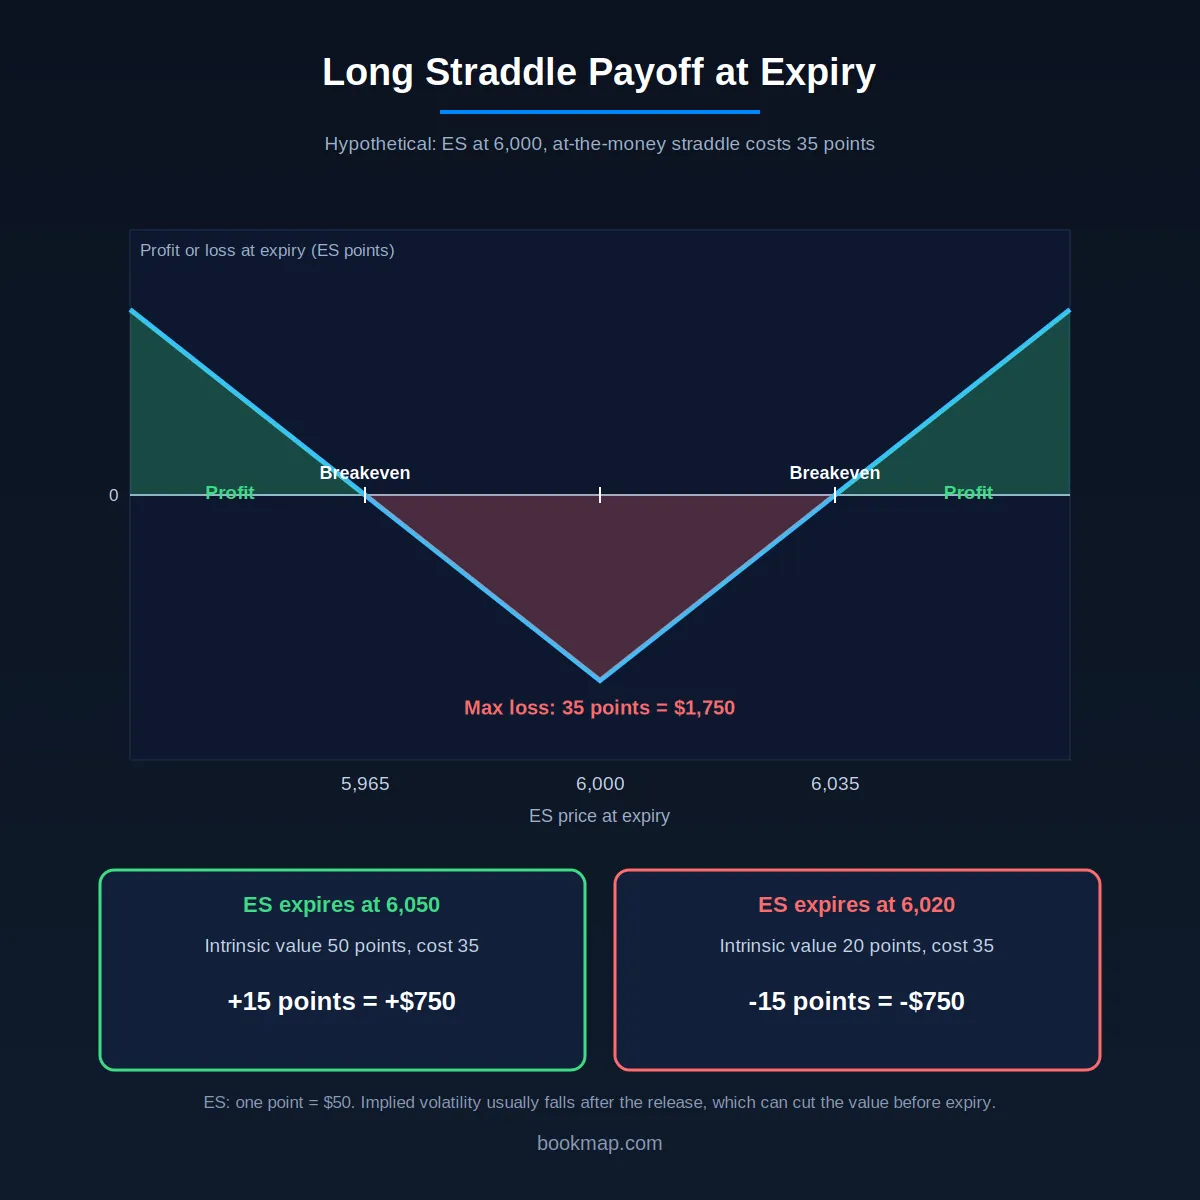
A long straddle buys a call and a put at the same strike and expiry. It profits if the underlying moves far enough in either direction and loses the premium if it does not. That makes it a way to trade the size of a move without picking a direction.
The numbers work like this. Suppose ES is at 6,000 and an at-the-money straddle on the nearest expiry costs 35 points, about 0.58%, or $1,750 per contract. The breakevens are 35 points above and below the strike, at 6,035 and 5,965. At expiry, a move to 6,050 gives a profit of 15 points, or $750. A move to 6,020 gives a loss of 15 points, or $750. The most you can lose is the premium.
Four points decide whether it works:
- The premium already contains the expected move. You profit only if the actual move exceeds what options priced in.
- Implied volatility usually falls after the release. The option can lose value even when price moves in your favor, which is called a volatility crush.
- Time decay is steep. Short-dated options lose value quickly, so the move has to come soon.
- Options spreads widen around events. Your cost to enter and exit is higher than it looks.
Timing is a practical issue. A release at 8:30 a.m. lands before the stock market opens, so a straddle on a stock index ETF may only be adjustable after 9:30, while futures options trade nearly around the clock. For short-dated index options, see Bookmap’s guide to 0DTE options. Selling a straddle is the opposite trade and carries much larger risk, as losses can be far greater than the premium collected.
Pre-News Positioning vs. Post-Release Momentum Strategies
The two approaches differ in when you take the risk:
| Pre-news positioning | Post-release momentum | |
| When you trade | Before the release | After the first reaction |
| What you need | A view on the surprise | A read on whether the move holds |
| Main risk | A gap against you with no exit | Paying wider spreads and missing the first move |
| Fits | Traders who accept binary risk | Traders who prefer confirmation |
| Evidence | The pre-FOMC drift found by Lucca and Moench faded after 2015 | Mixed, and instrument-specific |
If you cannot accept a position gapping against you, post-release momentum is the safer fit. It costs you the first move, but it replaces a guess with information. Pre-positioning needs a reason to expect a surprise, and the consensus already prices the obvious ones.
Forex, Futures or Equities: How the Asset Class Changes the Trade
The same release plays out differently by market:
| Market | When the reaction happens | Main release-day risk | What to watch |
| Forex | Nearly 24 hours, immediately at the release | Spread widening and stop triggers | Broker spreads and execution |
| Futures (such as ES and NQ) | Immediately at 8:30 a.m. for US data | Slippage and thin books | Order book depth and protection settings |
| Equities | At the 9:30 a.m. open, after the release | Pre-market thinness and gaps at the open | Whether stops are active before the open |
For how liquidity differs across them, see Bookmap’s guides to evaluating stock liquidity and reading the tape on low liquidity days. For crypto, which trades around the clock, see liquidation cascades in crypto.
Manual Execution vs. Automated Algorithmic Strategies
Both work, and each has costs.
Manual execution gives you judgment. You can pass on a release that looks unclear and read context an algorithm cannot. The costs are speed and emotion: a human reaction takes far longer than the first move, and releases produce fear and FOMO that undermine plans. Manual traders do better by trading after the first reaction and by setting rules in advance.
Automated strategies give you speed and consistency. A rule is applied the same way every time. The costs are data and latency requirements, the risk of a malfunction on a day when markets are fast, and a statistical problem: there are only 8 FOMC decisions and 12 CPI and NFP releases a year, so a backtest has few data points, and a strategy tuned to them can be overfit. Reliable data feeds matter as well. See Bookmap’s guide to real-time market data feeds. Bookmap also offers an API for building add-ons.
Many traders use a middle path: semi-automated tools such as pre-set bracket orders, with manual judgment on whether to take part. Whichever you choose, keep position size small until you have a record of how the strategy behaves around releases, and review the results regularly. Bookmap’s guide to risk management covers the basics.
Conclusion
For many traders, the economic calendar is a basic part of daily preparation. Knowing when the market is likely to move makes it easier to plan entries, stops and position size.
Economic calendars offer a roadmap of scheduled events and potential market
movements. By creating a personalized trading plan that aligns with your risk tolerance and trading style, you can approach scheduled events with a plan. It does not remove risk, but it makes the risk easier to manage.
Trading around scheduled events carries high risk, and managing it comes down to position sizing, clear stop-loss levels and, where relevant, diversification.
Are you ready to dive deeper into how economic events can impact your
trading strategies? Explore our comprehensive guide, ‘Economic Events and
Order Flow: A Trader’s Guide to Navigating Market Fluctuations’ for more
advanced insights and strategies.
Read it Here.
FAQs
What is an economic calendar?
An economic calendar is a list of scheduled economic events, such as data releases and central bank decisions, with their dates, times, forecasts and previous readings.
Is the CPI release date fixed?
CPI is scheduled. The Bureau of Labor Statistics publishes its release dates in advance, usually at 8:30 a.m. Eastern. The September 2026 CPI is due Wednesday, October 14, 2026.
What are the best economic indicators to day trade?
The ones that regularly move your instrument. The market-wide movers are Federal Reserve decisions, the jobs report and CPI. Others, such as PCE, GDP, ISM surveys and jobless claims, matter for specific markets.
How do I trade economic news?
Plan around the surprise, the gap between the actual number and the consensus. Approaches include fading the spike, breakouts from the pre-release range, straddles and post-release drift. Test any of them on past releases first.
How do I handle slippage during high-impact news events?
Use marketable limit orders or the exchange’s protection, reduce size, wait for spreads to settle, and include slippage in your risk calculation.
How do I set a stop loss before a CPI announcement?
A tight stop is likely to be hit by the first spike. Options are standing aside, using a smaller size with a wider stop, using options with defined risk, or setting the stop after the first spike.
What is a straddle strategy for economic data releases?
A long straddle buys a call and a put at the same strike. It profits if the move exceeds the premium paid, and loses the premium if it does not. Implied volatility usually falls after the release.
Why do forex spreads widen during data releases?
Liquidity providers widen their quotes when risk rises. Wider spreads raise costs and can trigger stops even when the mid price barely moves.
Should I trade before or after the news?
Before means taking binary risk on a view of the surprise. After means paying wider spreads and missing the first move in exchange for more information. Traders who cannot accept a gap against them usually prefer after.
Should I use manual or automated strategies for news trading?
Manual gives you judgment and flexibility. Automated gives you speed and consistency, but backtests are thin, since there are only about a dozen CPI and jobs releases a year.
When is the next FOMC meeting?
The next meeting is October 27 and 28, 2026, with the decision at 2:00 p.m. Eastern on October 28.
Sign Up Now
Latest Articles