See market activity more clearly in real time.
Compare plans to access deeper market visibility for market activity.
Market Structure
January 29, 2026
Updated
SHARE
Stop Trading Like It’s 2010: What’s Changed in the Market Microstructure

- Speed and Automation: The Rise of Millisecond Markets
- Liquidity Fragmentation: Where Did the Market Go?
- The New Algos: How Modern Players Manipulate Price
- What This Means for You as a Trader
- Latest Updates on Order Flow Dynamics and Liquidity Metrics
- Market Microstructure Research and Infrastructure Trends
- Regulation, AI, and Future Market Structure
- Advanced Microstructure Concepts for Traders
- FAQ
Do you think trading is all about spotting “chart patterns” and hoping for the best? If so, both your methods and approach are outdated!
In 2025, modern markets are faster, smarter, and far more complex than they were a decade ago. Nowadays, liquidity hides in dark pools, and algorithms move in microseconds. The harsh truth? Traditional tools leave you blind to what is really influencing the price. Thus, you, as a trader, must understand how the market operates. It is just as important as having a strategy.
Struggling to keep up? In this article, you’ll understand several market microstructure changes, from fragmented liquidity and engineered stop-runs to advanced algorithmic tactics. Also, you’ll learn why speed, order flow, and hidden volume matter, and how classic indicators can mislead in today’s fast-paced environment.
Read this article till the end to gain real-time insight that reveals where genuine liquidity lies.
Speed and Automation: The Rise of Millisecond Markets
Do you think the stock market will still move at human speed in 2025? Nope! Trades are nowadays executed in microseconds to milliseconds, far faster than a person can react. Most of the liquidity you see on the screen isn’t from humans placing orders manually. Instead, it’s placed, adjusted, or pulled by machines.
But the Old Times Were Not Like This!
Yes, back in 2010, retail traders could still spot a breakout level or a chart pattern and react before prices moved too far. Not anymore. Modern algorithms anticipate those same levels and act first! Based on their anticipation, they might:
- Fade the move (going against the expected direction)
or
- Clear out stop orders to shake out weak hands.
All of this can happen even before most human traders even click their mouse!
In 2025, Algorithms Dominate the Modern Markets
Studies show that in the U.S. stock market, over 70% of trading volume comes from algorithmic trading. That’s a huge chunk! And if you think this is only true for stocks, think again. The Futures markets also see heavy algo activity. And it’s not just high-frequency market makers. You also have to deal with these market players:
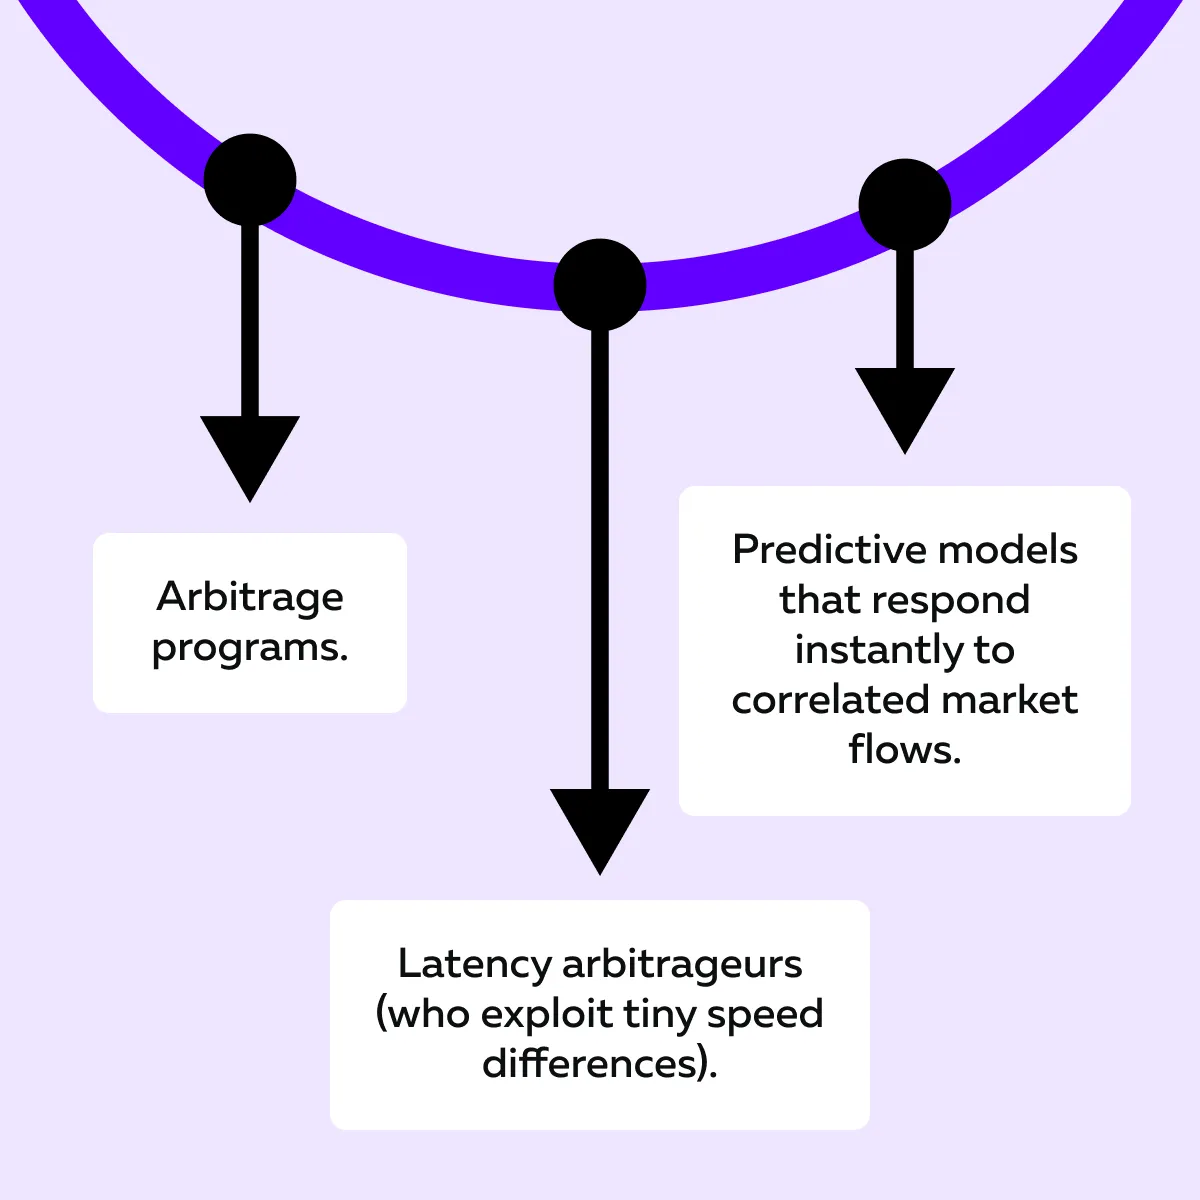
So, the power lies with them! They reflect major market microstructure changes. In 2025, it is automation and speed that define who gets the advantage.
How Has Trade Execution Changed in Modern Times?
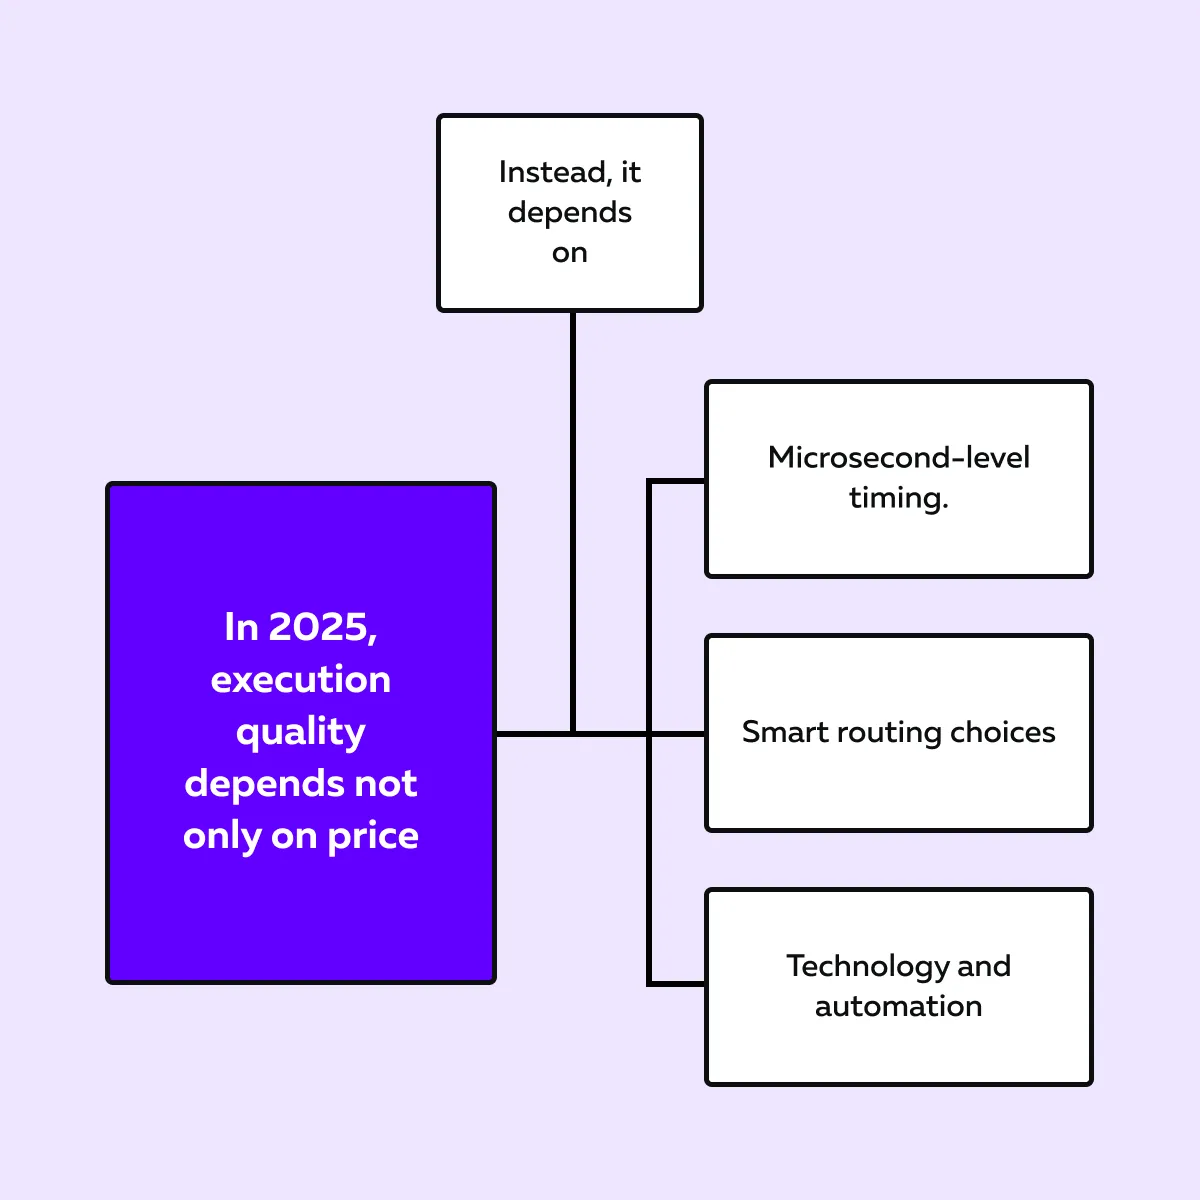
It’s not only about getting the “best price” anymore. Speed and strategy play just an equally important role. The outcome would change depending on the way an order is routed, meaning where it’s sent, how it’s hidden, and when it’s placed. That’s why smart order routing and hidden orders have now become standard tools in the modern trading world.
But Does This Matter for Small Traders Like Me?
Yes! If your order is slow or not routed smartly, you might experience slippage. You may get filled at a slightly worse price than expected. But why? This happens because the liquidity provider or algorithm on the other side had an edge in speed.
So, remember that:
Want to understand modern order flow? Watch it unfold in real time with Bookmap.
Liquidity Fragmentation: Where Did the Market Go?
Want to know about one of the biggest market microstructure changes? It is how liquidity has become scattered and often hidden. Let’s understand this in detail:
Liquidity Is No Longer in One Place!
Back in 2010, most trading volume flowed through just a few major exchanges. If you glanced at the order book, you could get a 100% complete picture of where buyers and sellers stood. Today, things are different!
Liquidity is fragmented across dozens of venues, such as:
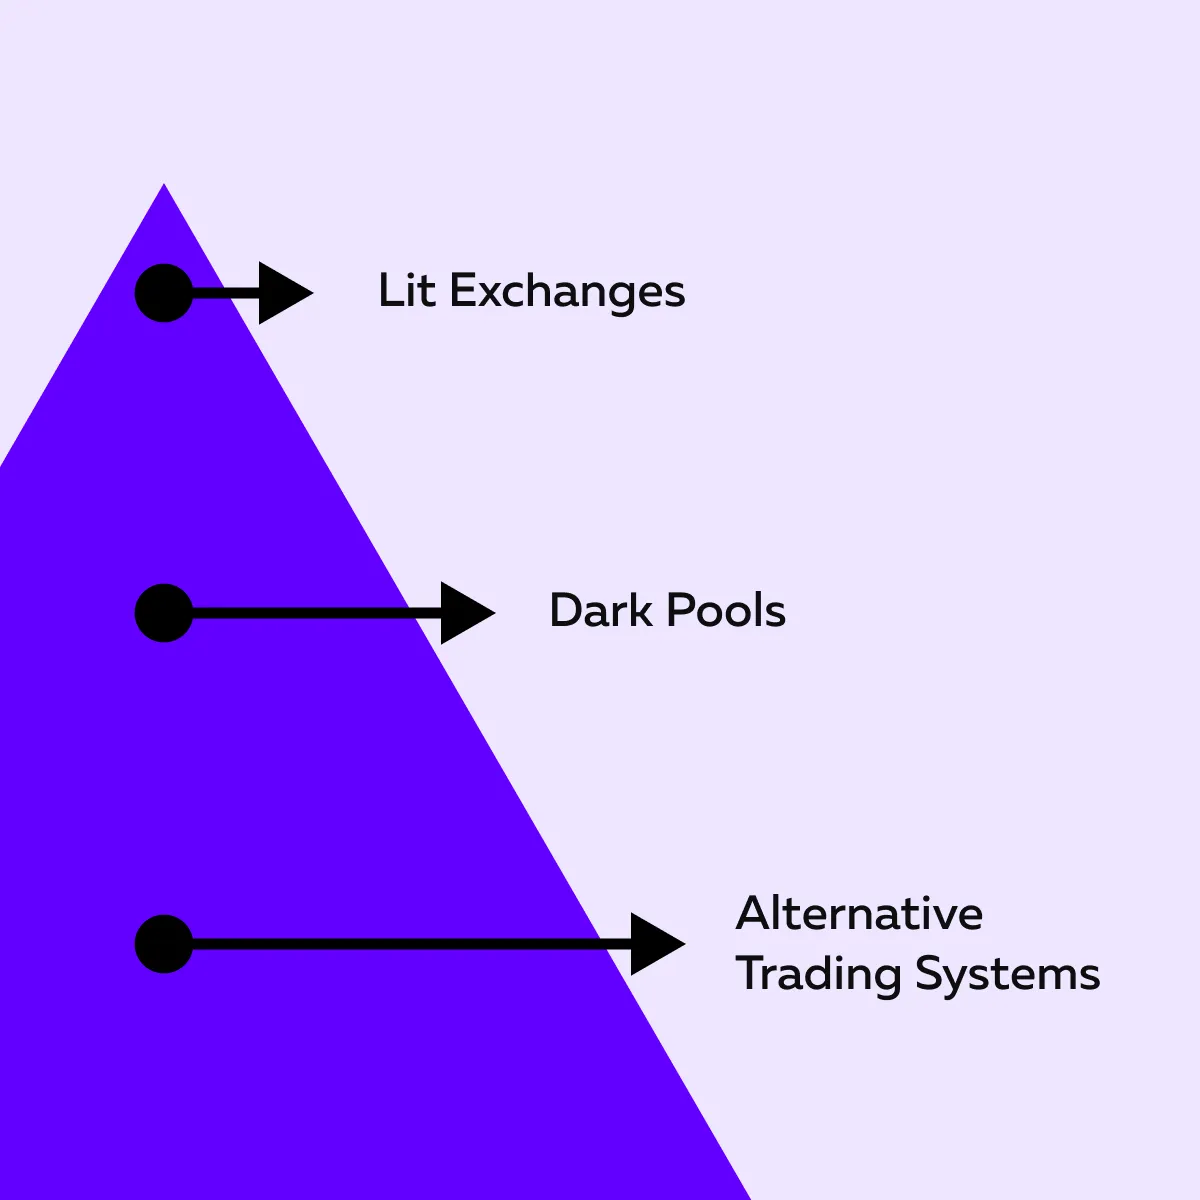
Due to such fragmentation, the “book” you see on your screen only reflects a slice of the actual market.
Displayed vs. Hidden Liquidity
What you see isn’t always what you get! A large part of liquidity today is hidden through techniques like:
- Iceberg orders (only a small part of the order shows),
- Midpoint peg orders, and
- Dark pool executions.
Because of this, charts and L2 (Level 2) quotes can be misleading. You might think there’s no interest at a certain price level. However, in reality, there could be a hidden size waiting! Even worse, some orders you see might be “bait,” placed to mislead rather than trade.
Any Solution? You Need Advanced Tools That Reveal the Real Flow!
Okay, so how do you succeed in this environment? Most successful traders use market analysis tools, like Bookmap. Let’s see how it helps them:
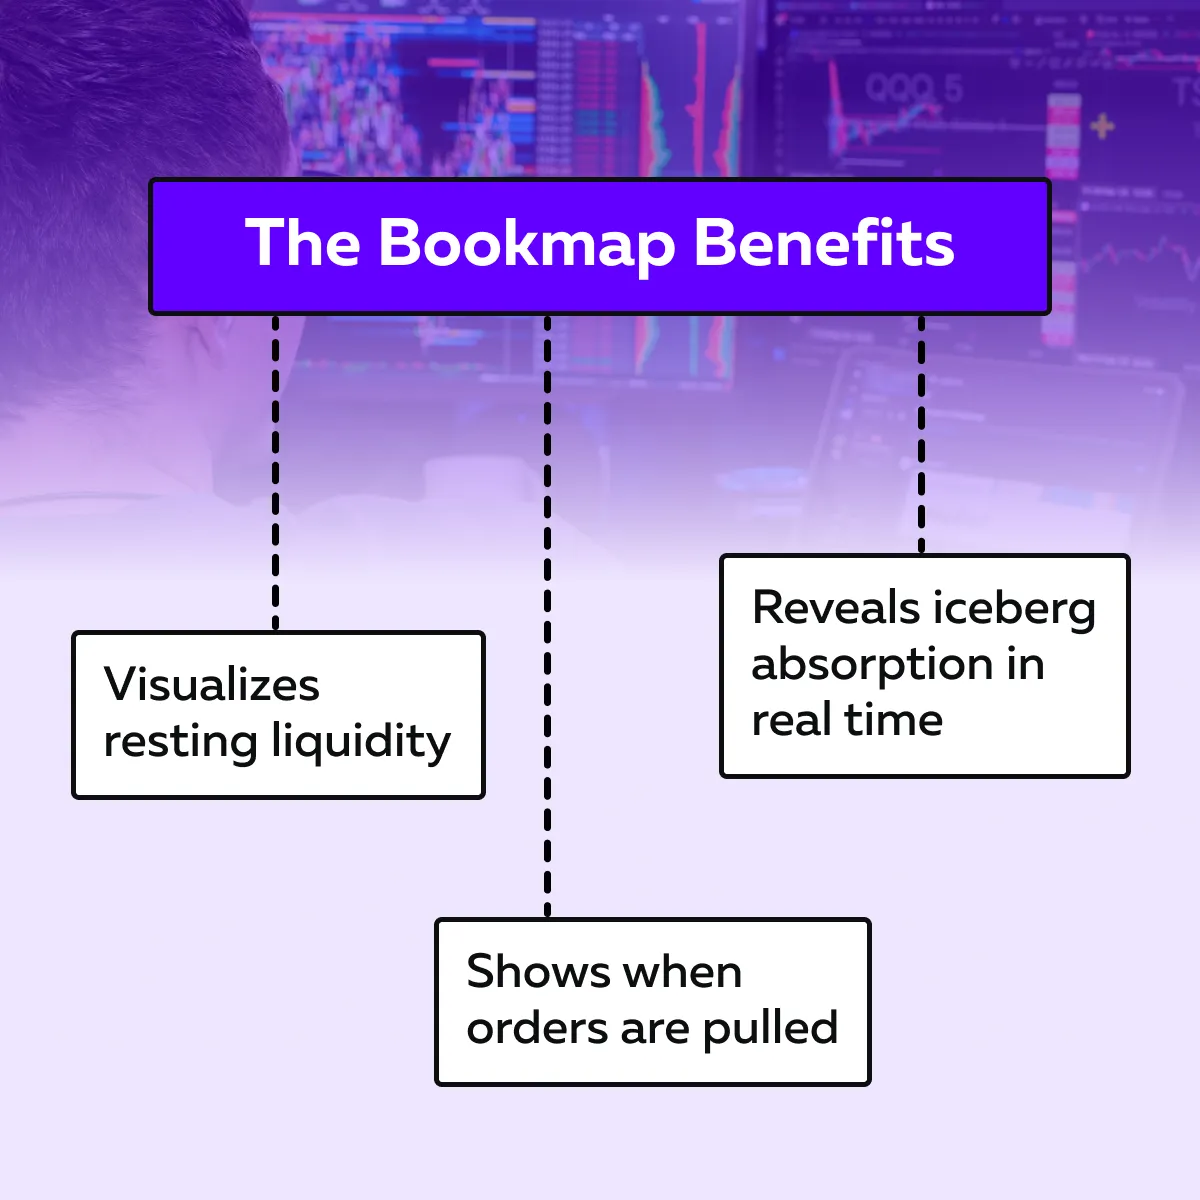
The trader advantage? With this knowledge, you can easily spot where genuine interest lies, instead of relying only on what’s displayed. See how liquidity actually forms in today’s fragmented market.
The New Algos: How Modern Players Manipulate Price
Do you think the rules are strict and price manipulation has disappeared? Nope! It’s still there and has just become smarter. After regulators cracked down on manual spoofing, where fake orders are placed to mislead others, algorithms stepped in with more advanced tactics.
Spoofing Today is Algorithmic
Nowadays, spoofers do not manually place and cancel large orders. Instead, they use modern algos to do so. These algos use the following tactics:
- Fleeting orders,
- Layered “walls” of liquidity, and
- Conditional logic.
These tricks create the illusion of heavy buying or selling pressure. However, the orders vanish before they ever trade.
Nowadays, Volume and Liquidity Games are Constant
In 2025, an algorithm plays multiple manipulation tricks, two of which are delineated below:
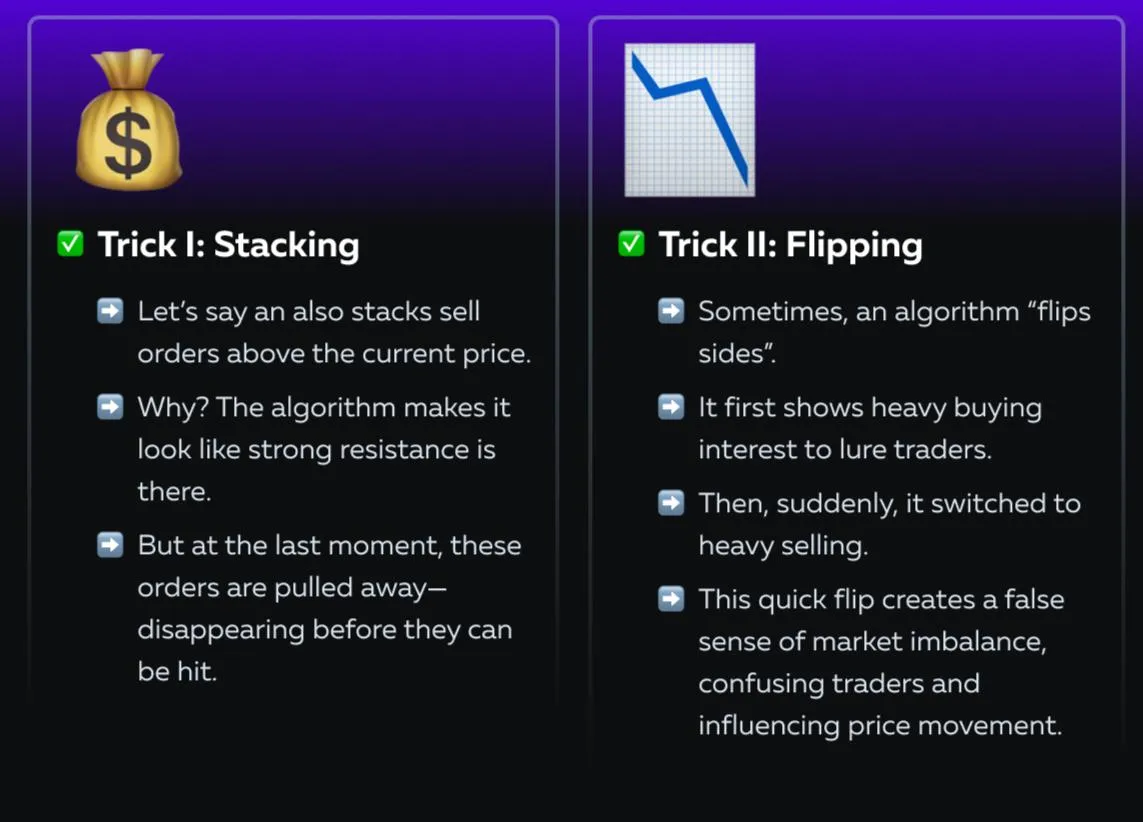
Most retail traders often react to these signals. They try to chase moves that were never real in the first place. Be aware that these tactics are part of ongoing market microstructure changes.
Even the Stop Runs Are Engineered
Do you think stop runs are just accidents? That’s a myth in 2025! In today’s markets, they’re often deliberately engineered by aggressive players. Here’s how it often unfolds in five clear steps:
- Liquidity is temporarily pulled from the order book. This leaves a gap.
- Then, the price is pushed through a key level. This triggers traders’ stop-loss orders.
- As those stops fire, the move accelerates.
- But just as quickly, the price reverses.
- The negative impact? Traders who sold (or bought) during the spike are now trapped.
This tactic is particularly common during rollover periods or times of low trading volume. For example, let’s say in the ES (S&P 500 futures), you might see a price break above a recent high. Then, it spikes for a few seconds, and later collapses right back down.
Do you think that’s a genuine breakout? Not at all! It’s a stop-run engineered by short-term algorithms. Therefore, in 2025, price action alone is no longer enough to judge intent. That’s because algos can manufacture false breakouts that are specifically designed to exploit stop placement and retail reactions.
What This Means for You as a Trader
Please realize the way markets move today is very different from a decade ago! If you’re still relying on old methods, you’re missing what really influences price. Let’s understand in detail:
Old Tools Miss the Modern Market
Classic indicators, such as moving averages or oscillators, were built around static timeframes and candle patterns. They can still be useful, but they don’t capture the detail of modern price formation.
Most of what moves the market today happens at the microstructure level. It isn’t random, but manufactured by placing or pulling liquidity. Now, most of your trading tools only show price charts. They don’t reveal:
- Order flow—who is buying or selling
- Market depth —how many orders exist at each price
- Volume intent—whether real buying/selling pressure exists
Thus, if you rely solely on these in 2025, you might as well be trading blindfolded.
Your Strategies Must Evolve
Support and resistance levels alone aren’t enough anymore! You need to understand how liquidity reacts as the price approaches those areas. In 2025, you should find answers to these questions:

These questions matter more than just drawing lines on a chart. Real trading edge now comes from reading liquidity + volume behavior in real time.
Advanced Platforms like Bookmap Add Value!
On Bookmap, you can visualize order flow. This lets you:
- See where algorithms are most active,
- Separate genuine liquidity from fake walls, and
- Spot engineered stop-runs or absorption zones before they trap you.
By shifting from static indicators to Bookmap, you can easily understand how liquidity and volume really influence the price movements.
Latest updates on order flow dynamics and liquidity metrics
In 2026, order flow dynamics are no longer just a niche concept used by advanced traders — they are central to understanding how modern markets function. Price is increasingly driven not by static supply and demand levels, but by how liquidity behaves in real time.
Key shifts in order flow dynamics include:
- Liquidity is constantly added, pulled, and repositioned rather than remaining stable
- Large participants fragment orders across multiple venues and time intervals
- Aggressive order flow (market orders) interacts with passive liquidity in highly dynamic ways
- Short-term imbalances now resolve faster due to algorithmic participation
Modern liquidity metrics go beyond simple volume or price. Traders now monitor:
- Order book imbalance
- Liquidity absorption
- Trade aggression (buy vs sell pressure)
- Order flow velocity
These metrics help answer a critical question: who is actually in control of the market at a given moment?
Recent developments in market microstructure research and theory
Market microstructure research has evolved significantly in recent years, shifting from theoretical models toward real-time behavioral analysis of markets.
Modern research focuses on:
- The interaction between liquidity providers and takers
- The role of algorithmic execution in shaping short-term price movement
- Market impact modeling based on order flow rather than price patterns
- The fragmentation of liquidity across venues and its effect on price discovery
Academic and institutional research increasingly highlights that price is not the primary signal — liquidity behavior is. This marks a major shift from traditional technical analysis toward microstructure-driven frameworks.
News regarding exchange mechanics and electronic trading infrastructure
Exchange mechanics and trading infrastructure have become a defining edge in modern markets. Execution quality now depends not just on strategy, but on how and where orders are routed.
Recent developments include:
- Improvements in matching engine efficiency
- Reduced latency between order submission and execution
- Smarter order routing across fragmented venues
- Increased use of co-location and proximity hosting
Understanding these mechanics is critical because they directly affect:
- Fill quality
- Slippage
- Execution priority
For a deeper breakdown of how markets function at this level, read more here:
https://bookmap.com/knowledgebase/docs/KB-Bookmap-Wiki-Market-Mechanics
Current trends in price discovery and limit order book depth
Price discovery has shifted away from slow accumulation toward rapid interaction between liquidity and aggressive order flow.
Key trends include:
- Price moves increasingly originate from liquidity imbalances rather than breakout patterns
- Order book depth changes rapidly near key levels
- Liquidity often disappears before large moves, creating sudden gaps
- True support and resistance now depend on active liquidity, not historical price levels
Traders who focus only on price miss how the move is being built underneath.
Breaking reports on trading architecture and matching engine efficiency
Modern trading architecture has become significantly more efficient, with exchanges optimizing their systems for speed, throughput, and fairness.
Key improvements include:
- Faster matching engines capable of handling extreme order flow volume
- Reduced latency variability across participants
- Enhanced data distribution systems for real-time feeds
- More sophisticated queue priority logic
These improvements mean markets react faster than ever — but also become more sensitive to liquidity shocks.
Impact of 2026 regulatory changes on dark pool liquidity and transparency
Regulation in 2026 continues to focus on improving transparency while preserving liquidity across fragmented markets.
Key developments include:
- Increased scrutiny on dark pool reporting
- Enhanced disclosure requirements for off-exchange trading
- Ongoing debate around internalization and payment for order flow
- Efforts to balance transparency with institutional execution needs
While regulation aims to improve fairness, hidden liquidity remains a core feature of modern markets — and traders must adapt rather than rely on full visibility.
How to incorporate order flow toxicity (VPIN) into a retail trading strategy
Order flow toxicity, often measured through VPIN (Volume-Synchronized Probability of Informed Trading), helps identify when the market is dominated by informed or aggressive participants.
For retail traders, this concept can be applied practically by:
- Identifying periods of unusually aggressive directional flow
- Avoiding trades when one-sided pressure dominates
- Recognizing when liquidity providers may withdraw
- Watching for rapid imbalance shifts before volatility expansion
Rather than calculating VPIN directly, traders can approximate toxicity by observing:
- sustained aggressive buying/selling
- rapid liquidity withdrawal
- imbalance persistence
Case studies on recent flash crashes caused by microstructure imbalances
Recent flash events highlight how fragile modern markets can be when liquidity disappears.
Common characteristics of these events include:
- Sudden withdrawal of liquidity
- Rapid triggering of stop orders
- Thin order books amplifying price movement
- High-speed execution compounding the move
These events are not random — they are microstructure failures where supply and demand temporarily disconnect.
Best high-frequency data providers for backtesting microstructure models
Backtesting microstructure-based strategies requires high-resolution data.
Key considerations when choosing data providers include:
- tick-level granularity
- order book depth history
- accurate timestamp synchronization
- consistency across sessions
Without this level of data, it is impossible to properly analyze order flow behavior or simulate realistic execution conditions.
Comparison of HFT performance across different exchange latency tiers
Latency differences across exchanges create measurable performance gaps for high-frequency participants.
Lower latency environments allow:
- faster order placement
- better queue positioning
- reduced slippage
- more efficient arbitrage
Even small differences in execution speed can lead to significant advantages in highly competitive markets.
Comprehensive guide to quantitative finance and algorithmic trading
Quantitative finance and algorithmic trading now dominate market participation.
Core components include:
- statistical modeling
- execution algorithms
- risk optimization
- market impact modeling
Understanding these systems helps traders interpret behavior rather than react blindly to price movement.
How global financial market regulations affect institutional investors in 2026
Institutional behavior is shaped heavily by regulation, including:
- capital requirements
- execution transparency rules
- reporting obligations
- cross-border compliance
These constraints influence how institutions provide liquidity, manage risk, and execute large orders.
Evolutionary trends in electronic exchange design and market evolution
Electronic exchanges continue evolving toward:
- faster execution environments
- improved data transparency
- smarter routing systems
- better handling of extreme volatility
These changes reinforce the importance of understanding how markets operate beneath the surface.
Foundations of financial econometrics and asset price formation
Modern price formation is influenced by:
- order flow
- liquidity distribution
- execution timing
- participant behavior
Financial econometrics now increasingly incorporates microstructure variables rather than relying solely on historical price data.
The role of artificial intelligence in modern capital market infrastructure
Artificial intelligence plays a growing role in:
- execution optimization
- liquidity detection
- pattern recognition
- adaptive trading strategies
AI systems can react faster than traditional algorithms, further increasing competition in modern markets.
Conclusion
After reading the entire article, you must have understood that today’s markets have significantly changed. They aren’t just faster! Instead, they’re more complex and fragmented. Also, they are heavily influenced by algorithms that act in ways most traders can’t see on a standard chart.
That’s why your strategies that worked in 2010 will often fall short in 2025. It’s not that you suddenly lost the skill to read markets. Rather, the market microstructure itself has changed. Liquidity now hides and changes in milliseconds. Thus, old tools are less reliable.
So, how to succeed in 2025? You need to see beyond candles and static indicators. You must understand how liquidity appears, disappears, and influences real price action. And that’s where Bookmap comes in.
Using Bookmap, you can get a 100% clear and real-time view of liquidity, order flow, and hidden activity. So, want to trade with confidence? You can’t trade 2025 markets with 2010 assumptions—Bookmap shows you what’s changed!
Additional industry insights and market coverage
Real-time news on Nasdaq’s low-latency matching engine updates for 2026
Nasdaq continues to invest heavily in matching engine performance, with 2026 updates focused on reducing execution latency and improving throughput during peak volume periods. These changes aim to create more consistent fill quality across participants, but they also increase competition, as faster infrastructure allows high-frequency firms to react even more quickly to order flow changes.
Market microstructure analysis of Bitcoin ETFs versus spot market liquidity
Bitcoin ETFs have introduced a new layer of liquidity interaction between traditional finance and crypto markets. While ETF flows can influence spot pricing, the underlying liquidity structure remains fragmented across exchanges. This creates scenarios where ETF-driven demand does not immediately translate into spot liquidity support, leading to short-term dislocations that active traders can monitor.
Top-rated academic journals publishing microstructure research this year
Leading journals such as the Journal of Finance, Journal of Financial Markets, and Review of Financial Studies continue to publish research focused on liquidity behavior, order flow dynamics, and execution efficiency. Recent papers increasingly emphasize empirical analysis using high-frequency data, reflecting the shift toward microstructure-driven trading frameworks.
Remote job openings for market microstructure analysts in the London fintech sector
London remains a major hub for quantitative trading and fintech innovation. Many firms are actively hiring microstructure analysts with expertise in order flow, execution modeling, and high-frequency data analysis. Remote and hybrid roles are becoming more common, particularly for positions focused on research, backtesting, and trading infrastructure optimization.
Proprietary trading firm reviews focusing on market-making and microstructure edge
Proprietary trading firms are increasingly evaluated based on their ability to provide infrastructure, data access, and execution advantages rather than just capital. Firms with strong market-making capabilities, low-latency connectivity, and access to full-depth data tend to offer a more sustainable edge for traders focused on microstructure strategies
FAQs
1. What is market microstructure?
Market microstructure is the foundation of trading—the nuts and bolts of how markets operate.! It explains:
- How orders are placed,
- How these placed orders are matched, and
- How these matched orders are executed in the market.
It also covers where trades happen (on exchanges, dark pools, or alternative venues) and how liquidity behaves. By studying microstructure, you, as a trader, can understand why price moves the way it does and how hidden forces influence market behavior.
2. Why does speed matter in modern trading?
Speed matters because the market no longer runs at human pace! Algorithms now dominate trading. They can execute orders in microseconds, which is far faster than any trader can react. This speed gives them an edge in:
- Absorbing liquidity,
- Triggering stops, and
- Faking moves.
All this can happen before retail traders can even respond. Now, if you don’t account for this, there is a high risk of poor fills and slippage. Also, you may be tricked into chasing false breakouts.
3. What is liquidity fragmentation?
Liquidity fragmentation means that trading volume is spread across many different venues instead of being concentrated in one place. Years ago, most activity was visible on a few major exchanges. But now, volume is divided between dozens of:
- Exchanges,
- Dark pools, and
- Private trading systems.
The impact? This makes the market less transparent because what you see on one platform doesn’t reflect all the actual buying and selling.
4. Are spoofing and manipulation still legal?
Spoofing and manipulation of any form have always been illegal. However, in 2025, these tactics have evolved to save themselves from the eyes of regulators. Nowadays, modern algorithms use:
- Fleeting orders,
- Order layering, and
- Quick cancels.
These tactics trick others into believing there’s buying or selling pressure! But why aren’t they caught? These actions happen in milliseconds and often within legal loopholes. That’s why they are harder for regulators to catch. So, these tactics look legal on paper, but the intent is still to mislead other traders.
5. How can I adapt my trading to a modern structure?
Don’t rely only on old indicators or charts! Instead, you must watch:
- How does liquidity form?
- How does liquidity disappear?
- How do trades get absorbed?
To gain further precision, as a trader, you should also study how algorithms behave during:
- News events,
- Low volume hours, and
- Near key price levels.
These analyses can be easily done using market analysis tools, like Bookmap. Using them, you can get real-time visibility into hidden orders and liquidity. The benefit? You trade with context and not guesswork!
Are you looking for live quotes or simply trading hours information?
Futures markets trade nearly 24 hours per day during the week. If you need live quotes, access to real-time futures data is required. If you are only researching trading hours, most major index futures follow the CME Globex schedule with brief daily pauses.
Which specific index or commodity are you tracking?
Different futures contracts influence different parts of the stock market. S&P 500 and Nasdaq-100 futures reflect broad equity sentiment, while crude oil, gold, and bond futures may influence sector-specific price movement.
Do you want to understand how futures predict the market open?
Futures reflect investor positioning before the stock market begins trading. When index futures rise or fall overnight, they often signal how equities may open, although actual stock performance depends on liquidity and new information at the opening bell.
Are you focused on Globex trading sessions or traditional pre-market equity hours?
Globex refers to the nearly 24-hour electronic futures trading session. Traditional pre-market equity hours apply to stocks trading before the regular exchange open. Understanding the distinction helps traders interpret where price signals originate.
Which asset class?
The type of heatmap you need depends on whether you trade stocks, futures, or crypto. A broad market treemap may be useful for sector-level analysis, while a market depth heatmap is more useful when trading a specific instrument and needing to see how liquidity behaves at exact price levels.
Looking for platform recommendations?
If you are comparing heatmap tools, the first step is deciding whether you need a market performance dashboard or an order book visualization platform. Traders focused on execution and liquidity behavior generally benefit more from a platform that shows real-time depth and trade interaction.
Need a tutorial?
If you want help getting started with Bookmap, use this guide:
https://bookmap.com/learning-center/en/getting-started/platform/downloading-and-installing-bookmap
This is the best place to begin if you want a practical walkthrough of installation, setup, and first use.
Are you trading stocks, futures, or crypto?
Order flow behavior varies by market:
Stocks → focus on liquidity shifts and hidden orders
Futures → emphasis on imbalances and absorption
Crypto → higher volatility and liquidity gaps
Is real-time speed a priority for you?
For many traders, speed and data accuracy are critical. Platforms that provide real-time data and low-latency updates offer a clearer view of market behavior:
https://bookmap.com/blog/stock-trading-tools-with-real-time-data-how-modern-traders-monitor-markets
Faster data allows traders to react to liquidity changes before they fully impact price.
Do you need API connectivity?
Some traders require direct integration with data feeds or execution systems, especially when building automated strategies or custom dashboards.
What is your experience level?
Your platform choice should reflect your experience:
New traders → prioritize clarity and ease of use
Experienced traders → prioritize depth, speed, and customization
Are you tracking US benchmarks or international markets like the FTSE or Nikkei?
U.S. futures provide the clearest signal for the American cash session, but international markets often shape sentiment first. FTSE, Nikkei, DAX, and other overseas benchmarks can influence U.S. futures before the opening bell.
Do you require real-time streaming quotes or a summary of analyst forecasts?
Real-time streaming quotes are best for traders actively monitoring overnight positioning. A summary of analyst forecasts is more useful for higher-level planning, but it may miss immediate changes in liquidity and sentiment.
Are you focusing on specific indices like the Russell 2000 or the S&P 500?
Different indices reflect different parts of the market. The S&P 500 is the broadest benchmark, Nasdaq is more tech-sensitive, Dow is more industrial and blue-chip oriented, and Russell 2000 is more tied to small caps and domestic risk appetite.
Are you looking for technical entry points or general market sentiment?
Some traders only want a directional read for tomorrow’s open. Others want specific technical levels for entries, exits, and risk management. Futures can support both, but the analysis should be tailored accordingly.
Do you need information on commodity futures like oil and gold as well?
Oil, gold, and Treasury futures often influence equity sector behavior and overall sentiment. Traders preparing for tomorrow’s open frequently monitor these alongside equity index futures.
Are you looking for academic research papers or industry news alerts for traders?
If you’re focused on theory and models, academic research can provide deep insight into liquidity behavior and price formation. If you’re trading actively, real-time news and market updates are often more practical for decision-making.
Do you want updates on traditional equity markets or decentralized finance (DeFi) microstructure?
Equity market microstructure is more standardized and regulated, while DeFi markets are still evolving with different liquidity dynamics. Your focus will determine which data and tools are most relevant.
Are you focusing on specific venues like the NYSE, CME, or Eurex?
Each venue has different matching rules, liquidity profiles, and participant behavior. Understanding the nuances of your primary trading venue can improve execution and strategy development.
Is your interest in high-frequency trading (HFT) regulations or general liquidity trends?
HFT regulation focuses on fairness, latency, and market stability, while broader liquidity trends help traders understand how markets behave across different conditions. Both perspectives are valuable depending on your strategy.
Would you prefer a summary of weekly institutional insights or real-time news feeds?
Weekly summaries provide structured context and longer-term perspective, while real-time feeds help you react to immediate market changes. Many traders use both to balance preparation and execution.
Sign Up Now