See event-driven moves without chasing headlines.
Compare plans to track real order flow during news-driven volatility.
Market Analysis
March 18, 2026
SHARE
Event Trading in 2026: Why Headline Speed Is Not the Edge

In 2026, financial markets adjust to headlines almost instantly. As soon as economic releases are released, algorithms read the data and reposition orders within milliseconds. In response, liquidity providers update quotes based on their perceived risk.
The result? Price changes before most retail participants even finish reading the headline.
Many traders still believe reacting early creates an advantage. But this belief comes from older market conditions. Machines heavily influence today’s modern execution and leave zero scope for manual interpretation.
Nowadays, the real edge does not come from reacting first. Instead, it comes from understanding what happens after the initial move.
This article explains how liquidity disappears and rebuilds after news, how order flow confirms continuation or rejection, and why many breakouts fail. Lastly, it also delves into how market structure determines whether the price sustains or reverses.
The Myth of Headline Speed
A common belief behind any headline trading strategy is that reacting to news headlines creates a trading edge. This assumption was more valid in the past, when information flow was slower. Earlier, economic data and headlines moved with delays through:
- Television,
- Broker terminals, and
- News wires.
As a result, order books adjusted in “stages” as participants interpreted the information, which created short-lived reaction windows in which the price had not fully reflected the news. But this has changed in 2026.
In 2026, Machines Act Before Human Interpretation

Today, economic releases such as the trading CPI release or central bank announcements are distributed in machine-readable formats. Thus,
- Co-located servers read the data directly from exchange-linked feeds.
- Algorithms compare the actual number with expected values using predefined logic.
- Liquidity providers adjust quotes automatically based on risk exposure.
This process happens within milliseconds of the release. By the time the headline appears on a retail platform and manual interpretation begins, the order book has already adjusted. Consequently, prices, spreads, and available liquidity reflect the new information.
What Happens Inside the Order Book During Major News?
Nowadays, during high-impact events:
- Spreads widen significantly due to uncertainty.
- Passive limit orders are removed to avoid adverse fills.
- Hidden liquidity enters as aggressive orders.
- Market depth becomes thinner.
These events create sharp price movements. However, it reflects only a “temporary liquidity imbalance” rather than a genuine directional commitment, which creates an illusion of opportunity.
Most new traders interpret this as an appearance of opportunity. They fail to realize that much of the movement during news trading volatility comes from reduced liquidity (not delayed reaction). The repricing process is already complete at the structural level even before manual participation begins.
As a result, reacting to headlines alone does not provide an informational advantage in modern electronic markets. Analyze event moves with full depth and transaction data → Compare Packages.
What Actually Happens in the First 60 Seconds After the News

The first 60 seconds after a major economic release show how markets adjust to new information. By analyzing this phase, traders can spot several structural changes in liquidity and order flow. The following are the stages of this market phase:
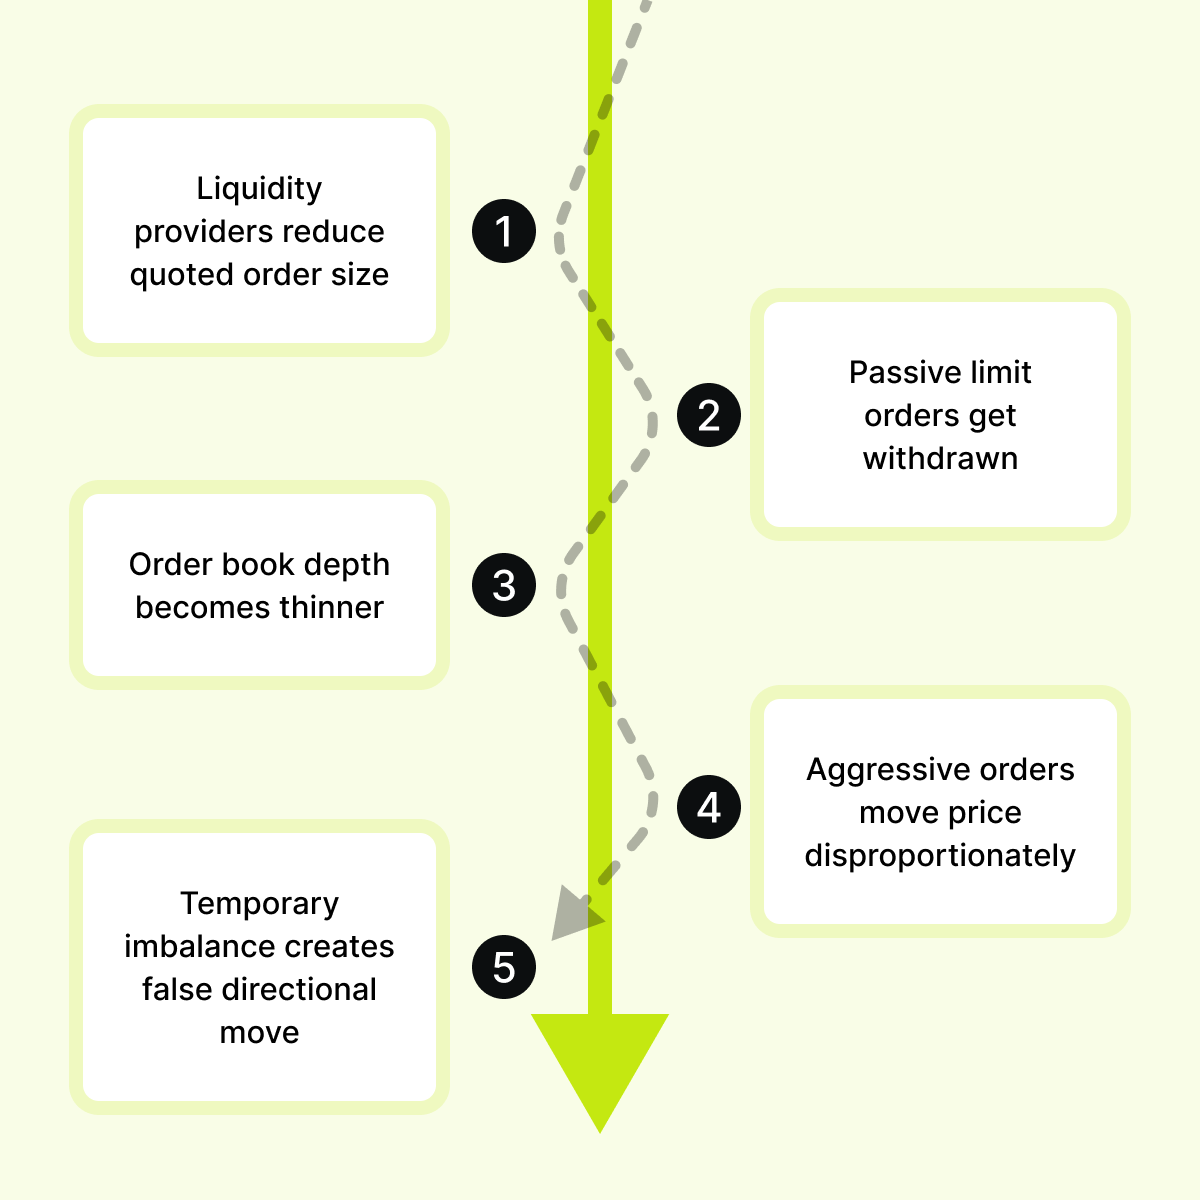
Stage 1: Liquidity Evaporation
Before the release, liquidity providers begin reducing exposure. Consequently,
- Quoted order sizes decrease across price levels.
- Market depth becomes thinner.
- Visible resting limit orders decline.
This “defensive positioning” reduces the risk of unpredictable price movement. However, later, when the number is released, the order book structure changes immediately:
- Spreads widen due to uncertainty.
- The order book becomes uneven, with gaps between price levels.
- Even small market orders cause significant price movement.
In this initial move, there is usually a “liquidity vacuum”. It does not represent a firm conviction. Instead, price moves more easily because fewer resting orders exist to absorb incoming pressure. This pattern is typical during major releases, such as inflation or central bank decisions.
See how liquidity disappears and rebuilds in real time during news events → Compare Packages.
Stage 2: Forced Participation
After the initial liquidity gap, a forced order flow starts to influence the next phase. In this stage, stops cluster around obvious technical levels, such as:
- Prior highs and lows,
- Range boundaries, and
- Visible breakout points.
When the price reaches these areas, stop-loss orders are triggered, creating “cascades of market orders”. And at the same time:
- Momentum traders enter in the direction of the breakout.
- Aggressive buying or selling increases sharply.
- Delta spikes due to a strong imbalance between buyers and sellers.
All of this creates the appearance of firm directional conviction. For example,
-
- During a trading CPI release or FOMC trading strategy scenario, heavy selling may push the price below a prior value area.
- But if the price fails to remain below that level and returns inside the range, it signals “rejection”.
- This rejection indicates that the initial selling came from forced participation rather than long-term acceptance.
Such a distinction separates temporary volatility from any actual structural change. Understand participation shifts instead of reacting blindly → Compare Plans.
Stage 3: Structural Decision
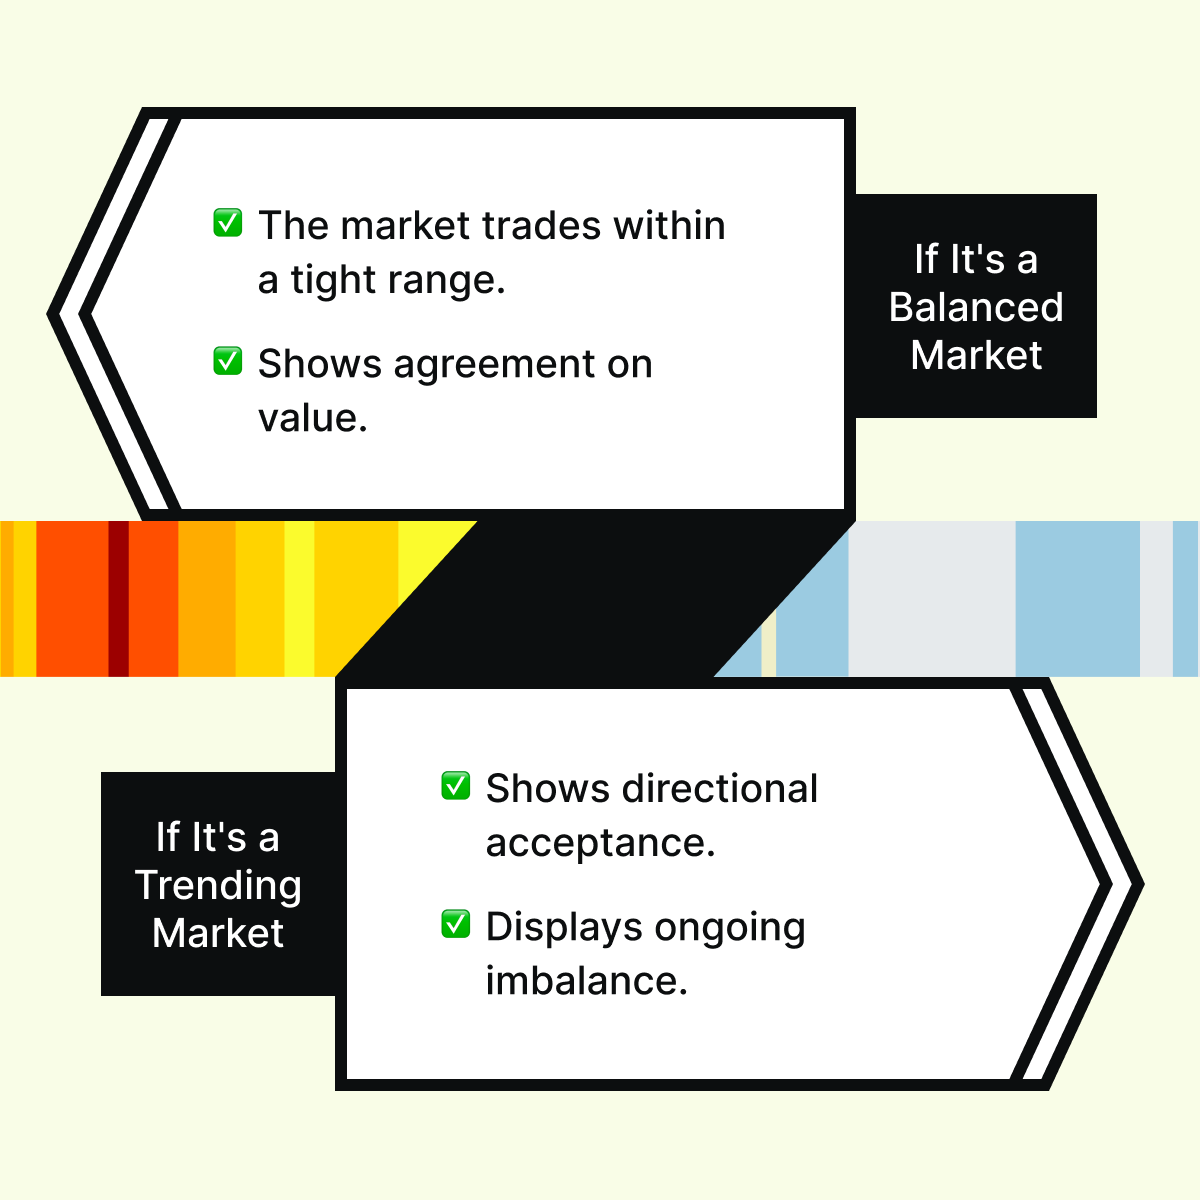
This stage is crucial since this is where relevant information appears. The initial spike (Stage 1) and the stop cascade (Stage 2) show only forced activity. In Stage 3, traders can understand whether the market accepts or rejects the new price level. Such an analysis can be done by checking for these four signals:
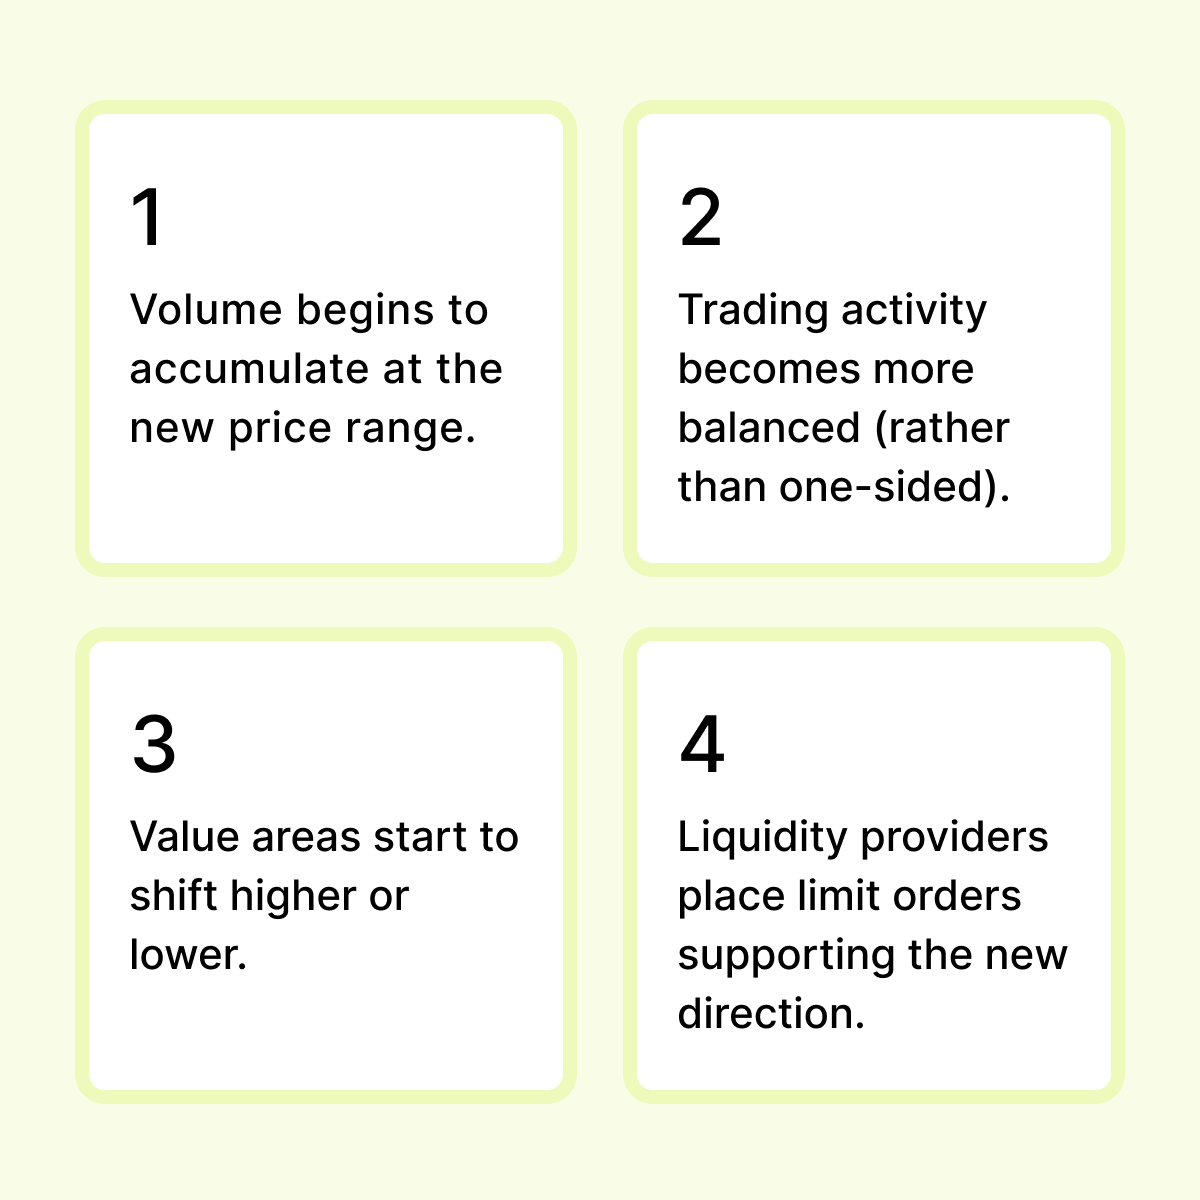
These signals indicate acceptance. Acceptance means market participants agree that the new price reflects fair value after the news event. In contrast, rejection shows a different pattern:
- Volume does not sustain at the new level.
- Liquidity remains thin or shifts in the opposite direction.
- Price rotates back toward the prior value area.
This behavior indicates that the initial move came only from a temporary imbalance. There was no structural agreement. Realize that continuation requires acceptance. Without volume support and value migration, price cannot sustain the move.
Why Most News Breakouts Fail
Usually, breakouts during major economic releases appear strong. But they fail to sustain because visible price movements do not always reflect genuine agreement among market participants.
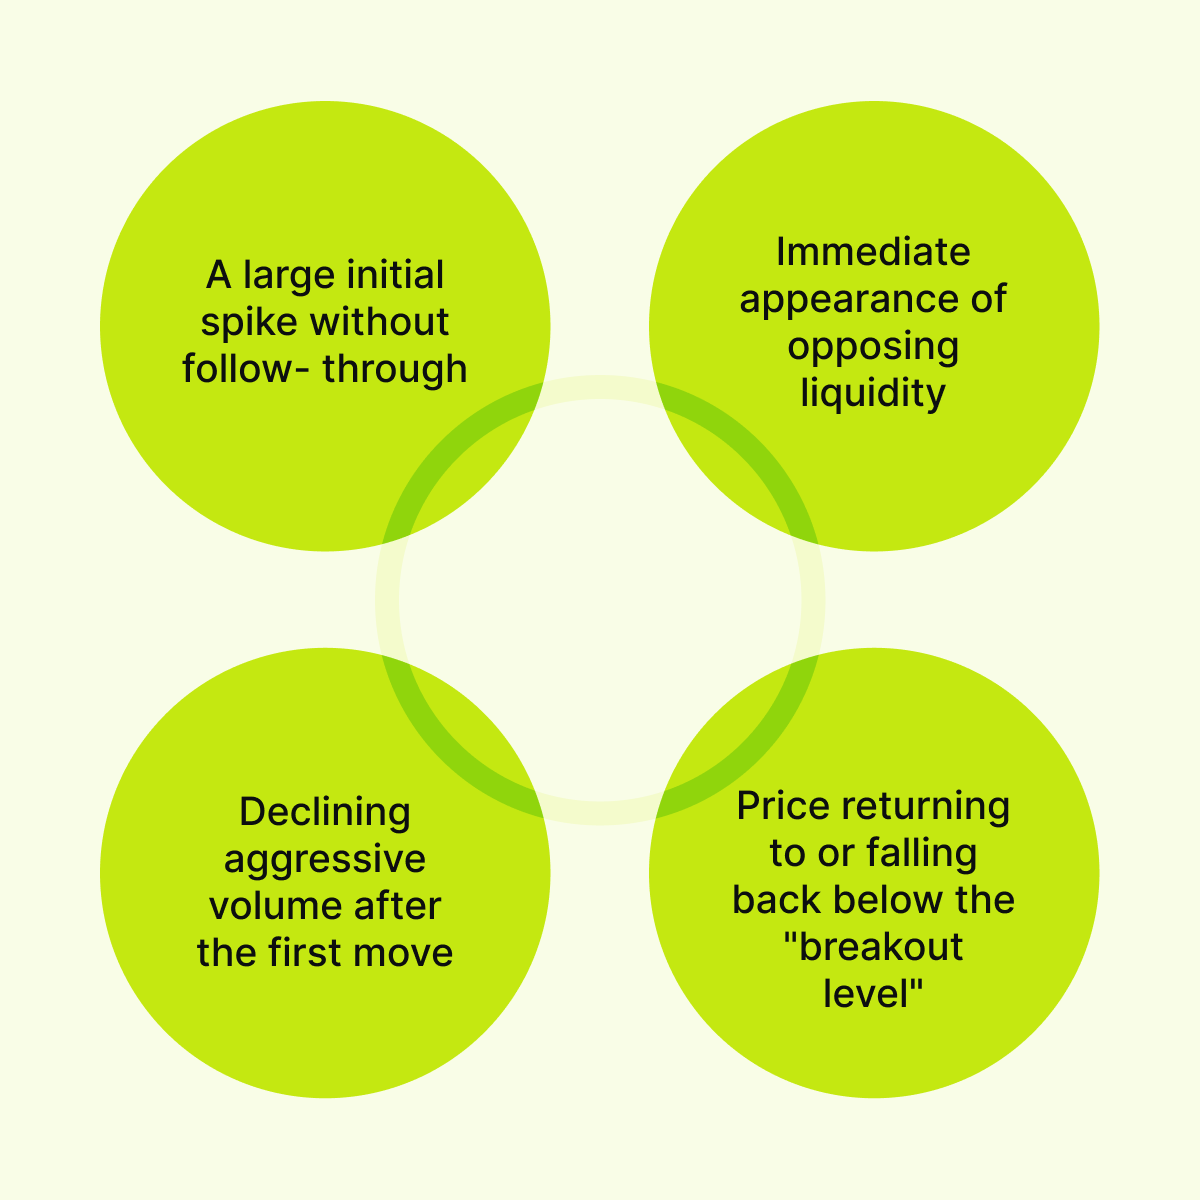
Misreading these moves is one of the most common errors in any headline trading strategy. Many traders interpret these three “visual signals” as confirmation:
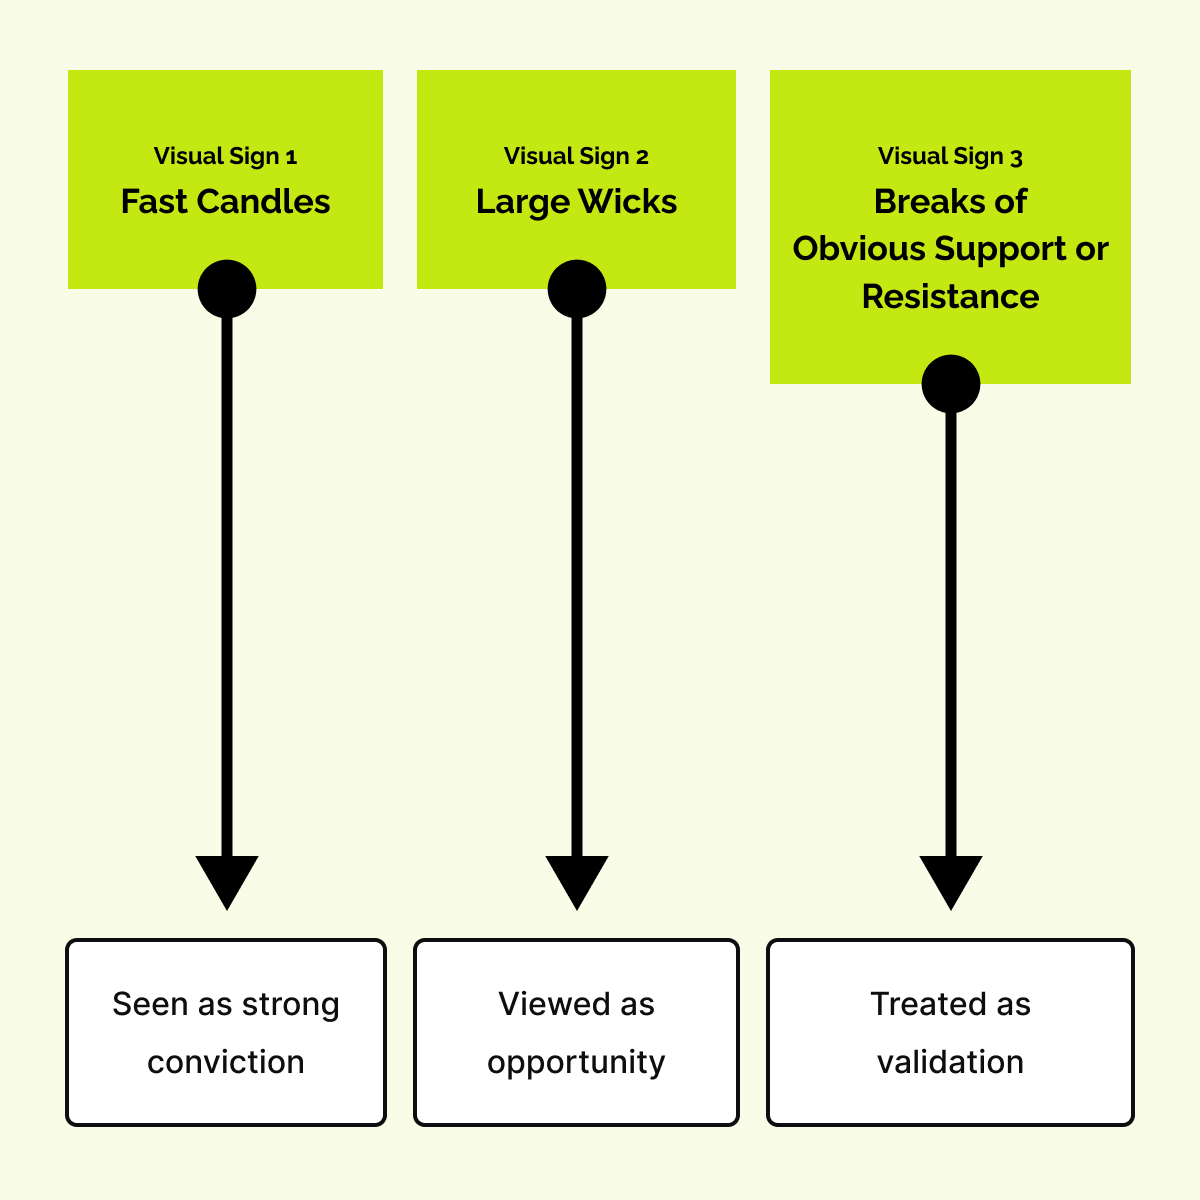
These visual signals reflect only mechanical reactions, not true directional intent. On event days, most traders fail to realize that:
- Liquidity gaps allow prices to move easily between levels.
- Stop-loss orders trigger cascades of forced buying or selling.
- Algorithms fade moves that extend too far beyond fair value.
These events create artificial momentum. As a result, the move appears strong, but it lacks structural support. Here’s an example:
- Consider a scenario where inflation data prints above expectations.
- Price drops 30 points immediately after the release.
- Selling appears aggressive and directional.
- Within minutes, buyers absorb selling near the prior daily low.
- Price reclaims 50 percent of the initial decline.
These events show that the breakdown was due to a stop liquidity, i.e., there was no sustained selling interest. Once forced selling ended, the price returned toward its prior value.
How Do Execution Conditions Deteriorate During News Volatility?
During periods of high news trading volatility, execution conditions deteriorate significantly. The following events may be observed:
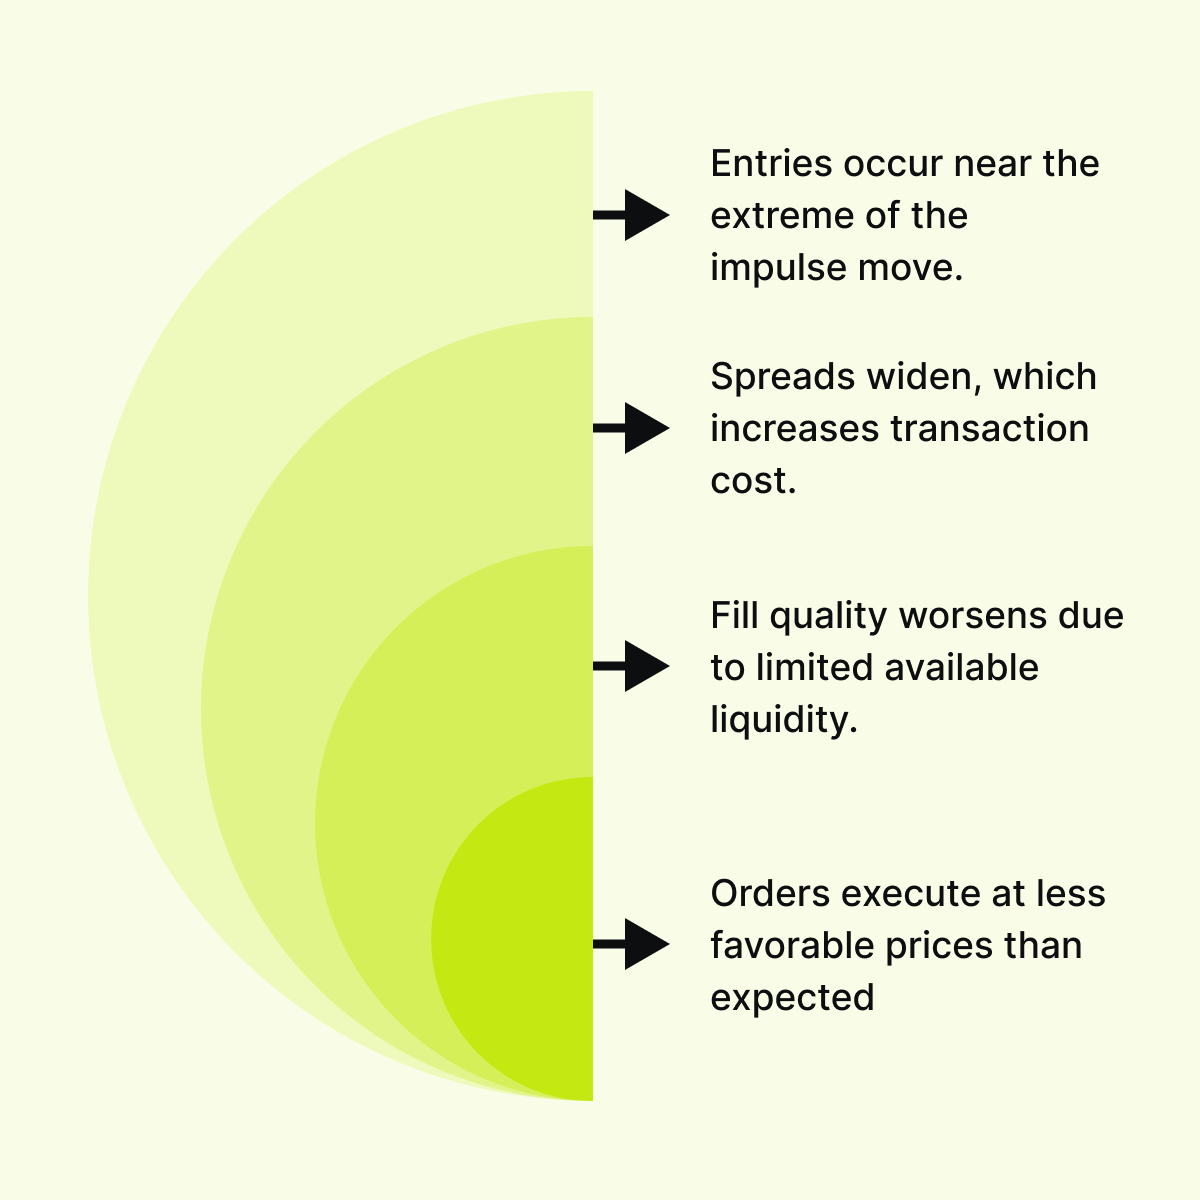
All these conditions create slippage, meaning the difference between the expected price and the actual execution price increases. See how real-time liquidity behaves during news events → Compare Packages
Pre-Event Structure Determines Post-Event Reaction
Markets do not begin from a neutral state when economic data is released. Price already reflects positioning, expectations, and liquidity distribution. Additionally, before major releases, several structural conditions develop:
- Institutional and speculative positioning builds over time.
- Value areas either compress into narrow ranges or expand into trends.
- Liquidity clusters form around key support, resistance, and prior value zones.
- Imbalances appear as the price moves away from fair value.
These conditions determine how the market responds to new information.
How Does Market Structure Reveal Potential Reaction?
The “pre-event environment” provides the following context:
Furthermore, market participants may notice these structural signals:
- If the price is near higher timeframe liquidity levels, it signals potential absorption or rejection.
and
- Migrating value areas indicate gradual acceptance at new price levels.
These structural signals determine whether the event reinforces the current direction or triggers rotation. Here are two examples:
| Example 1: Compressed range before CPI | Example 2: Extended price before FOMC |
|
|
Furthermore, when a “post-event movement” is concerned, it does not depend only on the news. Instead, it is influenced by whether the market was balanced, trending, or extended before the release.
Order Flow During Events: What Actually Confirms Continuation
Continuation during a news event is not confirmed by large candles alone. Price movement must be supported by:
- Sustained participation, and
- Structural acceptance.
In any event, the trading strategy’s confirmation comes from how order flow behaves after the initial breakout, not during the first impulse. Usually, “true continuation” indicates that market participants agree the new price level reflects fair value. Some confirming signals are:
| Confirmation Signals of Price Continuation | Explanation |
| Sustained Aggressive Volume in One Direction |
|
| Pullbacks Show Absorption (There is No Reversal) |
|
| Liquidity Builds Behind Price |
or
|
| Delta Remains Aligned During Retests |
|
| Value Begins Forming at New Levels |
|
These signals show structural continuation rather than temporary imbalance. On the contrary, if we talk about “failed continuation”, it follows a different pattern. The initial breakout lacks sustained support. Some common signs here are illustrated below:
This behavior shows rejection. Continuation cannot develop without:
- Sustained volume,
- Liquidity support, and
- Value migration.
The presence or absence of these elements determines whether the breakout becomes a lasting trend or a failed reaction.
Conclusion
In 2026, speed belongs to machines. Algorithms read headlines, adjust quotes, and reposition liquidity before manual participation begins. As a result, reacting to headlines alone does not create an advantage.
Instead, what happens after the initial reaction is now more critical. Real trends form only when participation continues, and the market builds value at new price levels.
Traders must note that sustained volume, liquidity, and value migration confirm acceptance. Without these elements, price often returns to the prior range.
Thus, in 2026, the edge does not come from being the first to react. It comes from recognizing whether the market accepts or rejects the new price after the news event. See how real-time liquidity reveals whether news moves are accepted or rejected → Compare Packages.
FAQs
1. What is event trading?
In it, trading execution occurs around major economic announcements, such as inflation data or central bank decisions, because such events shift expectations about interest rates and the economy. An event trading strategy focuses on how the price reacts to new information and whether the market accepts or rejects the new price levels.
2. Why do news breakouts often fail?
Many breakouts during news events occur because liquidity is thin and stop-loss orders are triggered, creating sudden movement without strong support. Later, once stop orders finish, genuine buyers or sellers may not continue the move.
As a result, due to a lack of sustained participation, the price returns to its previous range.
3. Should traders avoid the first move after news?
Usually, the first move reflects liquidity gaps and forced orders. In this phase, spreads are wider and execution quality is lower. Through waiting, traders can let the market rebuild liquidity and observe whether the new price level is accepted or rejected. Such an approach reduces the risk of false breakouts.
4. How can traders confirm continuation after a headline?
Continuation is confirmed when:
- Volume builds at the new price,
and
- Liquidity supports the direction.
After a headline, when pullbacks remain “shallow” and do not return to the prior range, it shows price acceptance.
Sign Up Now