


See how a named setup replaced random trades.
Compare plans to track repeatable liquidity and order flow patterns in Gold and Nasdaq.
Interviews
September 28, 2026
From Random Trades to a Named Setup: How Power User Z Built an Edge Trading Gold and Nasdaq
Trading futures since March 2024 · Gold & Nasdaq scalper · Bruce Pilot Program & Bookmap Academy
Power User Z trades fast. His typical position lasts between two and twenty minutes, six on average, scalping Gold and taking Nasdaq around the New York open. Before Bookmap, his biggest problem wasn’t a lack of tools. It was not having a real reason to take most of his trades.
A Scalper Looking for Something Repeatable
Power User Z has been trading futures actively for about two years, since March 2024. Before Bookmap, his process leaned on candlesticks, price action, and volume profile, tools that gave him a read on the market but never quite added up to a repeatable process.
“My biggest problem was taking random trades. Now that I have found a couple of setups, I resist the temptation of jumping into random trades.”
– Power User Z
Trending, continuation markets were the hardest for him to read. Like a lot of traders, he’d internalized price as a wavy, mean-reverting pattern, so his instinct after a move up was to expect it to come back down. More often than not, price just kept trending, and that mismatch between instinct and reality cost him trades and, over time, some of his confidence.
Discovering Bookmap Through a Livestreamer
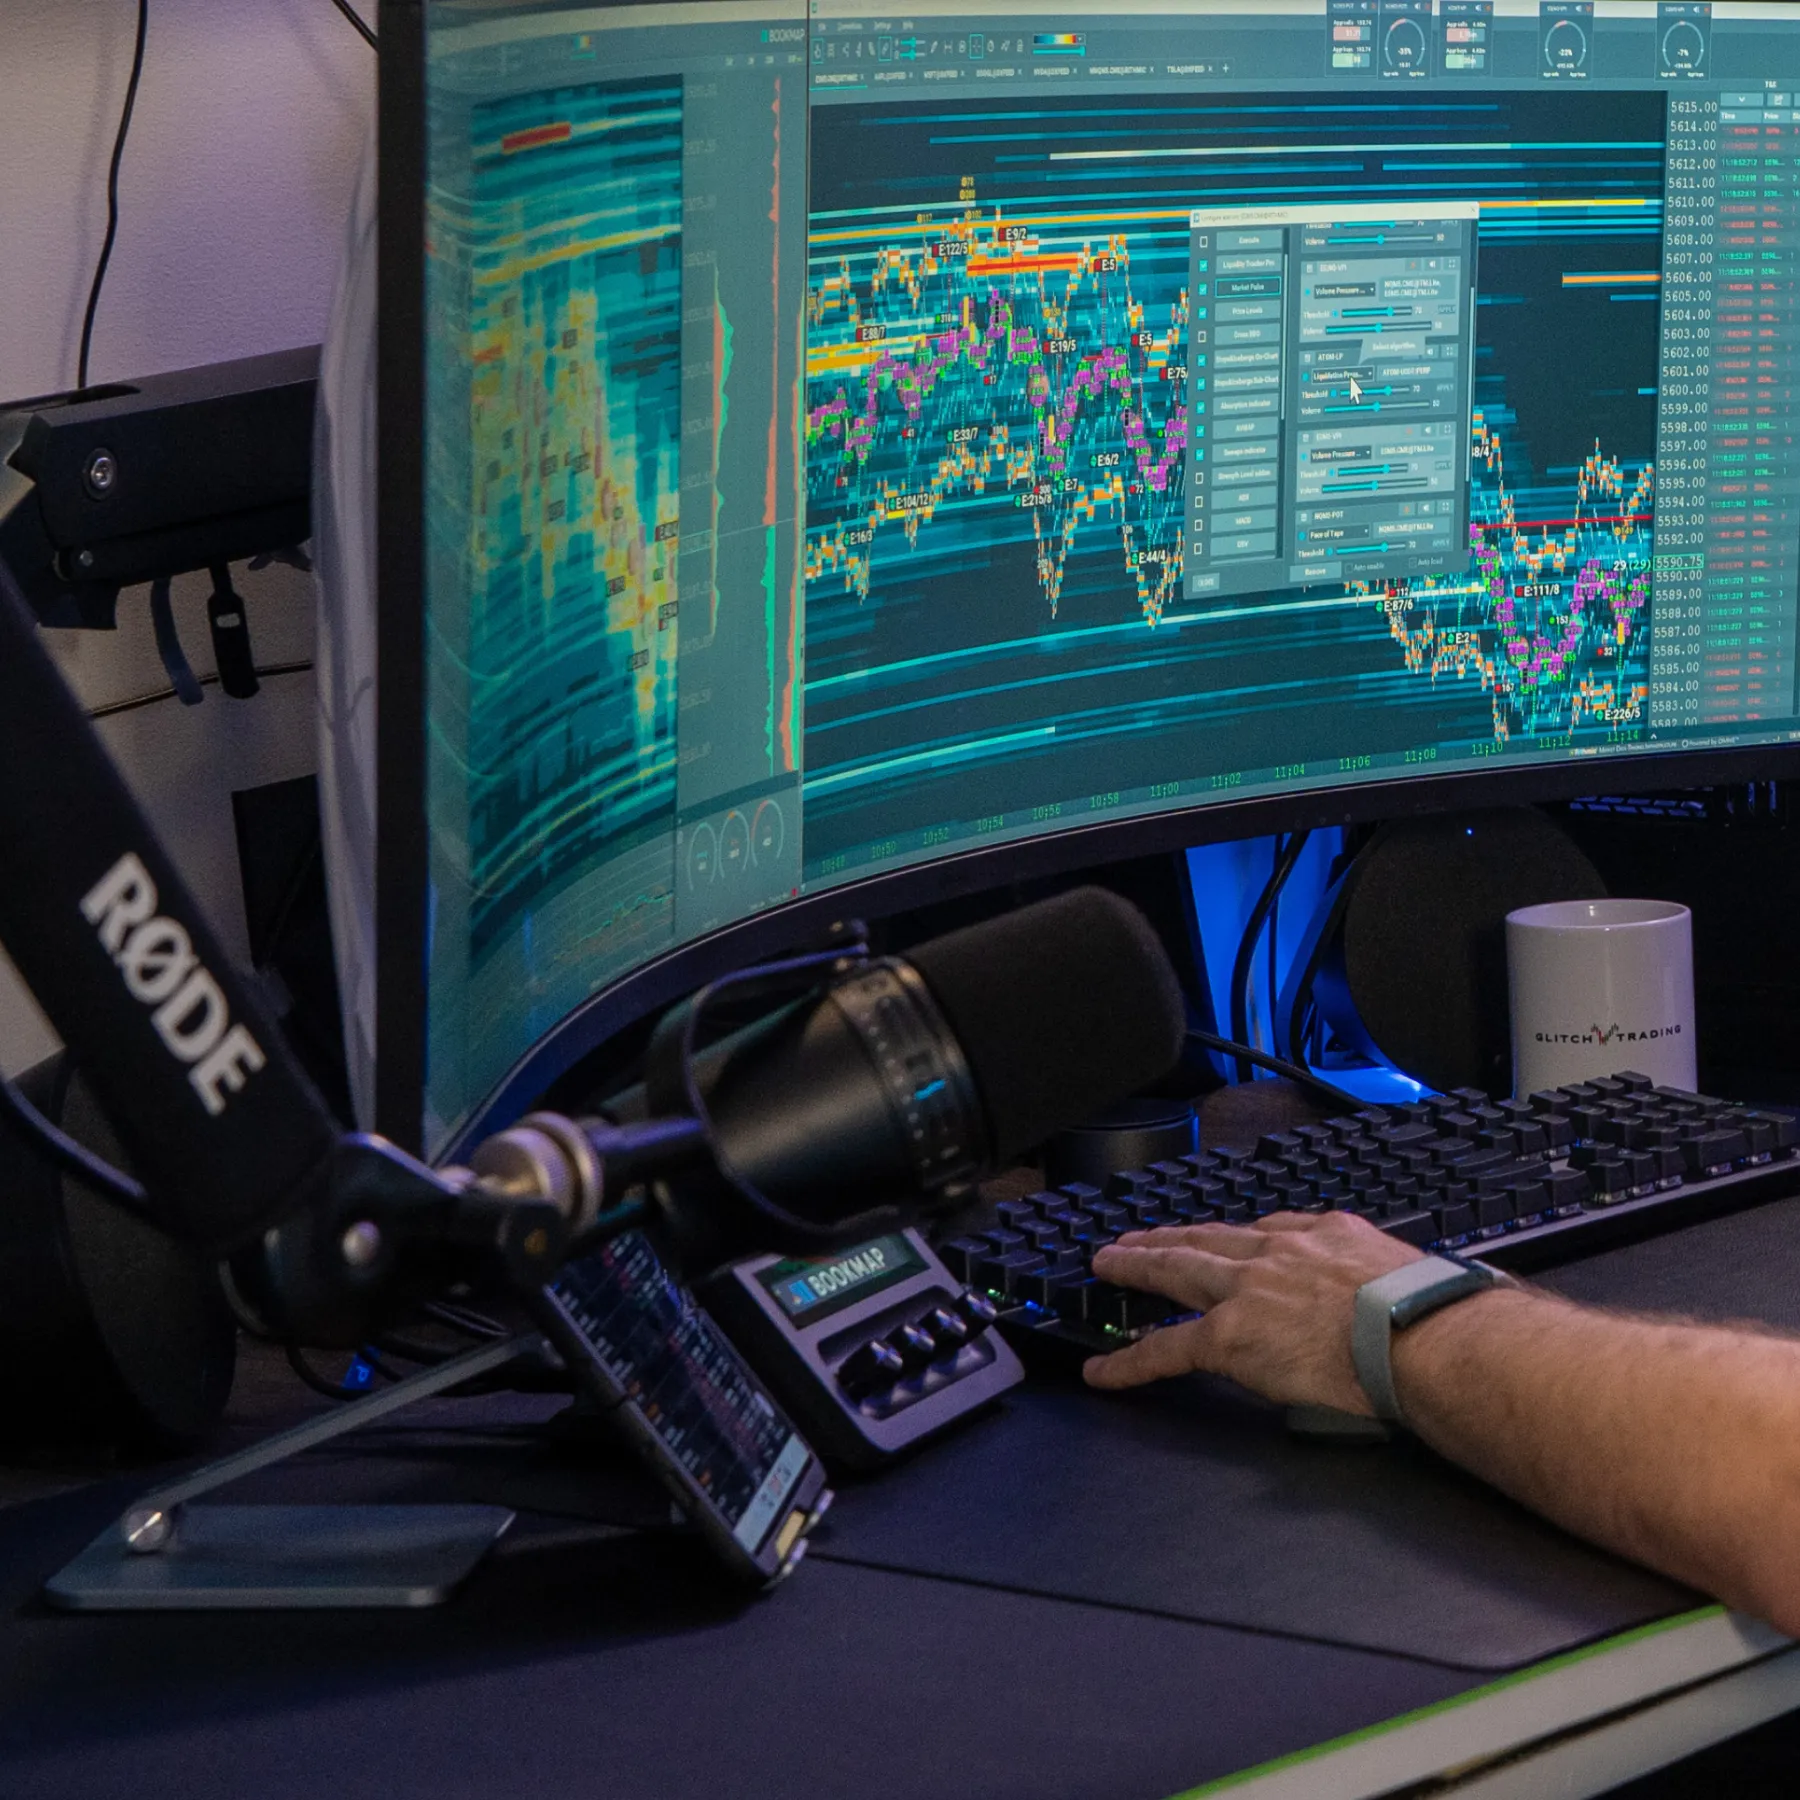
Power User Z first came across Bookmap watching RIPS, a livestream trader whose screen immediately stands out, by his account, RIPS turned $100,000 into more than $3 million last year, all livestreamed. RIPS isn’t a Bookmap trainer and his trading style is quite different from Power User Z’s own. But he’s one of the platform’s biggest proponents, and new viewers ask about the odd-looking bubbles on his screen constantly. RIPS has said that early in his own career he used to record Bookmap streams and rewatch the replays for hours, every day.
“Bookmap is like an x-ray vision. Once you know how to see and what to see, the picture becomes clear.”
– Power User Z
Going in, he half expected the sheer amount of data to overwhelm his setup entirely. It didn’t. What he was really after was that x-ray view of what was happening underneath the candles, and he says it’s coming true, gradually, the more time he spends with it.
The part that took longest to work out wasn’t the platform itself but the pricing structure behind it: the Bookmap subscription, market data, and add-ons are three separate layers, each with its own set of options, and he says it can take new users weeks or months to fully understand the total cost involved.
When It Clicked: Bruce’s Webinar and the Idea of an Edge
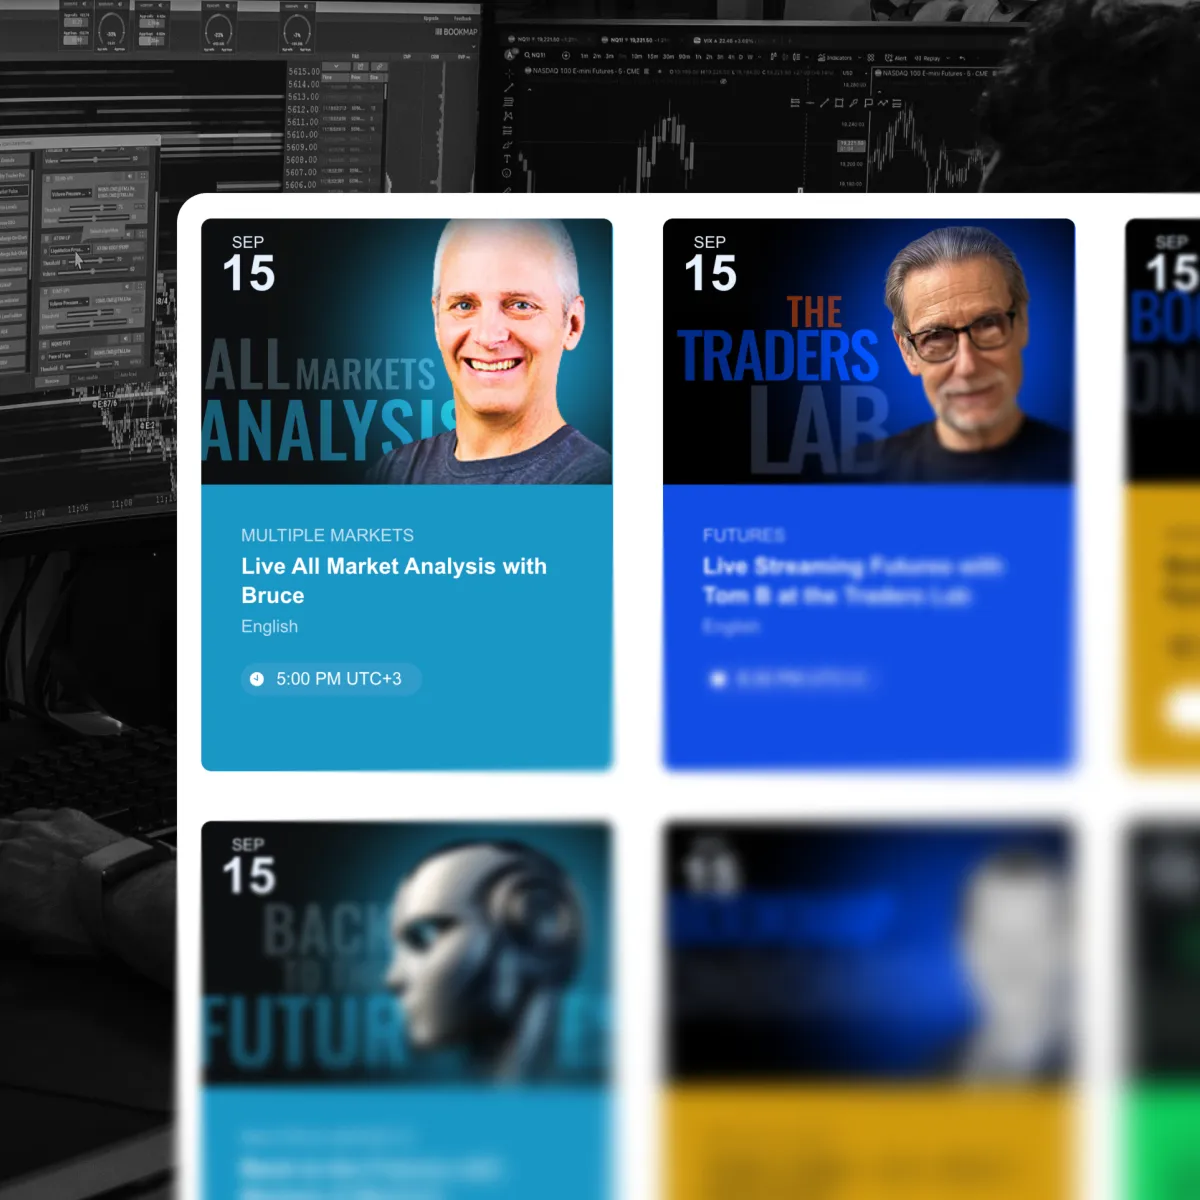
The moment that actually got him to commit to learning the platform wasn’t a feature. It was a webinar from Bruce, built around a simple, blunt premise: most traders don’t have an edge, and don’t know how to find one.
“Before attending Bruce’s webinar I was fooling around, wasting time and money, and taking random trades because I didn’t know how to find the edge.”
– Power User Z
That webinar is what pushed him to join the Bruce Pilot Program and actually learn the platform properly, rather than treating it as another chart overlay. He now keeps Bookmap open for reference before taking or exiting almost every trade.
Of the platform’s individual features, he singles out the volume bubbles as the ones that matter most day to day. The heatmap and liquidity bands are there too, along with the sitting-order skews that repel price and the absorption and exhaustion patterns that show up when price refuses to move due to a lack of participation. But it’s the bubbles, in his account, that decide direction and speed.
Building an Edge Around Liquidity
The core insight Power User Z pulled from the heatmap is straightforward: sitting orders, liquidity bands, passive accumulation, whatever name you use, are clearly visible there, and the common-sense play is to place a take-profit just ahead of major liquidity and a stop-loss just beyond it.
His named setup is a reversal pattern he calls Trendline Break Accumulation, or TLBA, a pattern taught in the Bruce Pilot Program with a four-trigger checklist from coaches Bruce and Laura. He’s shared dozens of trade analyses built around this exact setup on social media.
“There are so many factors involved, not just price action, not just candlestick patterns, not only volume profile, and they are not enough on their own to predict the market. The DOM ladder changes every second, and Bookmap adds a 4th and 5th dimension by bringing price, liquidity, volume, and speed together.”
– Power User Z
That was the misconception order flow corrected for him directly: no single input, price action, candles, or volume profile alone, was ever going to be enough. It took seeing all of them together, updating in real time, to make the picture usable.
Trade Breakdown: A Reversal at the Top of the Hour
The trade Power User Z walked through hadn’t been shared anywhere before, not on social media, not in the Discord community. It’s a clean example of the TLBA setup executed live rather than studied from a pre-recorded replay file.
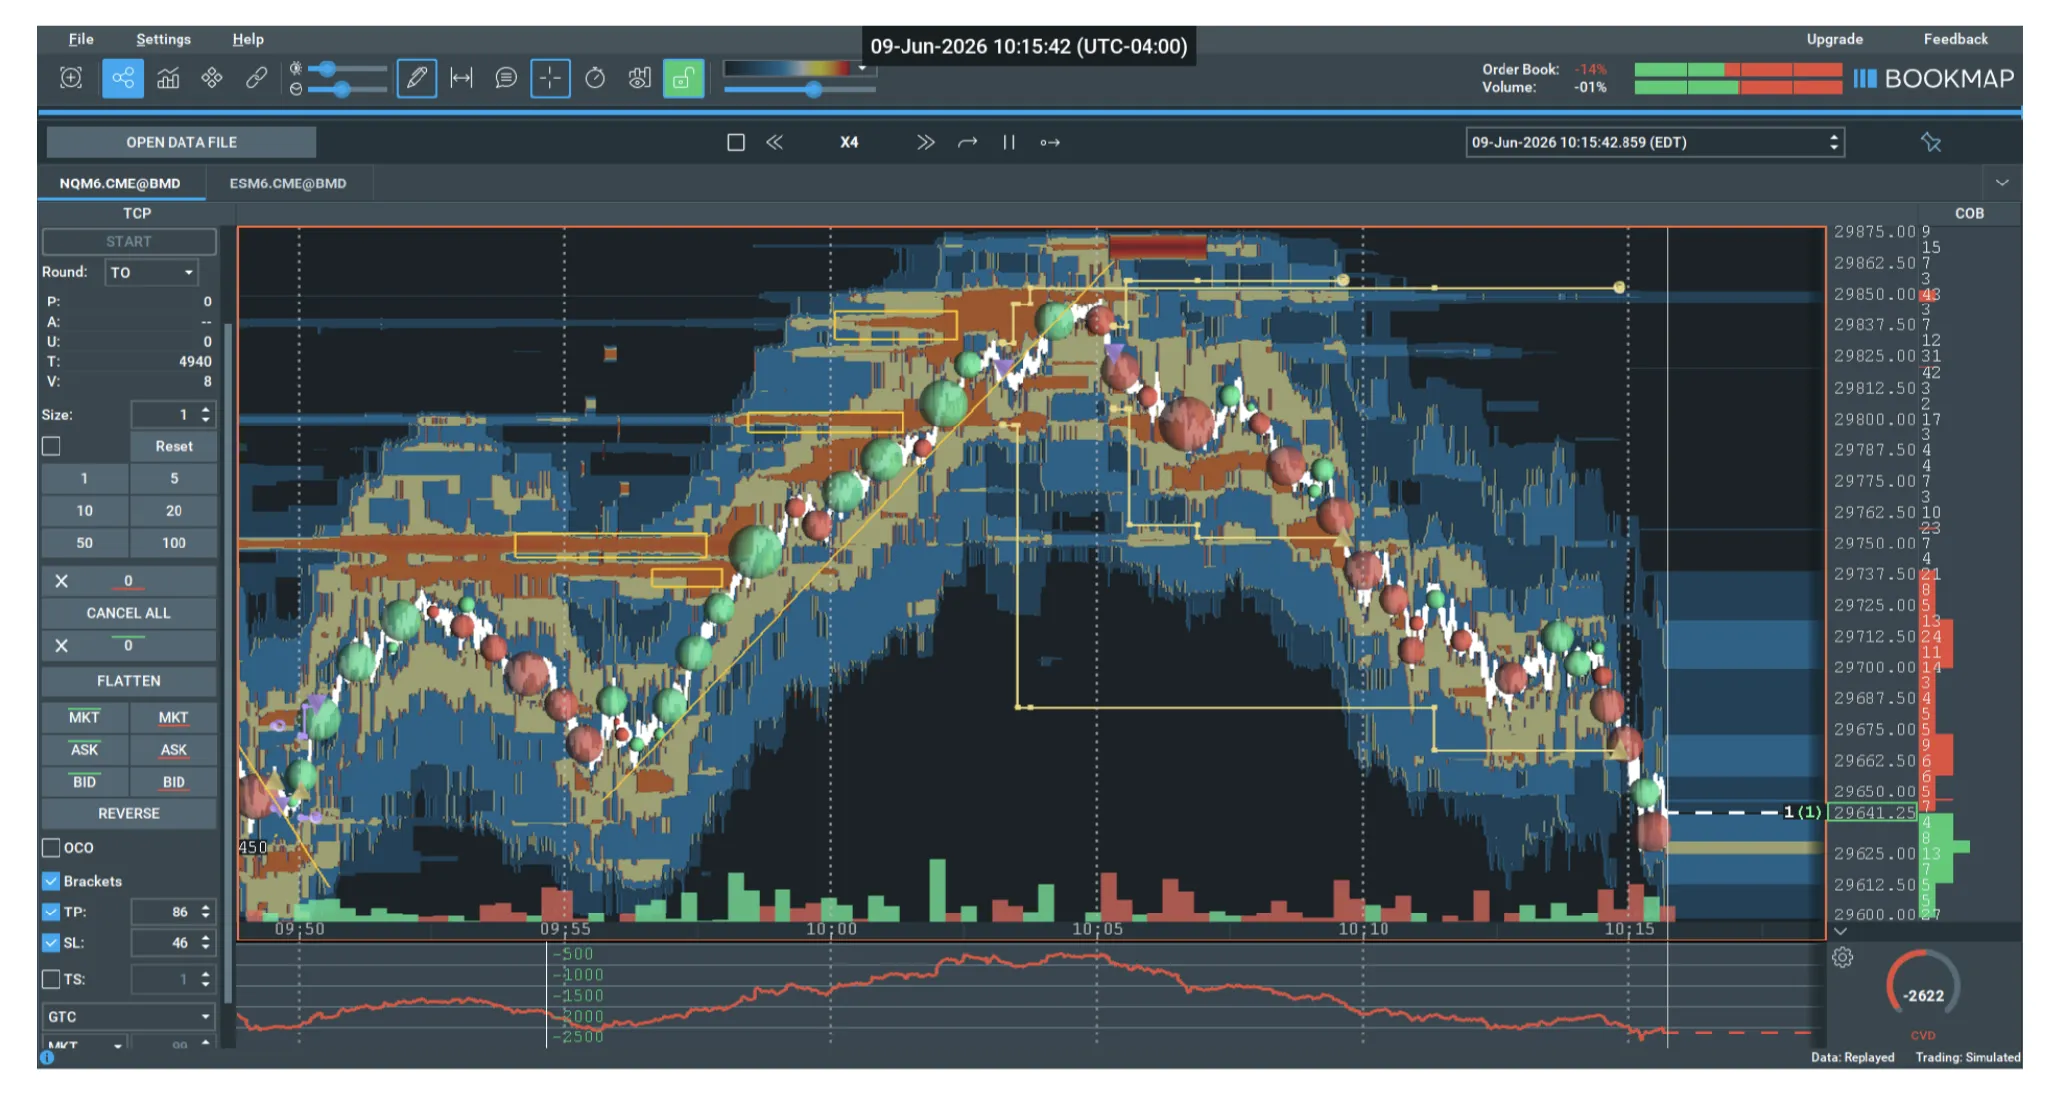
Power User Z’s NQ trade: a large liquidity skew forming just above price at the top of the hour repelled the move and confirmed a short entry, with cumulative volume delta falling through the session.
Going into the top of the hour, he was watching for a change-in-hands opportunity, a possible reversal. Without Bookmap’s heatmap, he’s clear that he either wouldn’t have taken the trade at all, or would have set a stop tight enough to get run over before the move played out.
“There was a large liquidity formed, a skew, at 10:05, just above the price, that repelled it and started the reversal. This confirmed and solidified my trade with another short entry.”
– Power User Z
That skew, a build-up of resting liquidity just above where price was trading, gave him the confidence that participants were defending the level, which pushed him to add to the short. It’s the same TLBA setup taught throughout the Pilot Program, executed here as a live trade rather than a training exercise.
Measuring Progress Differently
Power User Z keeps a full trade log and says he’s seen visible improvement across win rate, risk-to-reward, drawdown, consistency, and, most importantly to him, confidence. He’s candid that he’s still at a learning and experimenting stage, still trying different setups and styles.
He doesn’t track risk-to-reward the conventional way. Instead, he leans on Bookmap’s journal metrics for maximum favorable and adverse excursion, MFE and MAE, which he says gives him a clearer read on trade quality than a simple win/loss ratio.
“I don’t measure R:R, that’s not my style. The Bookmap journal gives you a cooler metric than the profits and RR: MFE and MAE. I liked that a lot.”
– Power User Z
Moving from backtesting to live trading came with its own lesson. Bruce’s guidance was to build and hone the edge first before turning to live markets, but Power User Z admits he gave in to the temptation to size up early, and paid for that impatience. His forward-trading journal, tracked directly through Bookmap over roughly thirty trades, is now built entirely from live executions rather than replay or practice files, and the resulting equity curve is what gave him real confidence in the process for the first time.
A Routine Rebuilt Around Bookmap
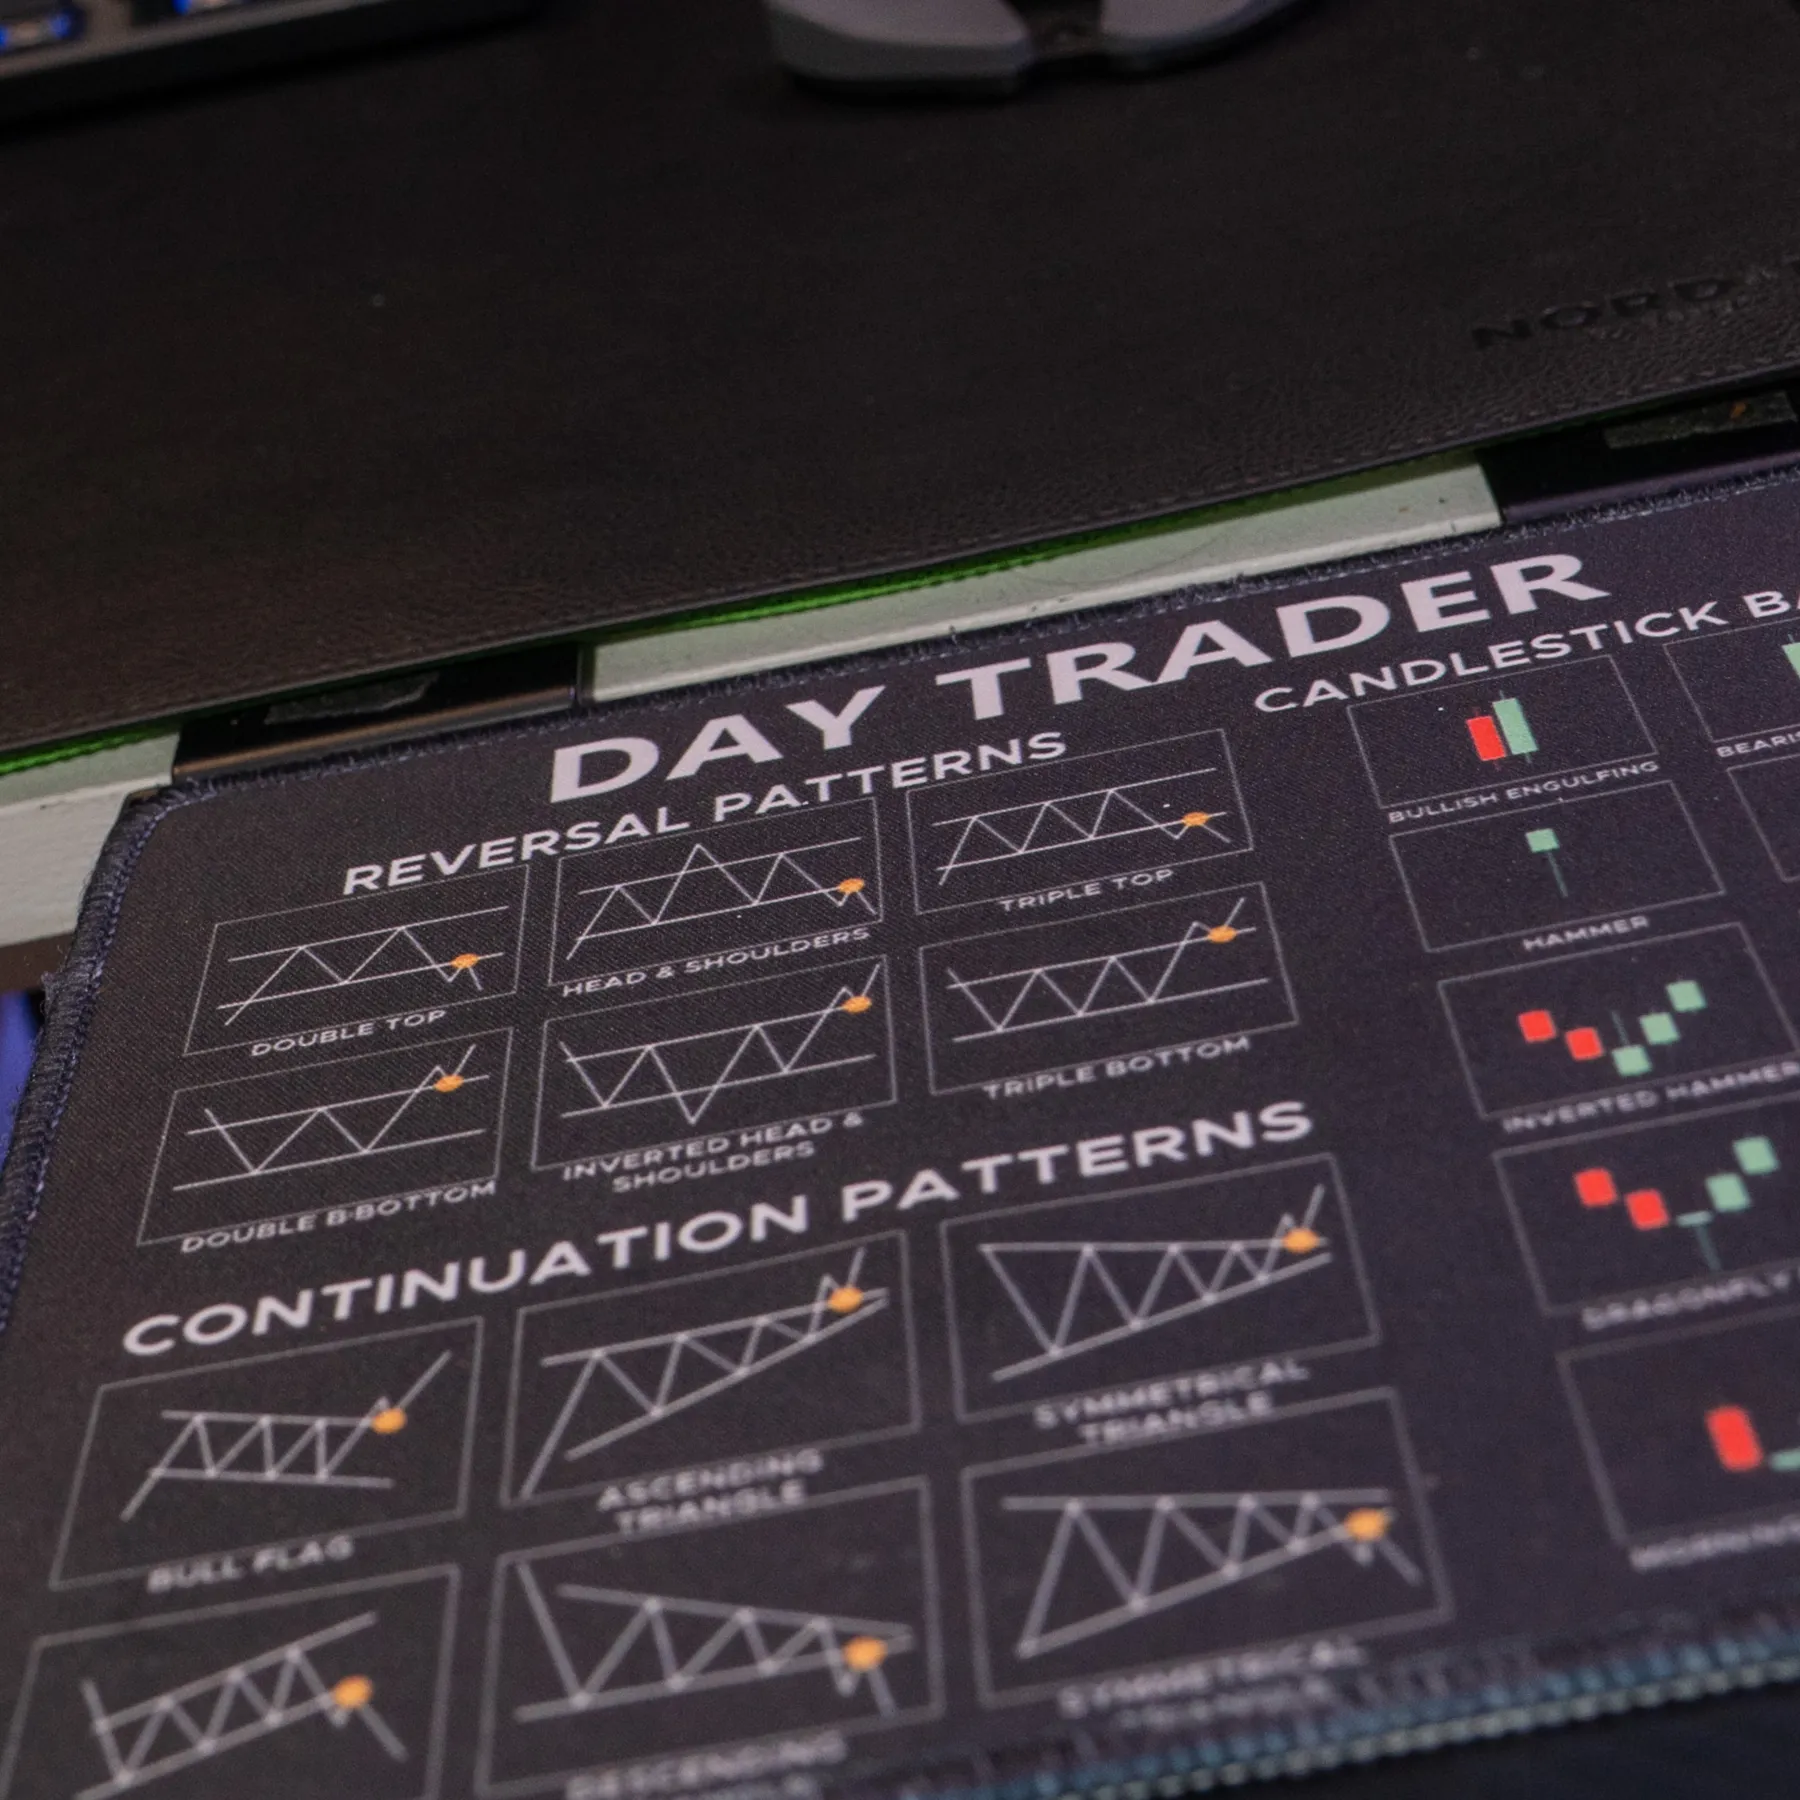
Drawing higher-timeframe levels before the trading day starts has become a fixed ritual that simply didn’t exist in his process before. Bookmap now sits on the center screen of his setup: a full-HD display running fullscreen Bookmap alongside the trade panel, DOM ladder, session volume profile, and higher-timeframe key levels. NinjaTrader stays linked for live execution but sees little use; he takes trades separately through a browser on another display. A third monitor runs Discord chat and whatever livestream or webinar is on.
Pre-market preparation has gotten simpler, not more complex. He doesn’t spend time on fundamental analysis or the broader macro picture. Bookmap is his technical analysis tool, and he loads it well ahead of the New York open specifically to avoid any lag or system load once trading actually starts.
Learning From the Community
Watching how other traders in the Discord community structure their own charts has directly shaped his setup. Seeing a custom notes column for key levels on a coach’s screen, Laura’s, specifically, led him to build his own CSV files of daily levels that now import and mark automatically on his chart.
“Thanks to the community we are learning from each other on Discord, taking inspiration from other traders and getting tips from experts and moderators.”
– Power User Z
Advice for New Traders
Power User Z’s advice centers on one idea: screen time by itself isn’t enough. Posting your own trades, annotating them, and explaining your setups to the community is, in his words, trading homework in its own right.
He’s candid that this took him a while to appreciate. For months, he assumed the Bookmap Academy’s emphasis on posting screenshots and written analysis was aimed at content creators and influencers, and avoided the program on that basis. Joining the Pilot Program changed that view entirely.
“This is not an influencer’s programme. This is for yourself, your analysis, and others share their feedback for free. Don’t shy away or hesitate to participate.”
– Power User Z
- Don’t rely on screen time alone. Post your setups and reasoning so others, and you, can actually see your thinking.
- Expect the pricing structure (subscription, data, add-ons) to take some time to fully understand. That’s normal, not a red flag.
- Track more than win rate. MFE and MAE inside the Bookmap journal reveal more about trade quality than R:R alone.
- Build your edge in practice before sizing up live. The temptation to go big early is real, and costly.
Conclusion
Power User Z’s progress didn’t come from a single feature clicking into place. It came from replacing a habit of taking random trades with a specific, named setup he can explain, defend, and repeat, built through a structured program and reinforced by a community he now credits with shaping how he sets up his own charts.
He’s still learning and still experimenting. But the difference between where he started, watching candlesticks move in ways he couldn’t explain, and where he is now, reading a liquidity skew forming before a reversal and acting on it with confidence, is exactly the kind of edge the program set out to build.
Sign Up Now
Latest Articles