See time frame more clearly in real time.
Compare plans to access deeper market visibility for time frame.
Education
December 26, 2025
SHARE
How to Use Multi-Time-Frame Context in Order Flow Trading
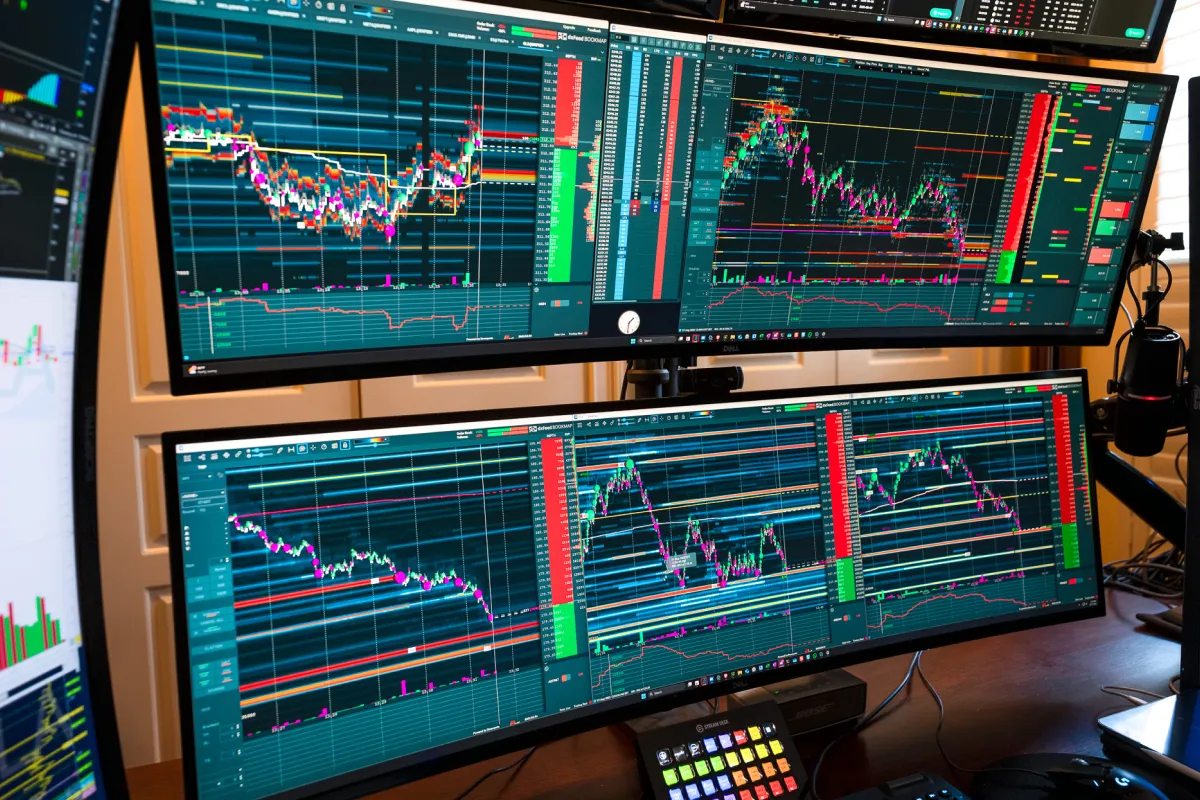
Every trader has experienced it. A trade seems flawless on a short-term chart, but then fails in seconds. Why? Because the higher-time-frame context wasn’t in agreement. In trading, order flow analysis doesn’t work in isolation. Instead, it exists in layers.
Big participants or institutions influence the market based on broader trends and major liquidity zones. In contrast, smaller traders respond to short-term price moves within those levels. Now, for retail traders like you, the challenge is connecting the two. You must understand how micro-level activity fits into the larger market structure. That’s where multi-time frame analysis trading comes in. By studying multiple time frames, you can gain a broader perspective and align your entries with the direction of the market’s strongest players.
Read this article to learn how to read context and spot setups with true edge. Additionally, you will learn how to utilize tools like Bookmap to connect short-term order flow to macro-level intent. Let’s begin.
What Multi-Time-Frame Context Really Means
Most traders think multi-time frame analysis trading just means checking a “higher chart” to confirm direction. But real context goes much deeper! Let’s understand its true meaning:
The 3 Major Types of Contexts
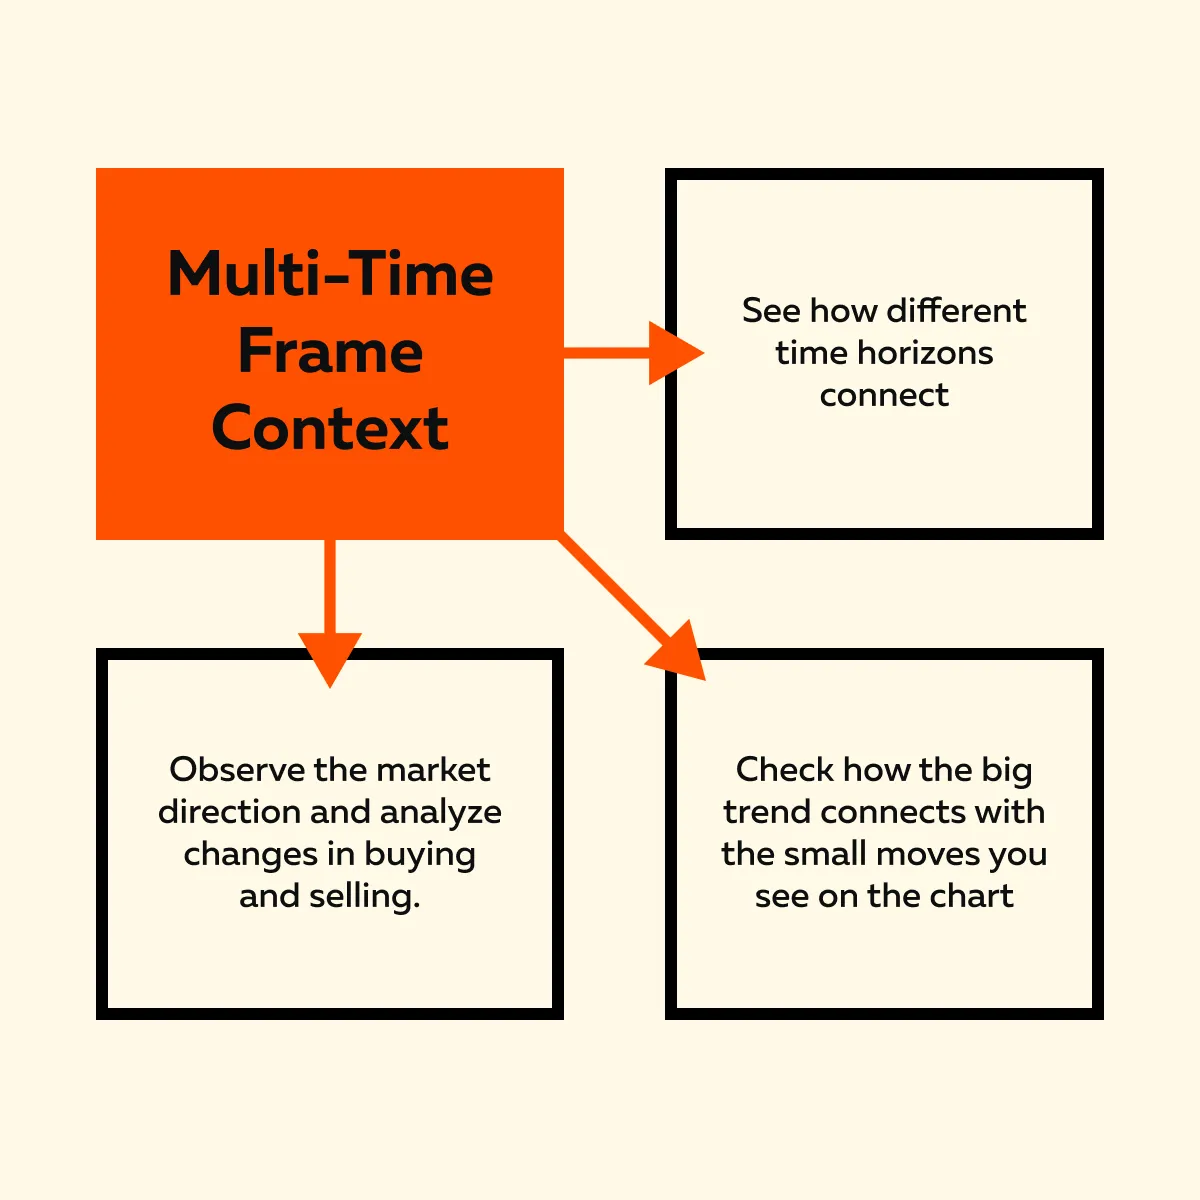
Multi-time frame analysis trading involves aligning structure and execution across various time horizons. While doing this analysis, you’re essentially reading how the broader market intent drives the smaller price moves you trade. Below are three main types of contexts you must observe:
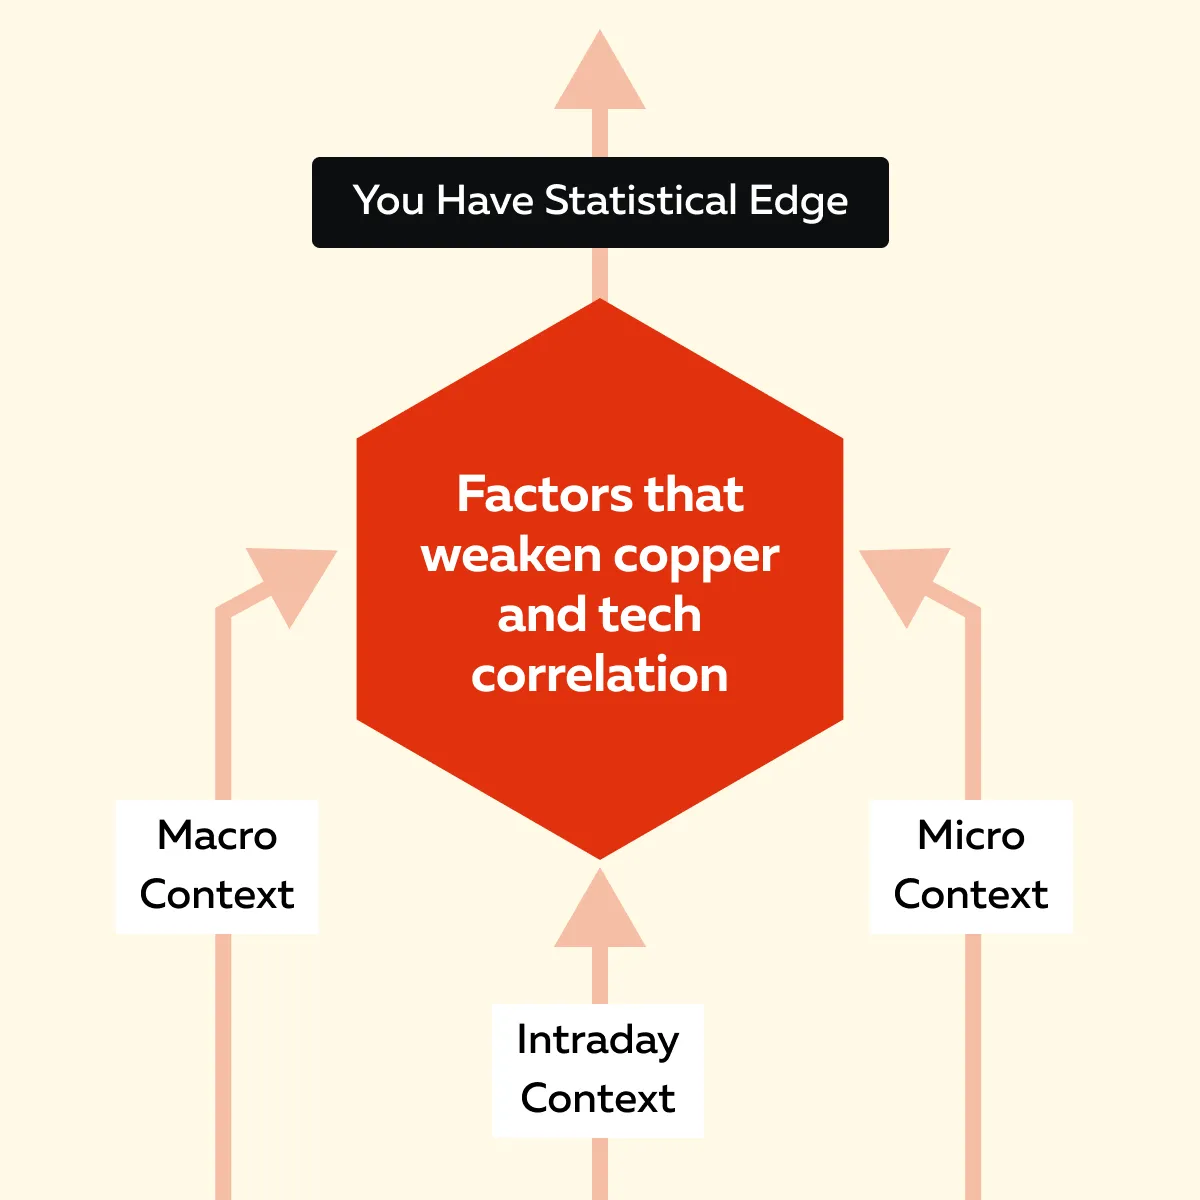
I) Macro Context
It shows the bigger story. Its analysis shows you:
- Where large institutions have positioned themselves,
- Where major liquidity zones exist, and
- What broader trend or sentiment dominates?
For example, as Tom B. explained in the Trader Lab session, higher time frames, such as the NASDAQ’s RTH profiles, allow traders to identify whether the price is in a “too high,” “too low,” or “fair value” zone.
II) Intraday Context
This context focuses on the developing structure of the day. It looks at:
- Whether the market is balanced or trending,
- How value areas shift, and
- Where traders accept or reject the price.
This layer indicates whether today’s auction is showing strength, neutrality, or imbalance.
III) Micro Context
It is the execution layer, where you watch:
- Real-time order flow,
- Absorption, and
- Traps.
To make this easier, several traders utilize real-time market analysis tools, such as Bookmap, to thoroughly examine the market context. Using Bookmap, you can visualize iceberg orders or stop runs that can confirm or invalidate your trade setups.
Always remember that each layer of context influences the others. When the macro, intraday, and micro contexts all point in the same direction, you gain a statistical edge in your trades. However, when these contexts conflict (for example, a short setup on the 1-minute chart transitions directly into a higher-time-frame support area), the trade loses its edge even if it appears technically perfect.
Why Context Determines Validity
In multi-time frame analysis trading, context is what gives true meaning to what you see on the chart. A single signal, whether it’s absorption or a large order cluster, holds little weight on its own. That’s because a signal only matters if it agrees with the bigger trend and surrounding liquidity.
For example, as Tom B. explained in the Trader Lab session, an absorption zone might look powerful on the order flow chart, but its true meaning changes with the larger trend. Let’s see how:
| Absorption At Lows Within A Daily Uptrend | Absorption At Highs Within A Daily Downtrend |
|
|
On Bookmap’s heatmap or chart, both events may look identical. They may have the same colors and patterns, but their context is what makes them distinct. One event could signal a high-probability continuation, while the other could be a trap for unwary traders.
That’s why traders who rely only on isolated signals often get caught fading strong trends. The same absorption pattern can suggest opposite outcomes depending on the:
- Time frame
and
- Surrounding liquidity.
See how higher-time-frame context shapes lower-time-frame opportunities → Compare Packages.
How to Build a Multi-Time-Frame Routine
When you follow a good “multi-time frame analysis trading routine,” you can link the overall market trend with your exact trade entry and exit. Instead of guessing, you follow a repeatable process that keeps your bias and entries aligned. Want to build this routine? Let’s see how you can do it step by step:
Step I: Start with the Macro View
Begin on the daily or 4-hour chart. This is where you can identify the following:
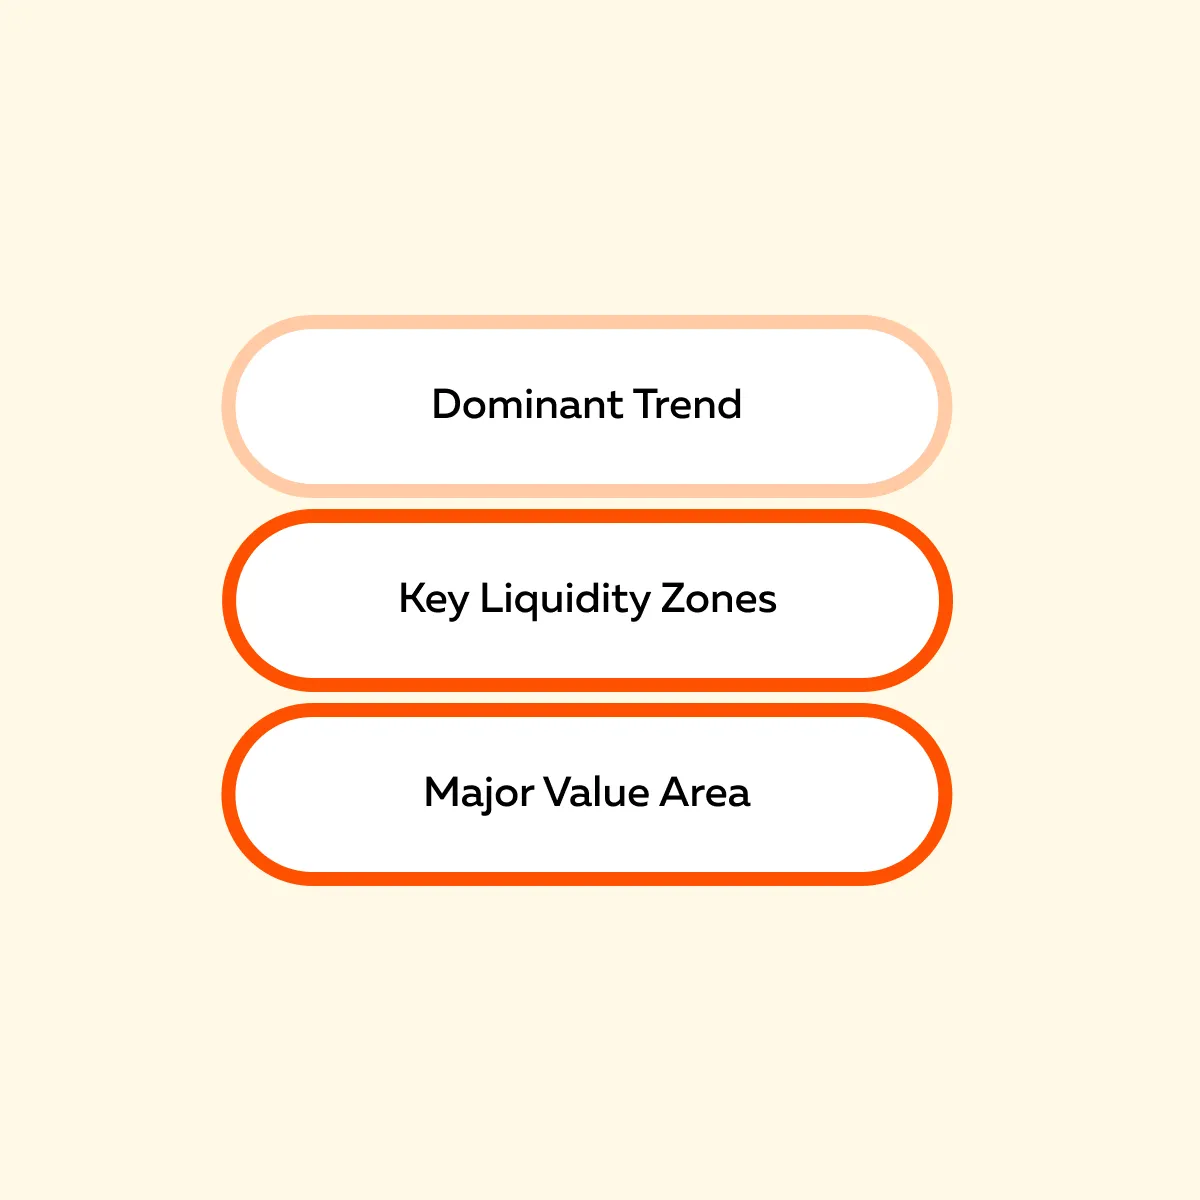
As Tom B. also mentioned in the Trader Lab session, this step allows you to see whether the market is trading near “too high,” “too low,” or “fair price” zones. Combine short-term precision with long-term structure → Compare Plans.
Step II: Move to the Intraday Context
Analyze how the current trading session is developing. Find the answer to this question: Is the market trending, balanced, or rotating between extremes? Be aware that intraday profiles show:
- How price areas change during the day
and
- Where most trading activity happens.
This knowledge allows you to spot whether today’s flow supports or contradicts the macro direction.
Step III: Zoom In to the Micro Level
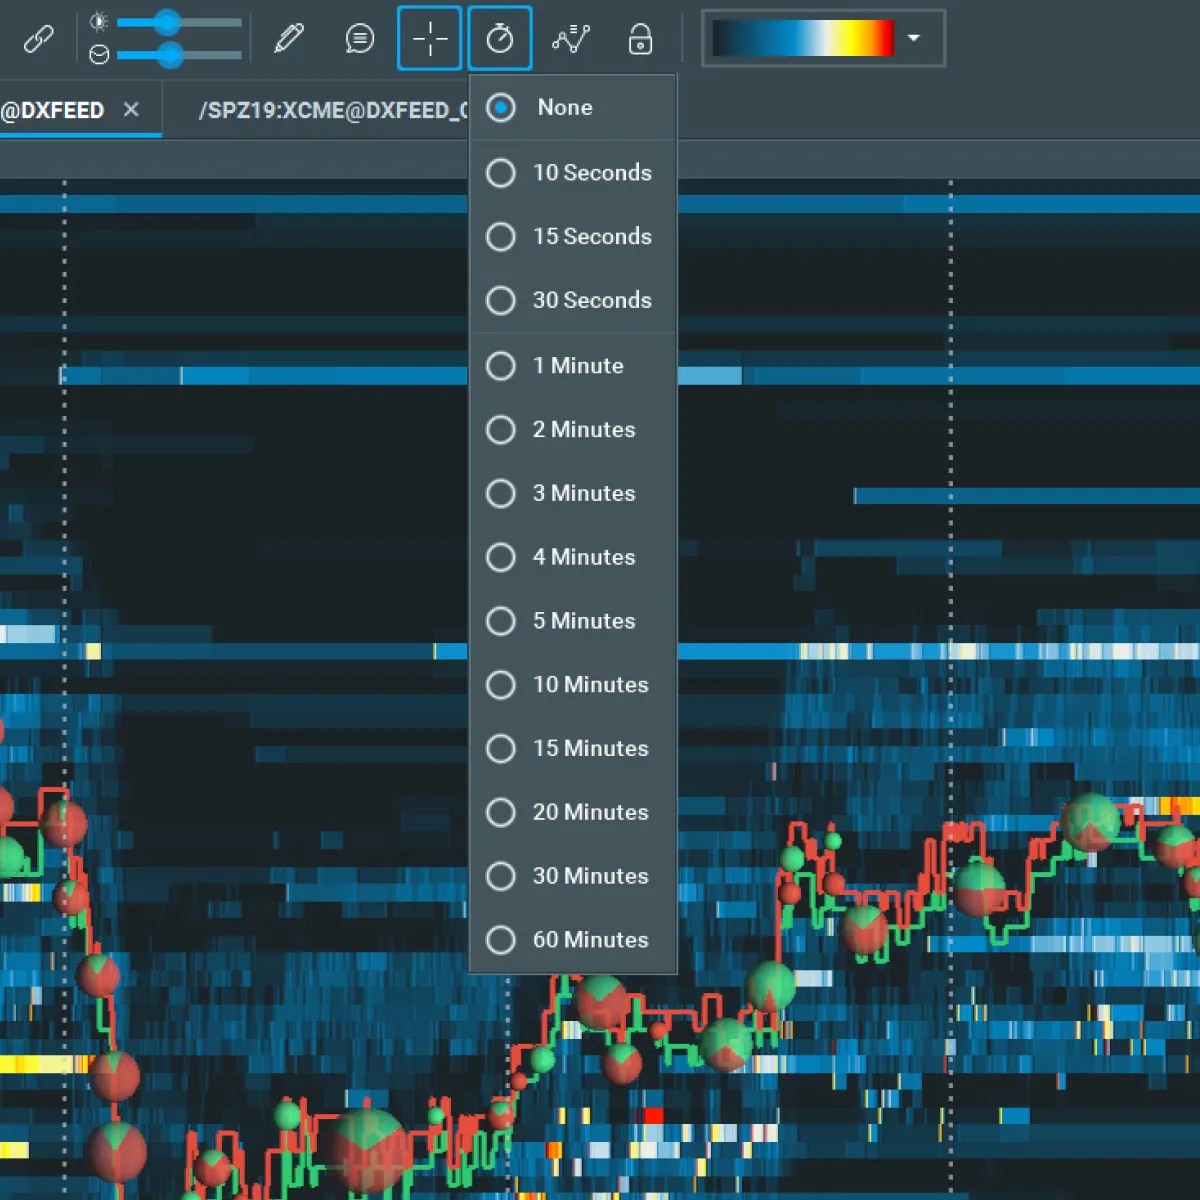
Finally, go to your execution layer. This is where order flow and Bookmap come in. In this step, you must use Bookmap and watch for these signs:
- Absorption,
- Volume bursts,
- Iceberg orders, and
- Liquidity changes.
All these signs confirm what the bigger trend or higher-time-frame bias is already showing.
Step IV: Validate Alignment Before Trading
Lastly, you should only trade when the micro signals match the bigger picture. For example,
- Let’s say the daily context is bullish.
- Now, wait for intraday pullbacks that indicate buying absorption on Bookmap.
- These are continuation setups or safe trades that follow the main trend.
- Be aware that these are not risky shorts against the trend.
When you apply this top-down process, multi-time frame analysis trading becomes a clear routine. You start to see the macro story and understand the session context. Also, you receive “execution signals” that provide your trades with both structure and statistical edge.
Align your order flow view across time frames → Compare Packages.
When Time Frames Conflict
In multi-time frame analysis trading, knowing when not to trade is just as important as knowing when to act. Sometimes, different time frames send mixed messages. When this happens, it’s not just confusion but a clear warning sign to stay patient. For example,
- Suppose you see a bullish structure on the higher time frame.
- Simultaneously, there’s a bearish order flow on the lower chart.
It can feel tempting to trade anyway, but that’s where many traders lose their edge! Okay, so what do professional traders do? They don’t take trades when signals are in conflict. Instead, they wait until all the layers point in the same direction.
Below are three common signs of time-frame conflict that you must avoid:
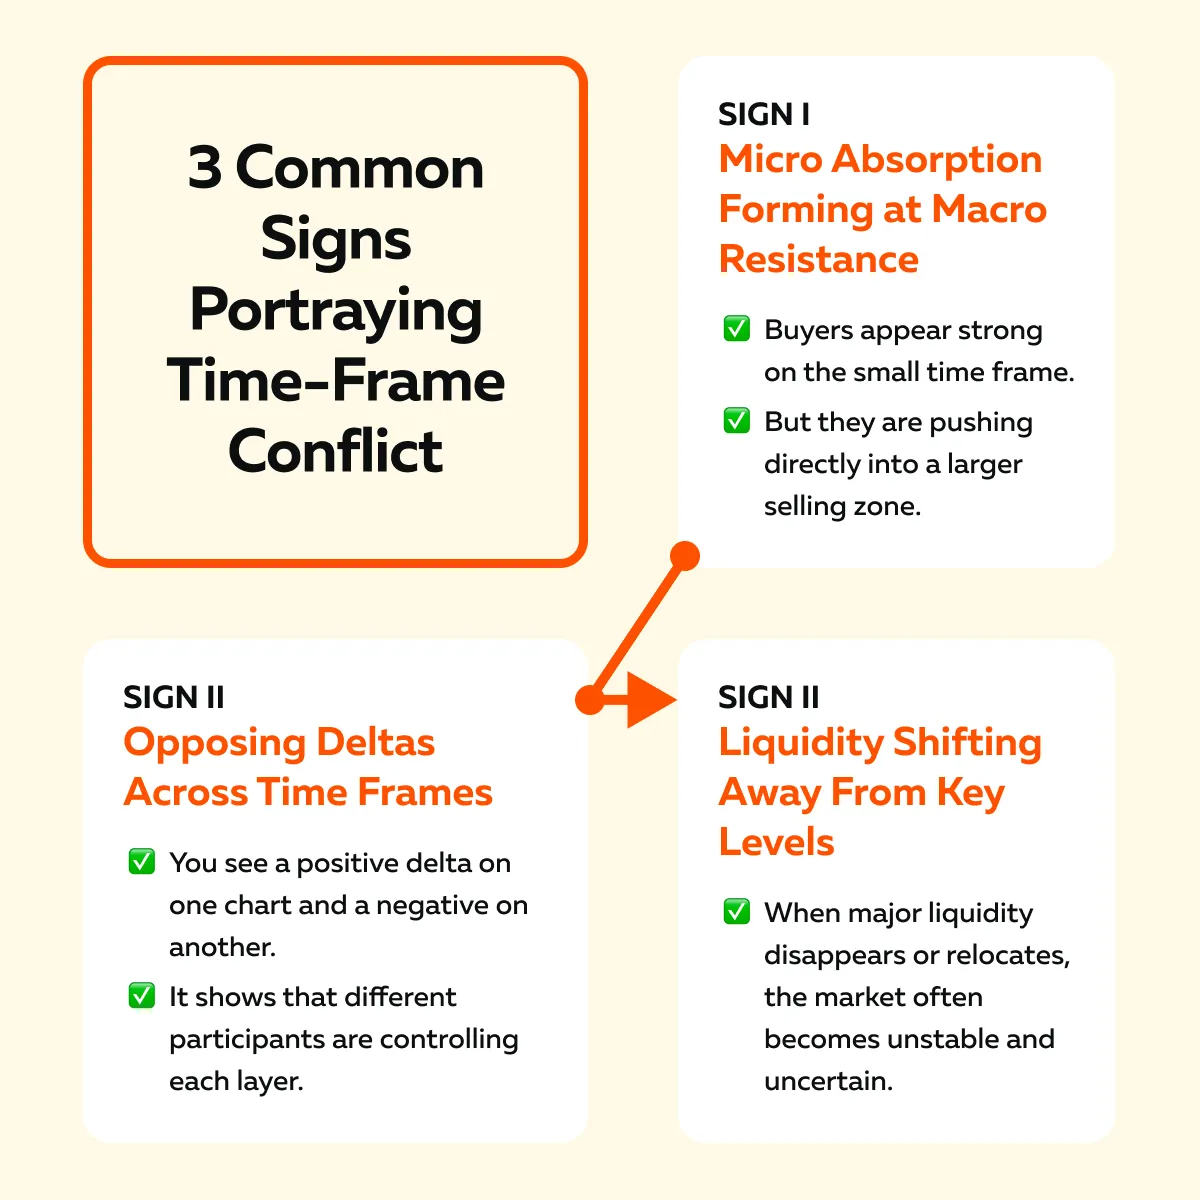
This period is often referred to as a “probability drag”. During this period, setups may appear valid on paper but fail because the broader flow doesn’t align. In these moments, standing aside protects both your capital and your mental clarity.
So, what lesson did you learn? In multi-time frame analysis trading, you only take a trade when the big picture (macro), the day’s structure (intraday), and the small order movements (micro) all agree. This way, your trade is backed by the full market context, and your chances of success increase significantly.
Case Study: Intraday Short Within a Macro Downtrend
To gain more clarity, let’s see how multi-time frame analysis trading works through an example. Let’s say you are watching the S&P E-mini (ES). You observe these three contexts:
| Macro Context | Intraday Context | Micro Context |
|
|
|
Now, once all these layers line up, you take a short position after seeing confirmation of continuation. This kind of alignment is what Tom B. emphasized in the Trader Lab session. In this trading style, the trader isn’t reacting emotionally to a small move. Instead, they’re executing within structure, where risk and targets make sense.
Conclusion
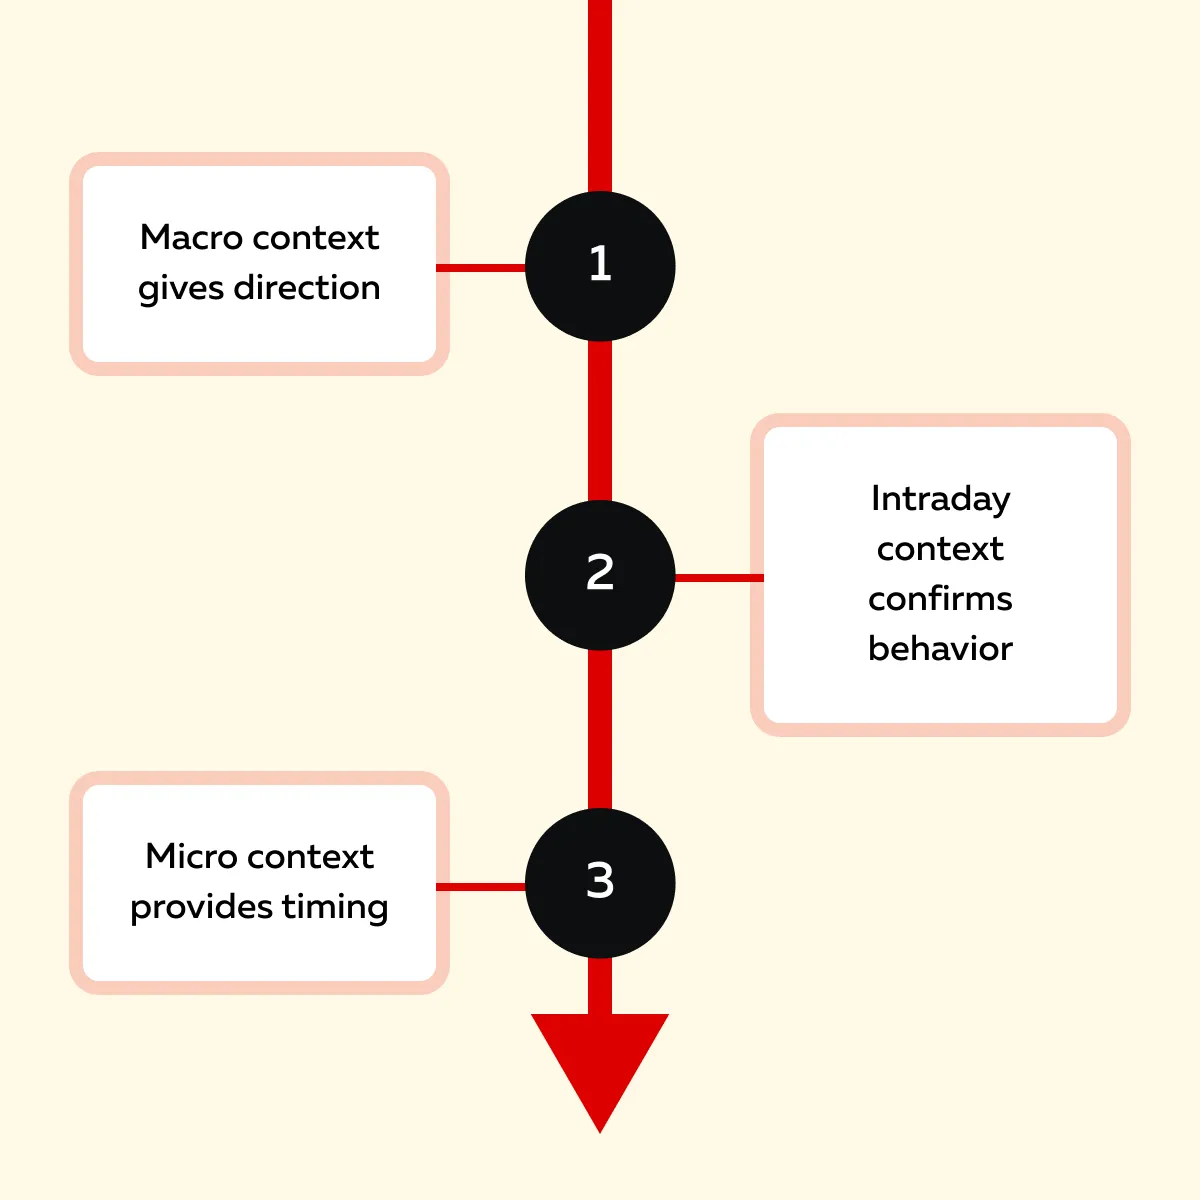
By now, you completely understand that order flow is one of the most powerful tools in trading, but only when viewed in the right context! The best traders use multi-time frame analysis trading like a map:
- The higher time frame shows the destination
and
- The lower time frame pinpoints the exact entry.
Furthermore, when you connect macro structure with micro timing, every setup becomes logical instead of random. Also, you’re no longer reacting to noise. So, what’s the final takeaway? Always start with context and wait for alignment. Lastly, act with confidence.
To get precise order flow insights and professional-grade visualizations, you can start using Bookmap. It is an advanced platform specifically designed to let traders see liquidity, absorption, and market intent in real time. See how Bookmap helps connect higher-time-frame structure with real-time execution → Compare Packages.
FAQs
1. What is multi-time-frame analysis in trading?
Multi-time-frame analysis trading means studying the market from several perspectives, such as:
- Daily,
- Intraday, and
- Micro levels.
This allows you to see how they connect. The higher time frames show the main direction or bias, while the smaller time frames show entry and exit points. When traders look at the market in layers, they can follow the main trend instead of reacting to small and confusing price movements.
2. Why is multi-time-frame context important in order flow?
Order flow on its own can be misleading. Why? The same absorption or delta signal can mean different things depending on where it happens. A multi-time-frame context allows you to interpret that signal correctly.
You can see how short-term order flow fits into the larger trend or structure. When you have this knowledge, you can avoid taking trades against major liquidity zones or strong directional bias.
3. How can I align different time frames effectively?
You can start by identifying the trend and key levels on a higher chart (such as daily or 4-hour) to establish your directional bias. Next, move to the intraday level to examine how the session is progressing.
Finally, use Bookmap at the micro level and try to confirm entries with real-time order flow data. In this analysis, look for these signs:
- Absorption,
- Volume bursts, and
- Liquidity shifts.
4. Can Bookmap help connect multiple time frames?
Yes, Bookmap is specifically built for this kind of analysis. It allows you to:
- Visualize micro-level order flow, such as liquidity and delta
and
- Mark higher-time-frame reference levels like support, resistance, or value areas
Bookmap enables you to clearly see how small and short-term price changes fit into the broader market trend. In this way, your trading decisions are consistent and based on the full picture.
Sign Up Now