See spread more clearly in real time.
Compare plans to access deeper market visibility for spread.
Education
January 22, 2026
SHARE
How Spread Behavior Reveals Market Uncertainty

Every second, the bid-ask spread tells a story! Think of it as the market’s heartbeat, as it tells you about who’s confident, who’s cautious, and how much conviction the market really has. When spreads are tight, it shows that traders are aligned, and liquidity is flowing smoothly. In contrast, when they widen, that’s often a sign of tension or uncertainty.
But have you ever paid attention to spread behavior? If your answer is a NO, this article is a must-read. You’ll learn how to read spread behavior, what makes it tighten or widen, and how it reflects market uncertainty. Also, you will understand how tools like Bookmap turn these invisible patterns into visual insights, allowing you to read the market’s pulse in real time.
What Is the Spread and Why Does It Matter?
The spread in trading is simply the difference between the:
- Bid price (what buyers are willing to pay)
and
- Ask price (what sellers want).
Commonly, this difference is called the “bid-ask spread”.
When the spread is tight (say, just one tick), it means buyers and sellers mostly agree on price. Usually, traders interpret this as a sign of confidence and adequate liquidity. On the other hand, a wide spread means traders are uncertain or cautious. It often happens when participants suddenly reassess risk, such as during breaking news or big price swings.
The Spread Behavior Reveals Market Health
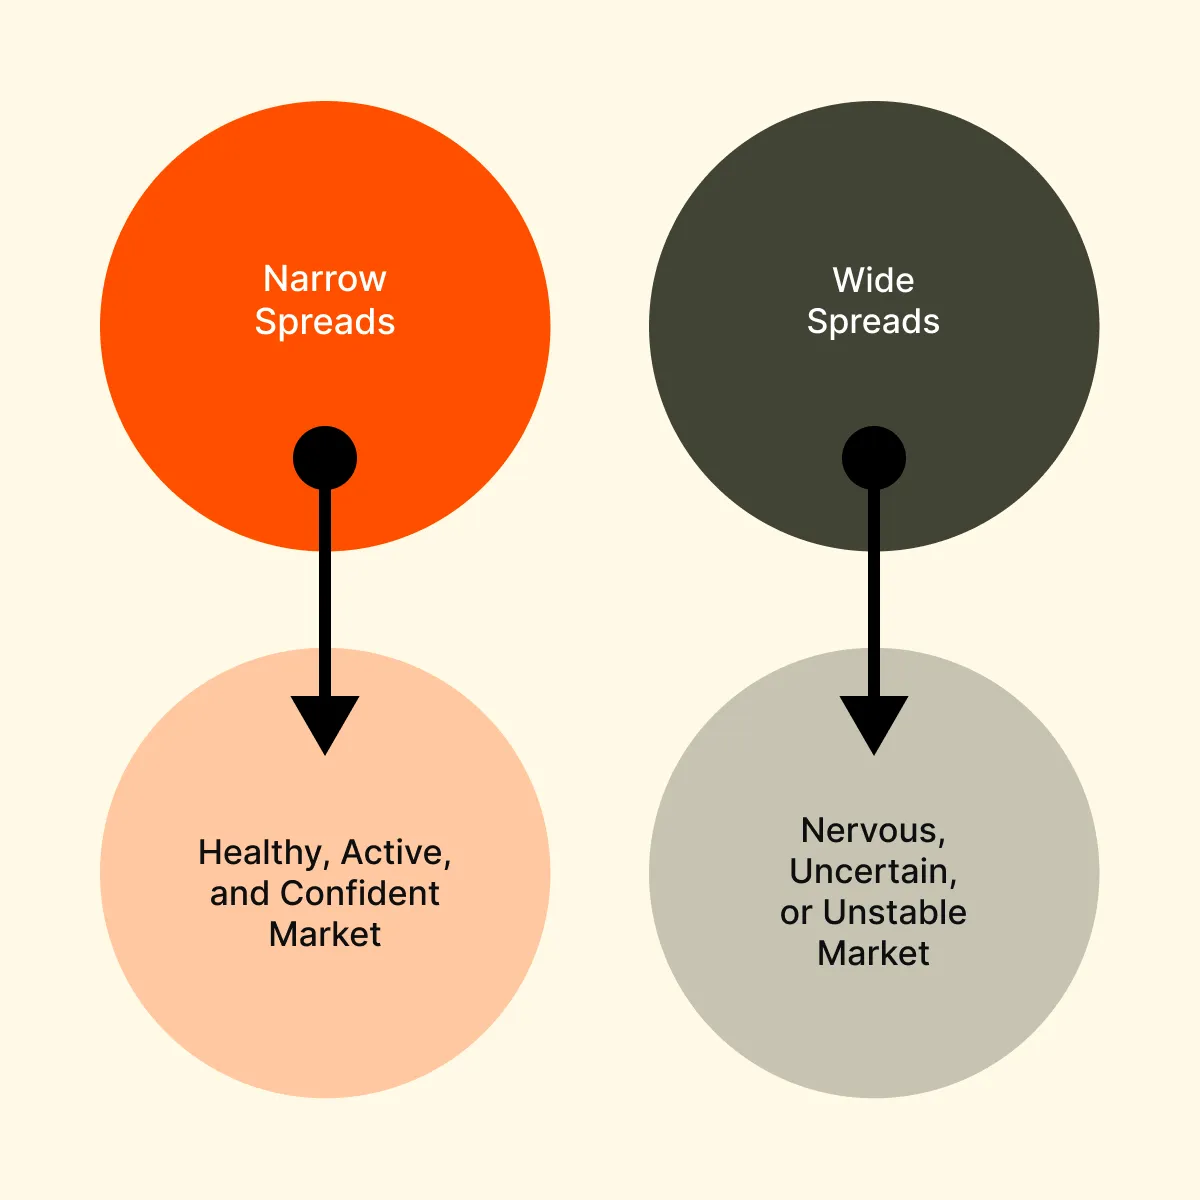
When the market is stable and liquid, there are plenty of buy and sell orders sitting close together in the order book. This strong activity keeps the bid-ask spread narrow and shows that traders agree on price and are confident to trade.
However, when there’s market uncertainty—like before major news, or during sudden volatility—market makers and other traders often:
- Pull their orders
or
- Reprice them farther away to reduce risk.
This creates a wider spread, making it more expensive to trade. Also, it signals hesitation or caution in the market.
What Causes Spreads to Widen or Tighten?
The spread behavior in trading, whether it’s tight or wide, changes constantly. This variation hinges on dynamics within the order book and the prevailing market uncertainty. Let’s understand these concepts in detail:
Spread Tightening
Usually, when there’s plenty of liquidity, with numerous buy and sell orders present, the bid-ask spread stays tight as there’s competition on both sides. In such an environment:
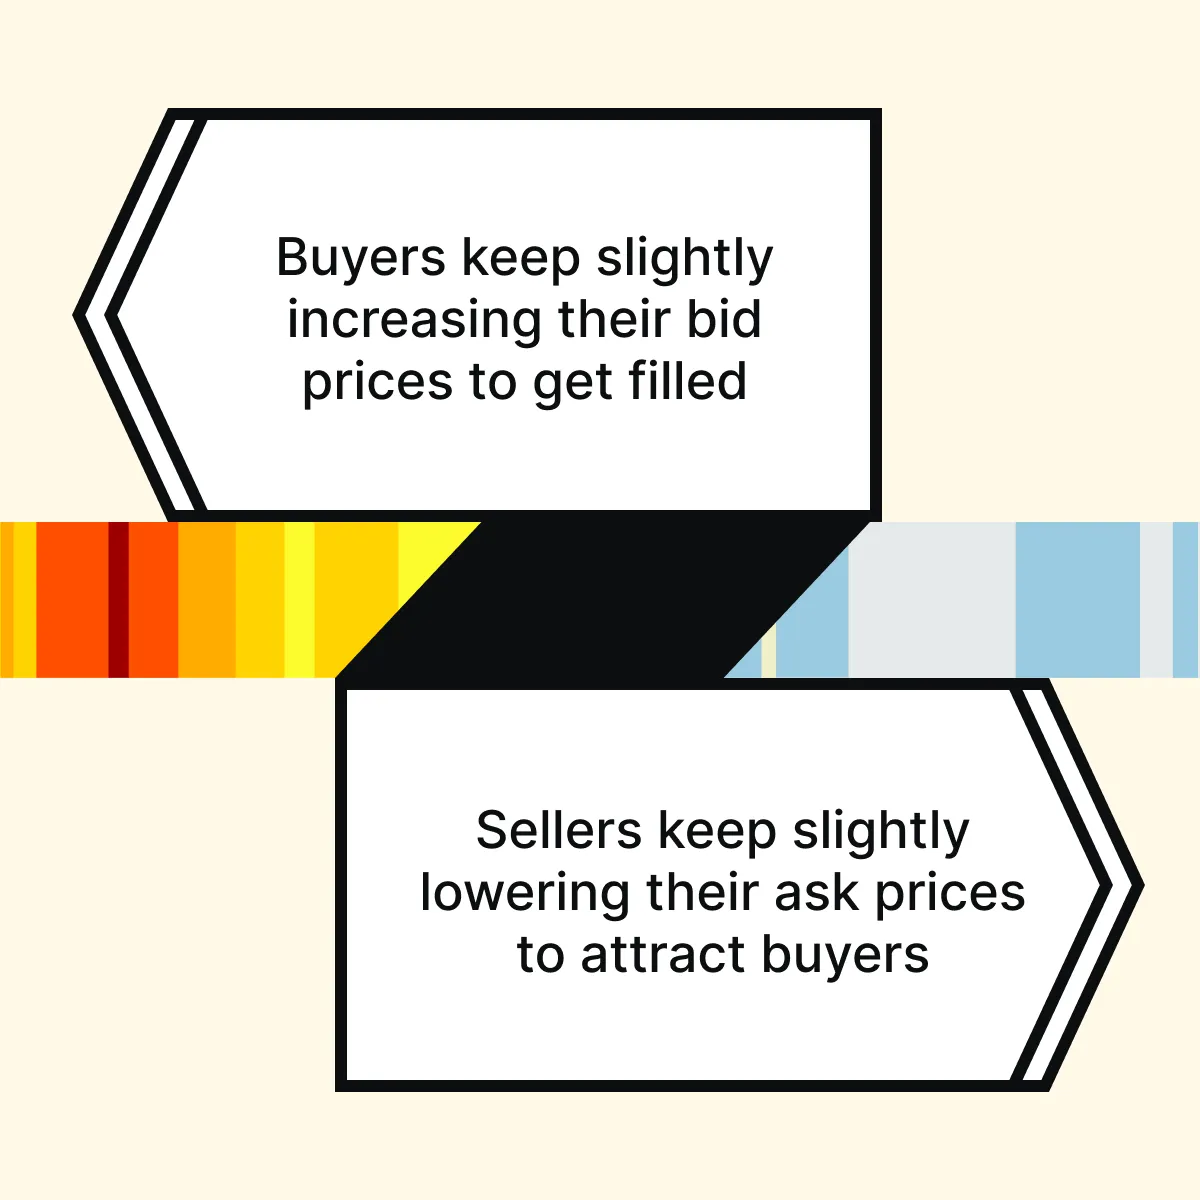
As a result, the gap between the bid and ask prices, called the spread, becomes tight or very small.
Spread Widening
Spreads often widen before major events like:
- Earnings reports,
- CPI data releases, or
- FOMC announcements.
This happens because participants usually reduce their risk exposure prior to these events. During these periods, one group of traders, such as buyers, may aggressively start hitting every available sell order, while the other side, in this case, sellers, pulls back and stops offering prices. As a result, a temporary imbalance forms and the bid-ask spread widens.
The Role of Fragmentation or Latency
In markets like crypto or high-speed stocks, trading happens simultaneously across multiple platforms. Sometimes, this environment introduces two critical factors affecting spread behavior:
- Latency: Prices don’t update everywhere at the same time, causing temporary delays.
- Fragmentation: Orders are spread across different exchanges, adding complexity to liquidity assessment.
Because of these factors, the bid-ask spread can look wider for a few seconds even though the market is still active. Also, some traders use hidden or iceberg orders that don’t fully show up in the order book. This hidden liquidity can cause the market to appear empty or weak (with a wide spread), but in reality, there’s invisible liquidity waiting.
So, wide spreads aren’t always bad! Sometimes it’s just temporary and is caused by tech delays or hidden orders, and not by a real weakness in the market. Track spread dynamics and liquidity changes with Bookmap’s heatmap.
How Spread Behavior Reflects Market Uncertainty
The way the bid-ask spread fluctuates tells you about how confident or nervous traders are. It has been commonly observed that during periods of market uncertainty, such as ahead of major news releases, the spread behavior changes noticeably.
Let’s understand in detail how you can interpret this changing spread behavior:
Wide Spreads Mean Participants Are Unsure
A widening spread typically indicates traders are unsure about what happens next. Thus, market makers and passive traders often retract their liquidity. This makes it more expensive to buy or sell because of fewer active quotes.
Now, this liquidity pulling often happens before major events like news releases or breakouts, as participants wait for clarity. What do you, as a trader, must see?
- Let’s say the spread stays wide, but the price doesn’t move.
- It means the market is cautious and not committed to any direction yet.
Spread as a Leading Indicator of a Shift
The spread behavior can hint at what’s coming next. Let’s understand this via two cases:
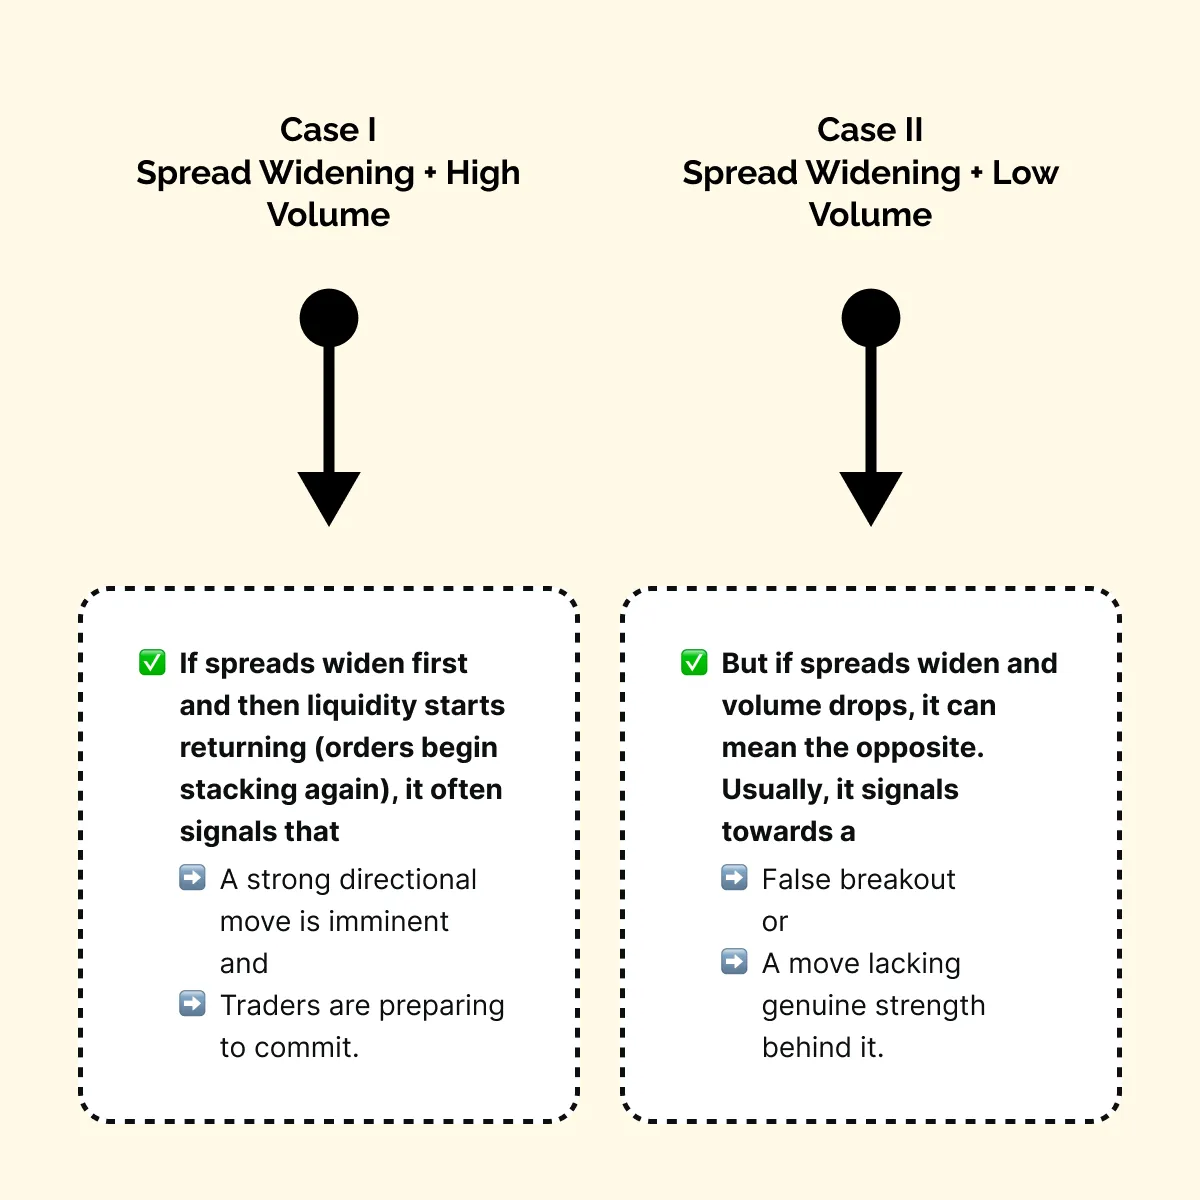
In this way, by watching how spreads and liquidity behave together, you can distinguish moves that have conviction from those likely to fade.
Some Real-World Examples
Example I: Before or just after big macro events like the FOMC or Non-Farm Payroll (NFP) releases:
- Spreads usually widen
and
- The order book thins out, even if prices haven’t moved yet.
This shows that traders are waiting for confirmation before stepping in again.
Example II: Similarly, after a stop run, when many traders are forced out of their positions, the spread often widens briefly. This happens as the market rebuilds balance and confidence. Once traders return, spreads tighten again, which signifies restored market stability.
Interpreting Spread Behavior with Bookmap

Bookmap is a sophisticated market analysis tool. Using it, you can literally see the spread behavior in action. The platform shows the bid and ask as dots on the chart in real time. And the space between them represents the bid-ask spread. By observing how this space changes, you can understand the modifications in both the order book and market uncertainty.
Let’s see how different spread behaviors look on Bookmap and what they mean during various setups:
| Setup Type | How the Spread Behaves (on Bookmap) | How to Interpret it? | What Can You Do as a Trader? |
| Breakout Trades |
and
|
|
|
| Fakeouts |
|
|
|
| Absorption |
|
|
|
So, on Bookmap, you can observe:
- How the bid-ask spread expands or contracts
and
- How liquidity dots appear or disappear around key levels.
See how Bookmap visualizes spread shifts and market depth in real time.
Some Useful Tells to Watch For:
To further enhance your trading accuracy and anticipate potential moves, you can watch for these market signs:
1. Spread Widens While Price Pauses = Possible Breakout or Reversal
When the bid-ask spread gets wider, but the price stops moving, it means traders are hesitating. As a result, market makers may withdraw their liquidity, and both sides await clarity. This tension often builds right before a breakout or a reversal. Once one side gains confidence, the price usually breaks out sharply in that direction.
2. Spread Narrows and Volume Builds = Likely Continuation
When the spread tightens and trading volume increases, it indicates that both buyers and sellers are active and confident. It shows that:
- Liquidity is strong
and
- Trades are flowing smoothly.
This usually happens during healthy trends. It suggests that the current move still has energy and is likely to continue in the same direction.
3. Spread Turns Erratic and Wide With No Follow-Through = Avoid Trades
Sometimes the spread is widening and narrowing randomly, while the price remains largely stagnant. It’s a warning! It shows the following:
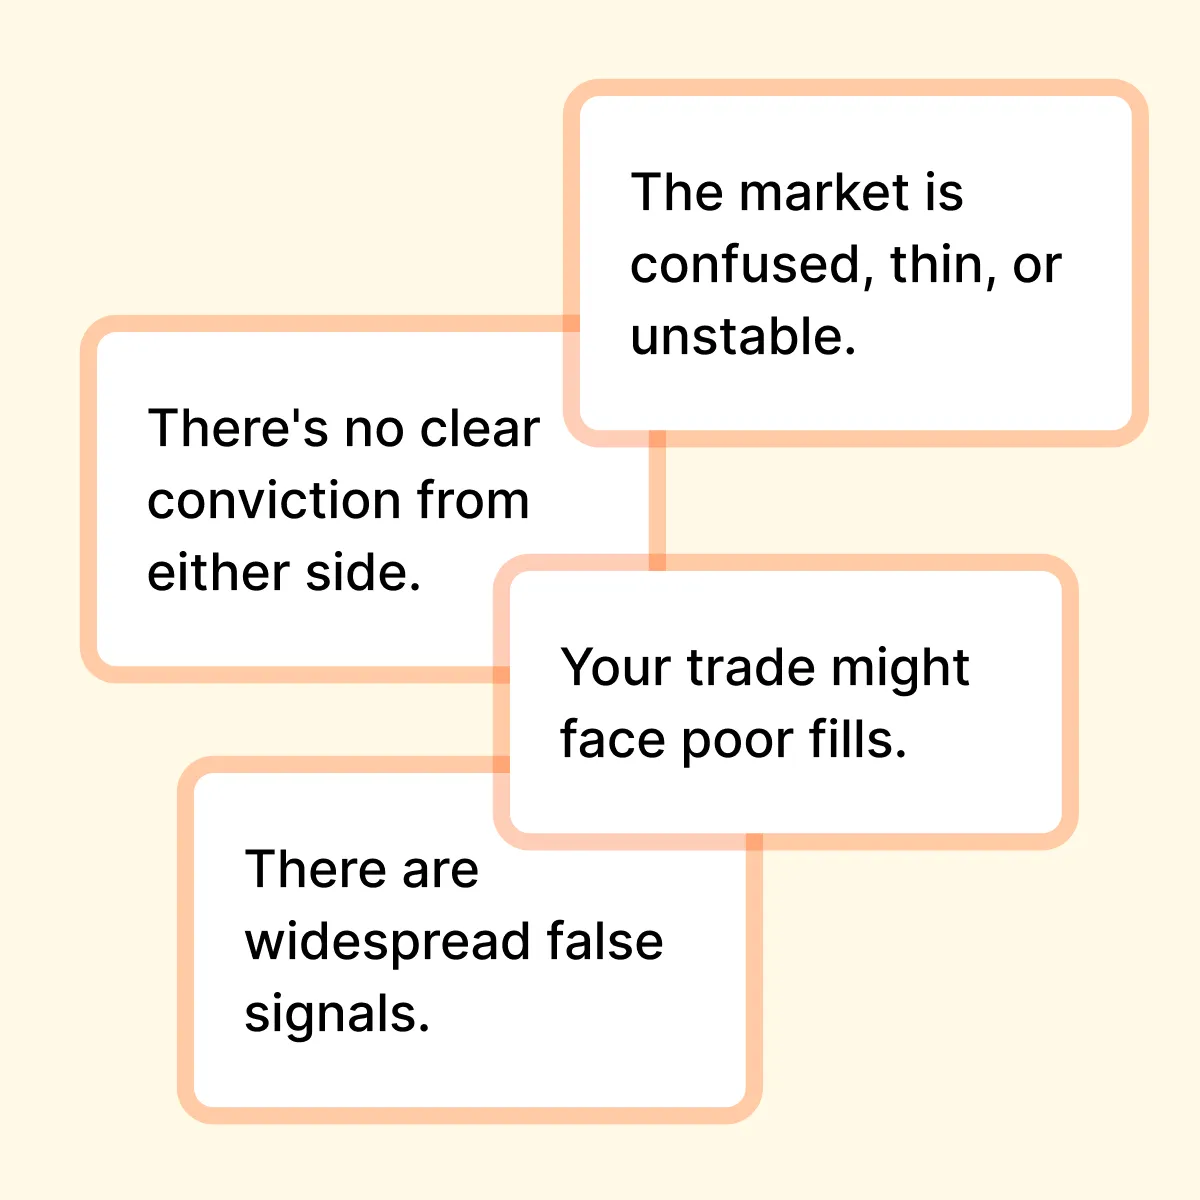
In such conditions, it’s best to stay out until the order book and spreads stabilize again.
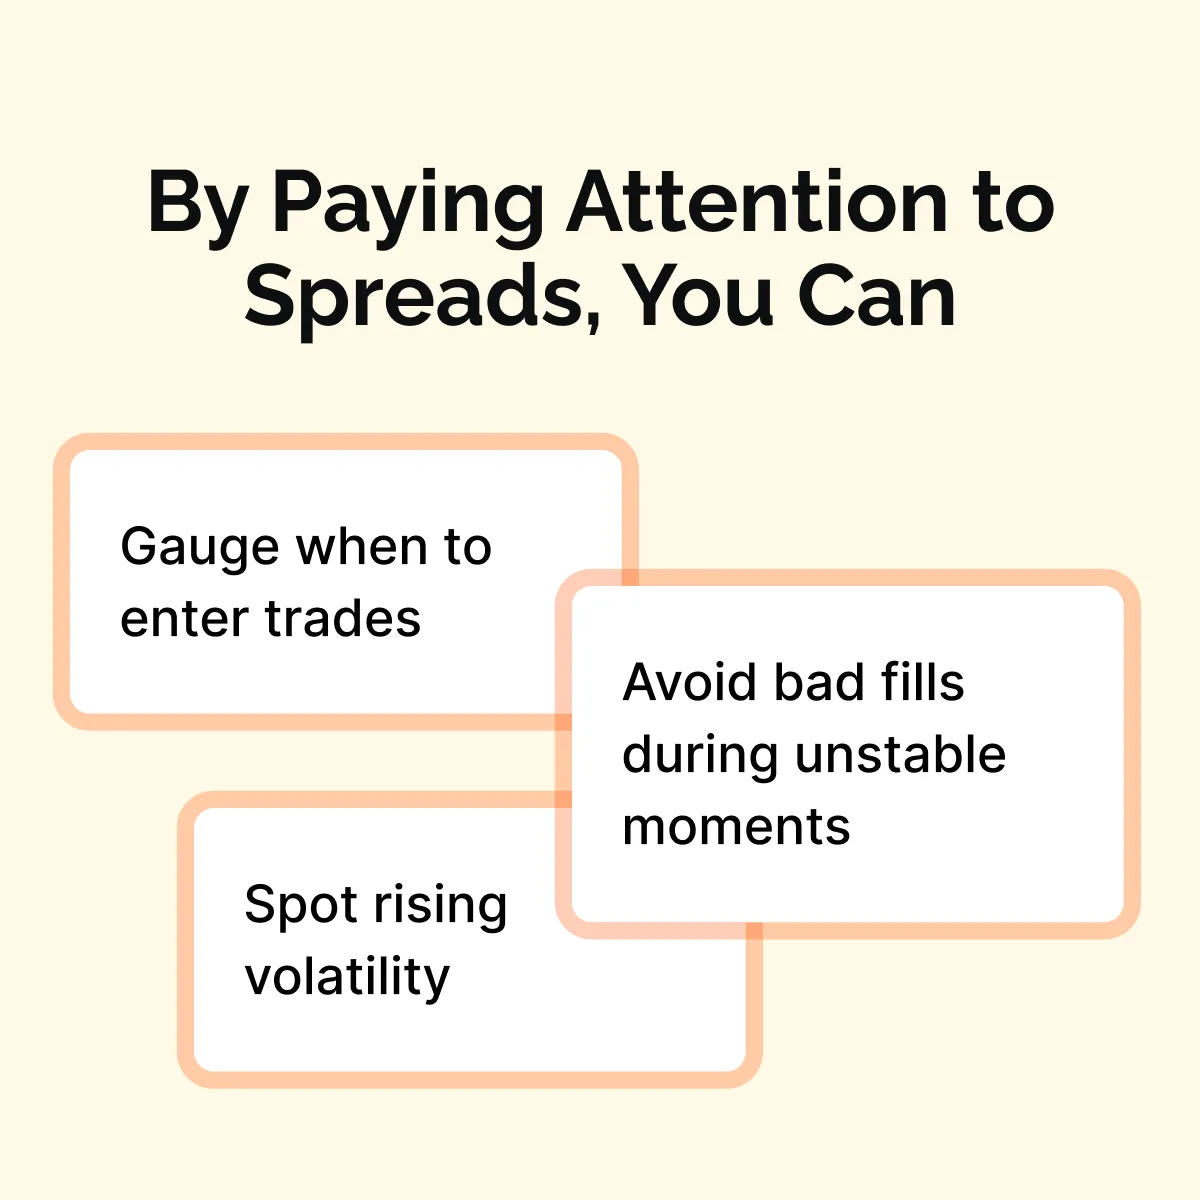
Strategic Uses for Spread Awareness
Do you know how tracking spread behavior can help you? You can:
- Improve your timing,
- Better read market liquidity, and
- Confirm market intent with precision.
But how to implement it? When planning entries or exits, pay attention to the bid-ask spread. If spreads are wide and jumpy, it means market uncertainty is high. This is when you’re most likely to get poor fills or heavy slippage. So, remember the best time to trade is when:
- Spreads are tight
and
- Liquidity is stable.
This setup gives you more controlled executions. Additionally, you can also follow these two strategies:
| Strategy I: Use Spreads To Spot Market Maker Activity | Strategy II: Use Spreads For Confirmation |
|
|
Conclusion
After reading this article, you will never see spread behavior in trading as just a number. You now understand that it’s a window into market psychology. It shows when traders are confident, cautious, or repositioning for risk. Also, “tight spreads” often signal agreement and strong participation, while “wide spreads” hint at hesitation or upcoming volatility.
Your ideal approach? Try to read spreads alongside liquidity, volume, and order book dynamics. This combined analysis allows you to spot potential traps, time entries better, and understand the balance between aggression and patience in the market.
Today, tools like Bookmap make this easier than ever. Instead of relying on static data, on Bookmap, you can see the bid-ask spread change in real time. By visualizing market uncertainty, you can understand what’s happening beneath the price. Want to see uncertainty unfold before price moves? Try Bookmap Global+.
FAQs
1. What is the bid-ask spread in trading?
The bid-ask spread is the difference between the price at which buyers are willing to buy (bid) and the price at which sellers are willing to sell (ask). It demonstrates the level of liquidity and agreement in the market. Tight spreads mean strong activity and confidence, while wide spreads suggest uncertainty or fewer active traders.
2. Why do spreads widen before news events?
Before major announcements like CPI, earnings, or FOMC, traders pull back their orders to avoid sudden risk. This reduces liquidity in the order book, making the bid-ask spread wider. It’s the market’s way of saying, “Let’s wait and see what happens.”
3. Can a wide spread be a trading signal?
Yes! A wide spread can warn about upcoming volatility or trader uncertainty. However, it should be interpreted in context with volume and liquidity. As a trader, you should watch how volume and liquidity behave. Always remember that a wide spread with strong activity can precede a move. In contrast, with weak activity, it may just signal hesitation.
4. How does Bookmap show spread behavior?
Bookmap displays the bid and ask directly as dots on your chart. Now, the space between them represents the spread. On Bookmap, you can see when spreads tighten, widen, or shift. This observation allows you to:
- Spot changes in market uncertainty
and
- Time your entries more precisely.
5. Is a tight spread always good?
Not always. A tight spread denotes agreement, but if there’s weak volume, it may still be a trap. That’s why several veteran traders track order flow to gain confirmation. Usually, tight spreads with strong trading activity are considered reliable.
Sign Up Now