See historical data more clearly in real time.
Compare plans to access deeper market visibility for historical data.
Education
August 6, 2024
Updated
SHARE
How to Leverage Historical Data for Trading Success

“Those who cannot remember the past are condemned to repeat it.” – George Santayana
Rightly said by famous philosopher George Santayana, this quote is relevant to trading as well and highlights the importance of historical data. Understanding past market behavior is crucial for making informed decisions and avoiding repeated mistakes. By studying historical patterns, traders can identify opportunities and optimize their trading performance.
Through this article, we will understand the importance of historical data in trading, from identifying trends and managing volatility to finding seasonal patterns. We will also discuss techniques for backtesting trading strategies and implementing historical insights in daily trading. We will also explain how traders can access and analyze historical data effectively by using advanced market analysis tools like Bookmap to improve their trading outcomes. Let’s get started!
What is the Value of Historical Data in Trading?
Historical market data allows traders to analyze:
- Past trends
and
- Patterns.
It shows how markets have behaved over time. See the graphic below to understand what historical data includes:
Analyzing historical market data is crucial for traders. Let’s see why:
- Identifying Recurring Patterns
- Traders use historical data to identify patterns and trends.
- This identification helps in predicting future price movements.
- It helps in gauging seasonal trends that traders can exploit.
- For example, retail stocks often perform better during the holiday season.
- Understanding Market Reactions to Events
- By analyzing previous earnings reports, traders predict how a stock can react to upcoming reports.
- Also, historical data on how markets responded to interest rate changes or employment reports guides traders on future expectations.
- Refining Predictive Models
-
- Traders use historical data to test the viability of trading strategies before applying them in live markets.
- Quantitative traders develop models based on historical data to execute trades automatically.
- Using these models, traders can identify optimal entry and exit points.
How do different traders utilize historical data?
The financial markets witness participation from a variety of traders. Some are looking to exploit daily price differentials (scalpers), while others are looking to hold a stock for even decades (long-term investors)! Everybody uses historical data as per their trading style. Let’s see how:
| Trading style | Timeframe | Usage |
| Long-Term Investors (Buy and Hold) | Years to decades |
|
| Swing Traders | Weeks to months |
and
|
| Day Traders | Hours to days |
|
| Scalpers | Seconds to minutes |
and
|
Types of Historical Data Relevant to Traders
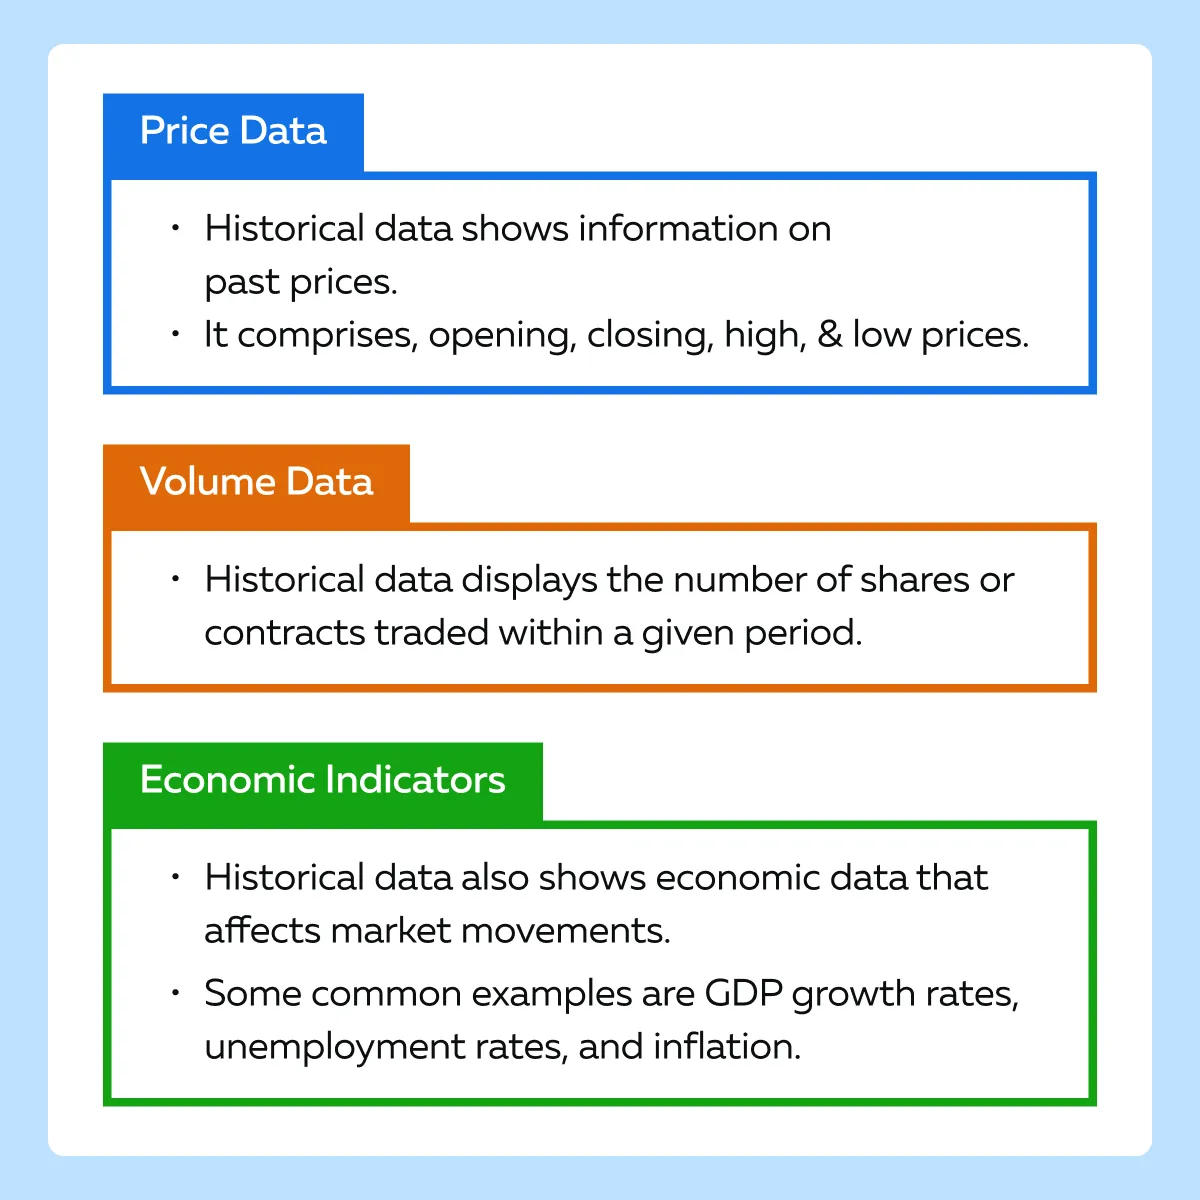
Historical data comes in various forms. Each provides unique insights to traders. The primary types include:
- Price data,
- Volume data, and
- Event data.
Let’s understand them in detail:
Type I: Price Data
Historical price data is one of the most critical components for traders. It displays OHLC data. See the graphic below:
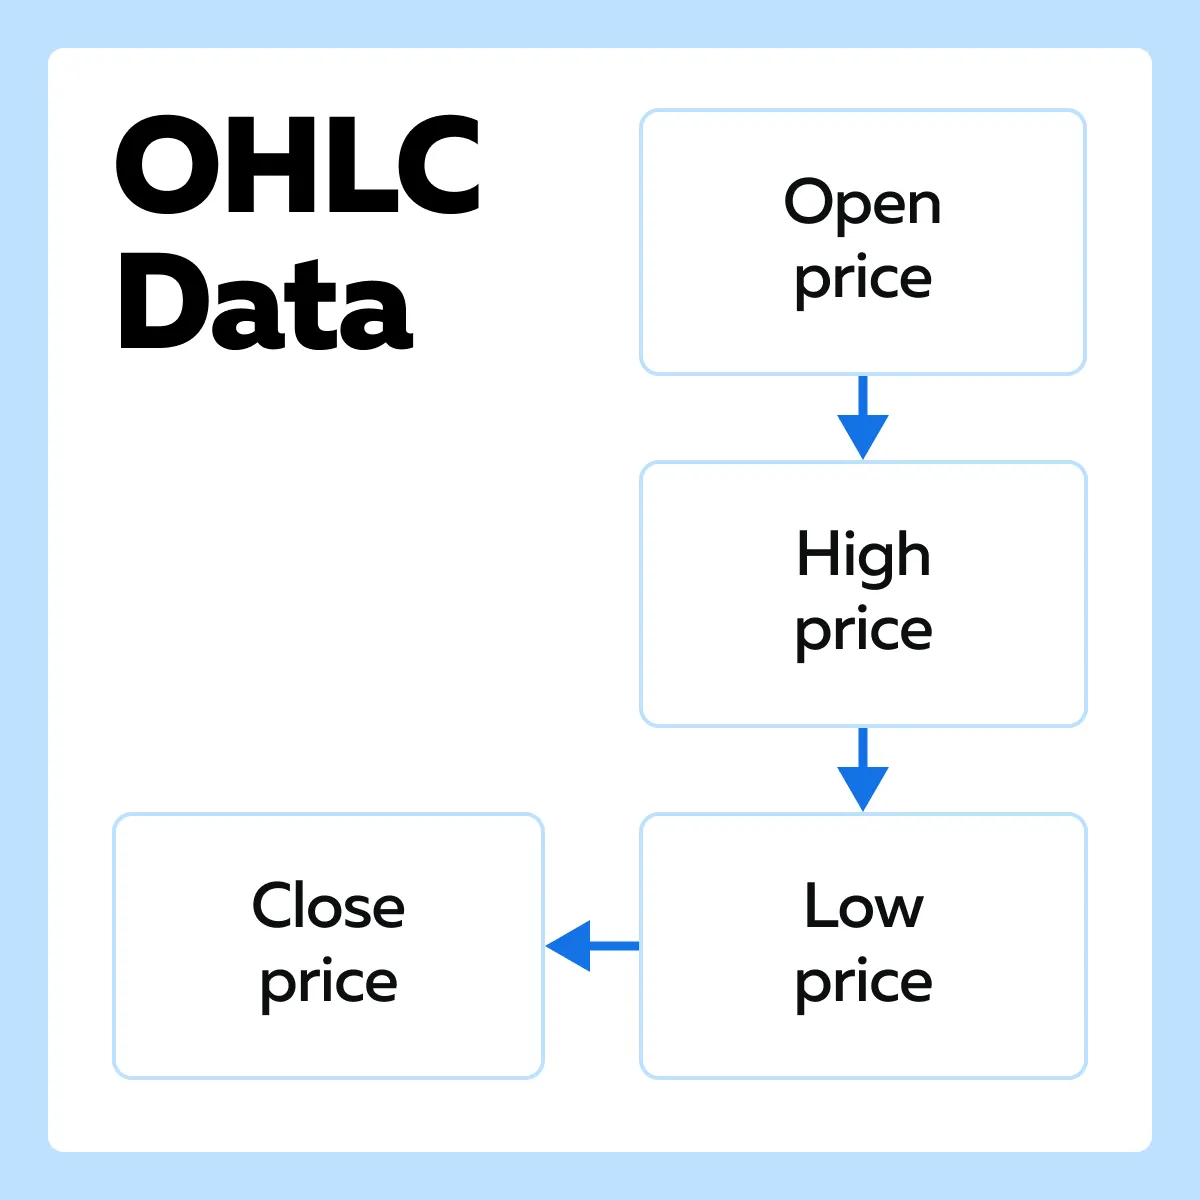
This data helps traders identify:
| Trends | Support and Resistance Levels | Volatility |
By analyzing past price movements, traders can identify the following:
|
|
|
Type II: Volume Data
Volume data indicates the number of shares or contracts traded within a given timeframe. It helps traders in:
- Confirmation of Price Movements
-
-
- High trading volumes accompanying price moves (either up or down) suggest that the move has strength and is more likely to be sustainable.
-
- Trend Reversals
-
-
- Significant changes in volume signal potential trend reversals.
- For example,
- Say there is a spike in volume after a prolonged downtrend.
- This event indicates the beginning of an uptrend.
-
- Market Sentiment
-
- Volume data helps gauge market sentiment.
- High volumes in a rising market indicate bullish sentiment.
- Conversely, high volumes in a falling market suggest bearish sentiment.
Type III: Event Data
Historical event data covers significant occurrences. See the graphic below:

Most traders use event data to understand how markets react to specific events. Let’s understand each item in detail:
- Earnings Announcements
-
-
- Historical data on how a stock has responded to earnings reports provides insights into potential future reactions.
- For instance,
- Say a company consistently sees its stock price rise after beating earnings estimates.
- Based on this information, traders anticipate a similar response in future earnings seasons.
-
- Economic Releases
-
-
- Several economic events significantly impact markets.
- Some common examples include
- Interest rate decisions,
- Employment reports, and
- GDP growth rates.
- Analyzing past market reactions to these events helps traders prepare for similar future occurrences.
-
- Political Events
-
- Historical event data related to political events helps traders to:
- Understand the market response to such events
- Historical event data related to political events helps traders to:
and
- Strategize accordingly.
- Some common examples of these political events include:
- Elections,
- Policy changes, and
- Geopolitical events.
Techniques for Analyzing Historical Data
Successful traders analyze historical data using various techniques to extract meaningful insights from historical data. The following are some popular and proven techniques:
- Trend analysis,
- Volatility analysis, and
- Seasonal analysis.
Let’s understand these techniques in detail:
Technique I: Trend Analysis
Through trend analysis, traders examine the historical price data. This analysis helps in identifying the direction and strength of market trends. Some common methods of trend analysis are listed below:
-
- Moving Averages:
- Moving Averages:
- Simple Moving Average (SMA)
-
-
- The SMA is calculated by averaging the closing prices over a specific period.
- For example, a 50-day SMA adds the closing prices of the past 50 days and divides by 50.
- Traders use SMAs to:
- Smooth out price data
-
and
- Identify trends.
- A rising SMA indicates an uptrend, while a falling SMA suggests a downtrend.
- Exponential Moving Average (EMA)
-
- The EMA gives more weight to recent prices and is more responsive to new information.
- The 50-day and 200-day EMAs are popular choices.
- When a short-term EMA crosses above a long-term EMA, it signals a potential upward trend (golden cross).
- The opposite indicates a downward trend (death cross).
- Trendlines
- Drawing Trendlines
-
-
- Traders draw trendlines by connecting a series of:
- Higher lows in an uptrend
- Traders draw trendlines by connecting a series of:
-
or
- Lower highs in a downtrend.
- These lines help visualize the trend direction and potential support or resistance levels.
- Breakouts
-
- Traders spot a trend reversal or continuation when price moves:
- Above a downward trendline
- Traders spot a trend reversal or continuation when price moves:
or
- Below an upward trendline.
Technique II: Volatility Analysis
Volatility analysis involves measuring the extent of price fluctuations over time. Traders use the following methods to analyze volatility:
- Standard Deviation
-
-
- Standard deviation measures the dispersion of prices from their mean.
-
- A higher standard deviation indicates higher volatility.
-
- Conversely, a lower standard deviation suggests more stable prices.
- Traders use standard deviation to set risk management parameters, such as stop-loss orders, ensuring they can withstand expected price fluctuations.
- Bollinger Bands
- Bollinger Bands consist of:
- A middle band (usually, a 20-day SMA)
and
- Two outer bands.
- These two outer bands are set at two standard deviations above and below the middle band
- When prices move closer to the upper band, the asset is considered overbought.
- Contrarily, price movements towards the lower band indicate it is oversold.
- Traders use Bollinger Bands to gauge volatility and potential reversal points.
Technique III: Seasonal Analysis
In seasonal analysis, traders examine historical data to identify recurring patterns tied to specific times of the year. Let’s see how:
- Seasonal Trends
- Commodities
-
-
-
- Let’s understand through an example,
- We know that oil prices often rise in winter due to increased heating demand.
- In this case, traders analyze past winter price patterns.
- This analysis helps in anticipating similar trends.
- Let’s understand through an example,
-
-
- Retail Stocks
-
-
- Retail stocks perform better during the holiday season
- Traders analyze historical performance around this period
- It helps them forecast potential price movements and adjust their strategies
-
- Calendar Effects
- January Effect
-
-
-
- Some stocks tend to rise in January after year-end tax selling in December.
- Understanding this pattern helps traders capitalize on potential price increases.
-
-
- Sell in May and Go Away
-
-
- This adage suggests that stocks generally underperform in the summer months.
- By analyzing historical data, traders can decide whether to adjust their positions during these months.
-
Backtesting Trading Strategies
Backtesting allows traders to test how their strategies would have performed. This process is critical in strategy development for several reasons:
- Validation
-
-
- It helps verify whether a strategy would have been profitable in the past.
- This kind of verification provides confidence in its potential future performance.
-
- Optimization
-
-
- Backtesting allows traders to tweak and optimize their strategies.
- Mostly, this is done by adjusting parameters to enhance performance.
-
- Risk Management
-
- It helps in assessing the risk and volatility associated with a strategy.
- Appropriate risk management leads to the development of robust risk management practices.
Setting Up a Systematic Backtesting Process
To effectively backtest a trading strategy, follow these steps:
| Count | Steps | Explanation |
| I | Define the Strategy |
|
| II | Collect Historical Data |
|
| III | Choose a Backtesting Platform |
|
| IV | Implement the Strategy |
|
| V | Run the Backtest |
|
| VI | Analyze the Results |
|
| VII | Optimize and Iterate |
|
| VIII | Validate |
|
For a more detailed guide on setting up a systematic backtesting process, you can refer to Bookmap’s blog on backtesting techniques.
Case Studies: Improving Trading Outcomes with Backtesting
Numerous studies have shown that backtesting has significantly improved trading outcomes. To enhance our understanding, let’s study two case studies:
Case Study 1: Moving Average Crossover Strategy
Strategy followed
- A “simple moving average crossover” strategy is followed.
- In this strategy, a buy signal is generated when:
- A short-term moving average (e.g., 50-day SMA)
crosses above
- A long-term moving average (e.g., 200-day SMA)
- Conversely, a sell signal is generated when the opposite occurs.
Setup
- The strategy is backtested on historical price data of a stock index over 10 years.
Performance Metrics
| CAGR (Compound Annual Growth Rate): | Max Drawdown | Win/Loss Ratio |
| 8.5% | 15% | 1.8 |
The Outcome
- The backtest reveals that the moving average crossover strategy consistently outperforms a buy-and-hold approach.
- It shows a favorable risk/reward profile with
- Lower drawdowns
and
- Higher win/loss ratio.
Case Study 2: RSI-Based Mean Reversion Strategy
Strategy
- A mean reversion strategy using the Relative Strength Index (RSI) is followed.
- In this strategy,
- A buy signal is generated when the RSI falls below 30 (indicating an oversold condition)
while
- A sell signal is generated when the RSI rises above 70 (indicating an overbought condition).
Setup
- The strategy is backtested on historical price data of a major currency pair over 5 years.
Performance Metrics
| CAGR (Compound Annual Growth Rate): | Max Drawdown | Profit factor |
| 12% | 10% | 2.5 |
Outcome
- The backtest shows that the RSI-based mean reversion strategy achieves:
- A high-profit factor
and
- Relatively low drawdowns.
- The strategy’s performance is consistent across different market conditions
- This consistency shows its robustness
Do you wish to know more about backtesting techniques and performance metrics? Refer to Bookmap’s detailed guide today!
How to Implement Historical Data in Daily Trading
It must be noted that integrating historical data analysis into daily trading setups enhances decision-making. This can be done by monitoring relevant indicators. Traders can apply historical data insights daily by focusing on specific indicators that have proven useful in past analyses.
For example,
- Trend Reversals
-
-
- Assume that historical trend analysis shows certain stocks tend to rebound quickly after a drop of 5% or more.
- Now, traders can monitor these stocks for similar drops.
- They can consider buying opportunities when such drops occur.
-
- Volume Patterns
-
- Historical volume data indicate periods of high trading activity.
- It suggests potential price moves.
- Traders can watch for volume spikes that historically precede price changes.
How Do Historical Patterns Support Real-Time Decisions?
Historical data provides a context for making informed real-time decisions. Here are some examples:
| News Events | Economic Data Releases |
|
and
|
For example,
- A trader uses historical volatility patterns to set dynamic stop-loss levels during earnings season.
- Say a stock historically exhibits significant price swings during earnings reports.
- In this case, the trader adjusts stop-loss levels to wider ranges.
- This adjustment helps them accommodate expected volatility, rather than use static thresholds.
How to Adjust Trading Strategies Based on Historical Insights?
Based on historical data, several traders keep adjusting their trading strategies to maximize their chances of earning profit. Let’s see some common adjustments:
| Changing Entry and Exit Points | Modifying Position Sizes |
|
|
Why is Continual Evaluation and Refinement Important?
Traders must note that ongoing historical data analysis combined with real-time market feedback is crucial for refining trading strategies. Let’s understand this importance through an example:
- Assume that a trader periodically reviews their trades’ performance against historical benchmarks.
- Say during specific market conditions, the trader notices a consistent underperformance.
- In response, the trader adjusts their strategy.
- They alter their entry/exit points.
- Also, the trader modifies position sizes to better align with historical patterns.
Avoiding Pitfalls in Historical Data Analysis
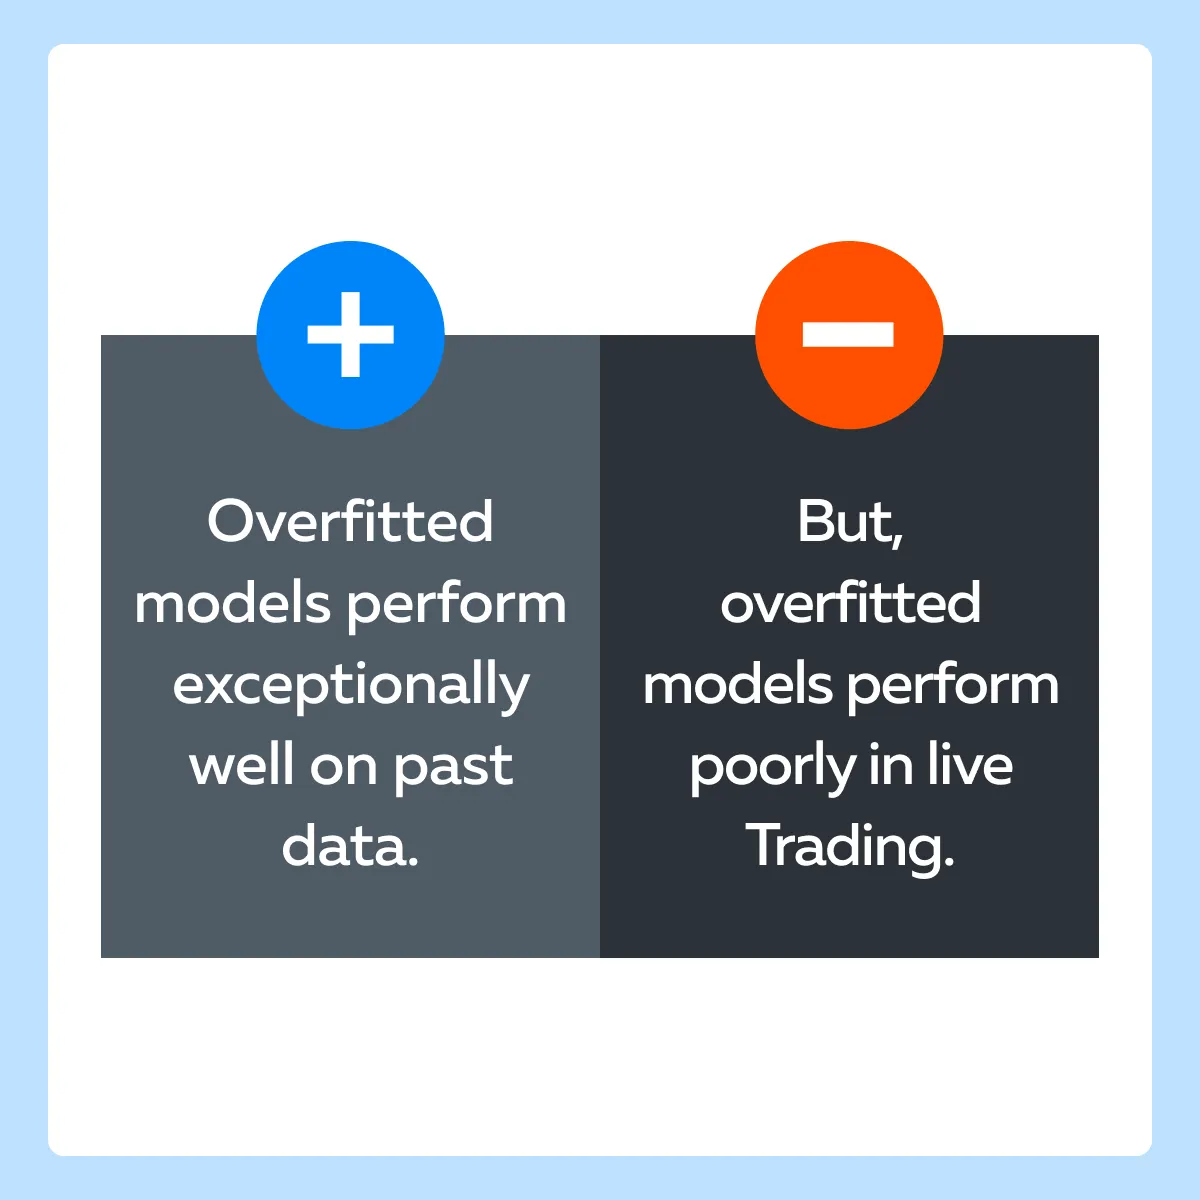
Historical data analysis is a powerful tool for traders. But it comes with a few shortcomings that must be managed carefully. One major pitfall is “overfitting”. It occurs when a trading model is excessively complex. Due to this complexity, the model captures noise or random fluctuations in the historical data rather than underlying market patterns.
Let’s understand the major risks of overfitting:
- False Confidence
-
-
- An overfitted model gives a misleading sense of confidence.
- It appears highly successful on historical data but performs poorly in live trading.
-
- Lack of Robustness
-
- Usually, these models are not robust.
- They can break down under different market conditions and lead to significant losses.
How Can You Avoid Overfitting?
- Simplify Models
-
- Use simpler models that focus on capturing major trends and patterns rather than minor fluctuations.
- For example, a simple moving average crossover strategy is less prone to overfitting than a complex model with many parameters.
- Out-of-Sample Testing
-
- Split historical data into:
- In-sample (for model training) datasets
- Split historical data into:
and
- Out-of-sample (for model testing) datasets.
- This helps ensure the model performs well on unseen data.
How does High-Quality Historical Data Improve Trading Outcomes?
Always remember that poor-quality data leads to:
- Incorrect conclusions
and
- Flawed trading strategies.
Traders who use poor-quality data often:
- Make Skewed Analysis
-
-
- Incomplete or inaccurate data skews analysis results.
- This leads to the formation of misguided strategies.
-
- Miss Patterns
-
- Often, low-quality data omits critical market patterns or trends.
- This omission reduces the effectiveness of the analysis.
How Can You Ensure Data Quality?
- Use reputable data providers.
- Take data from trusted financial platforms and exchanges.
- Implement data cleaning procedures to address the following:
- Missing values,
- Errors, and
- Inconsistencies.
- Ensure the data is regularly updated to include the latest market information.
Conclusion
Historical data is crucial for developing robust trading strategies. It helps traders identify patterns, manage risks, and make informed decisions. Traders can enhance their performance by integrating insights from past data into daily trading and avoid pitfalls like overfitting. Also, traders must remember that continuous learning and adapting strategies based on historical analysis are key to success.
By using advanced market analysis tools like Bookmap, traders can use its powerful features and access historical market data. To deepen your understanding of how historical data can directly influence your trading decisions, discover detailed backtesting techniques, and refine strategies with DOM data and performance metrics, check out our comprehensive guide: Refine Your Trading Strategies with DOM Data and Performance Metrics.
FAQ
Why is historical data important in trading?
Historical data helps traders recognize patterns, understand market reactions to key events, and improve strategy development through backtesting. It provides the context needed to make informed trading decisions and manage risk effectively.
What types of historical data do traders analyze?
Traders analyze three main types: price data (OHLC charts), volume data (trading activity levels), and event data (like earnings reports or economic releases), each offering different insights into market behavior.
How can backtesting strategies with historical data improve trading performance?
Backtesting allows traders to validate and refine strategies by simulating how they would have performed in the past. It helps identify optimal parameters, manage risk, and build confidence before applying strategies in live markets.
What is overfitting in historical data analysis, and how can traders avoid it?
Overfitting happens when a strategy is too closely tailored to past data, making it unreliable in live markets. Traders can avoid it by using simple models, conducting out-of-sample testing, and prioritizing major trends over random fluctuations.
Sign Up Now