See volume more clearly in real time.
Compare plans to access deeper market visibility for volume.
Education
October 29, 2025
SHARE
How to Read Volume Like a Pro (Not Just Bars on a Chart)

Most traders glance at volume bars! They notice a spike and assume they understand the market. But that’s a mistake! Volume bars only show totals over time. They leave out critical details like where trades occurred, who initiated them, and whether the activity was absorbed or continued.
Thus, relying solely on histograms is a bit like reading a story from the last page! Doing so, you can miss the entire plot. So, what should you do instead? You should still read volume, but not just with bars stacked on a chart.
Read this article to understand how to read volume with real insight. You’ll learn to spot volume at price and distinguish between aggressive and passive trading. You’ll recognize key shifts, such as exhaustion, absorption, and follow-through. We’ll also explain why pairing volume with liquidity offers a far more complete view of the market auction. Let’s begin.
Why Volume Bars Alone Can Mislead You
Most traders start by looking at the volume bars that appear below a candlestick chart. These bars are also called “volume histograms” and are the default view on most trading platforms. However, as discussed, they can hide important details due to their several shortcomings! Here are the key ways through which volume bars can mislead you:
- Volume bars aggregate trading activity over a set period.
- For example, a 5-minute candle might show that 10,000 contracts were traded.
- However, that single number doesn’t tell you:
- When within those 5 minutes, did the activity pick up.
- Whether all the trading happened at the start, the end, or was evenly spread out.
- The volume bar itself does not provide this detailed timing information.
- Volume bars lack directional detail:
- A spike in volume means a lot of contracts changed hands.
- It does not tell you whether that volume came from aggressive buyers pushing the price up or aggressive sellers pushing it down.
- Without this context, you can easily misread market intent.
- Volume bars give no insight into market structure:
-
- A tall bar only says “lots of trading happened,” but does not reveal “why” it is happening.
- Did the price slice through liquidity with strong momentum?
- Did it hit a wall of hidden sell orders (absorption) that stopped the move?
- Both scenarios look identical in a histogram.
- A tall bar only says “lots of trading happened,” but does not reveal “why” it is happening.
- Volume bars also have no memory:
-
- Once the candle closes, all you see is a single bar.
- You can’t tell whether the activity:
- Built gradually
- Spiked suddenly
- Stalled mid-way
So, what’s the solution? If you want to truly understand how to read volume, you need more than just the histogram. Ideally, you should start using market analysis tools, like Bookmap. Check out its various features:
Without such tools, you’re merely guessing how the trading pressure really unfolded. For more clarity, let’s check out an example:
-
- Say breakout candle shoots up with huge volume.
- At first glance, it looks like buyers are in control.
- You interpret that the price will keep running.
- But then, the move fails and the price falls.
- Now, without context, you think demand simply vanished.
- But in reality, a large iceberg sell order was sitting there.
- It was quietly absorbing all that buying pressure and turned the breakout into a trap.
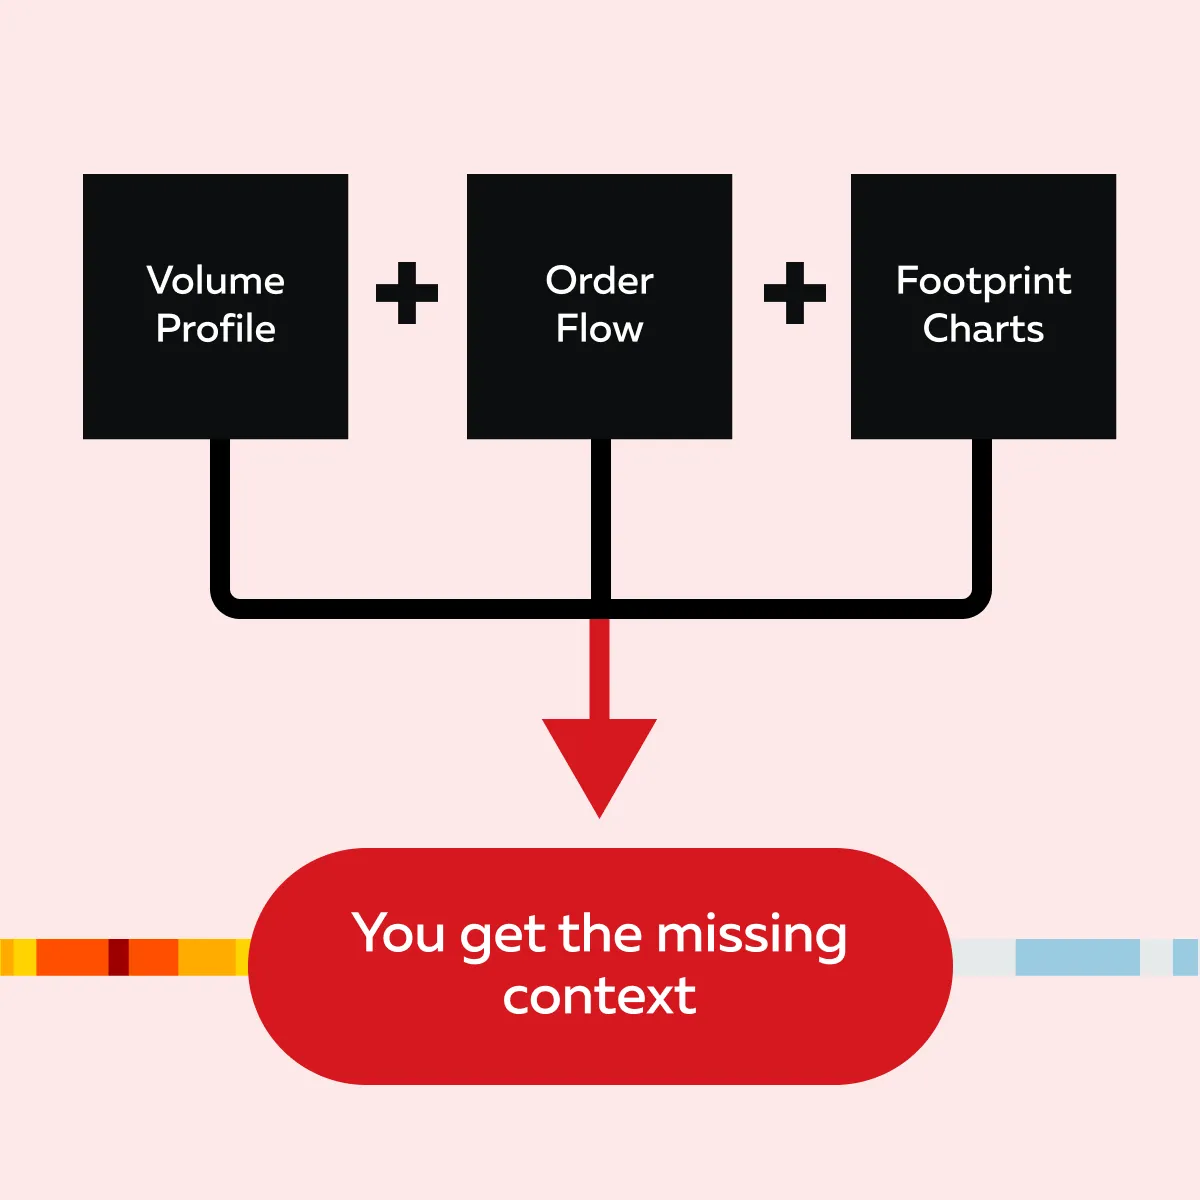
Now, if you had used Bookmap’s volume dots, they show whether that heavy trading came from aggressive buyers or sellers. This gives you clarity on who’s really pushing. Next, through the heatmap, you can determine if strong liquidity (like hidden sell walls) was sitting at the breakout level. This lets you analyze whether the move was real or just an absorption.
Together, both Bookmap features let you spot traps that normal volume bars completely hide.
The Importance of Volume at Price (Not Just Over Time)
Ask any trader how to read volume. Most will say: focus on time-based bars. However, that’s a traditional approach! Nowadays, real market insight comes from seeing ’volume at price’. This insight shows you which levels the market is accepting or rejecting. This is something a time bar alone can’t reveal. Let’s understand in detail why ‘volume at price’ matters:
1. Volume at Price = Market Interest
Instead of showing how much was traded in a 5-minute block, volume at price tells you how many contracts exchanged hands at each price level. For example,
- Let’s say a 5-minute candle shows 1,000 contracts traded.
- If you only look at the time-based volume bar, that’s all you know = 1,000 contracts in 5 minutes.
- However, with volume at price, you can see how those 1,000 contracts were distributed:
- 600 contracts traded at $50.00
- 300 contracts traded at $50.05
- 100 contracts traded at $50.10
- This shows you that most trading happened at $50.00.
- So that price level had the strongest interest or support.
Without volume-at-price, you’d just see 1,000 contracts and miss the fact that $50.00 was the key level. It is highly possible that institutions or large players are active there.
2. Volume Clusters and Absorption Zones
Volume clusters represent heavy trading happening at specific points (particularly at highs or lows). It can signal exhaustion or big money defending a position. On the other hand, absorption zones are areas where strong buying is hitting the market, but the price doesn’t increase.
Now, that’s often a passive seller absorbing the flow! A simple bar won’t reveal this, but volume-at-price tools will.
Why Traders Should Analyze Volume At Price?
Markets are auctions! They are constantly testing prices to discover value. Volume at price shows whether the market is accepting, rejecting, or testing certain levels. Time-based volume spikes alone can’t tell you that!
For example,
- Let’s say two traders see a candle with 3,000 contracts traded.
- Trader Mr. A looks at volume-at-price.
- He notices that 2,400 contracts were absorbed at a single price level.
- He realizes someone is defending that zone and plans to fade the next test.
In contrast, trader Mr. B only sees the histogram bar. To him, it’s just a spike in activity! He misses the deeper story, and it could hurt him as follows:
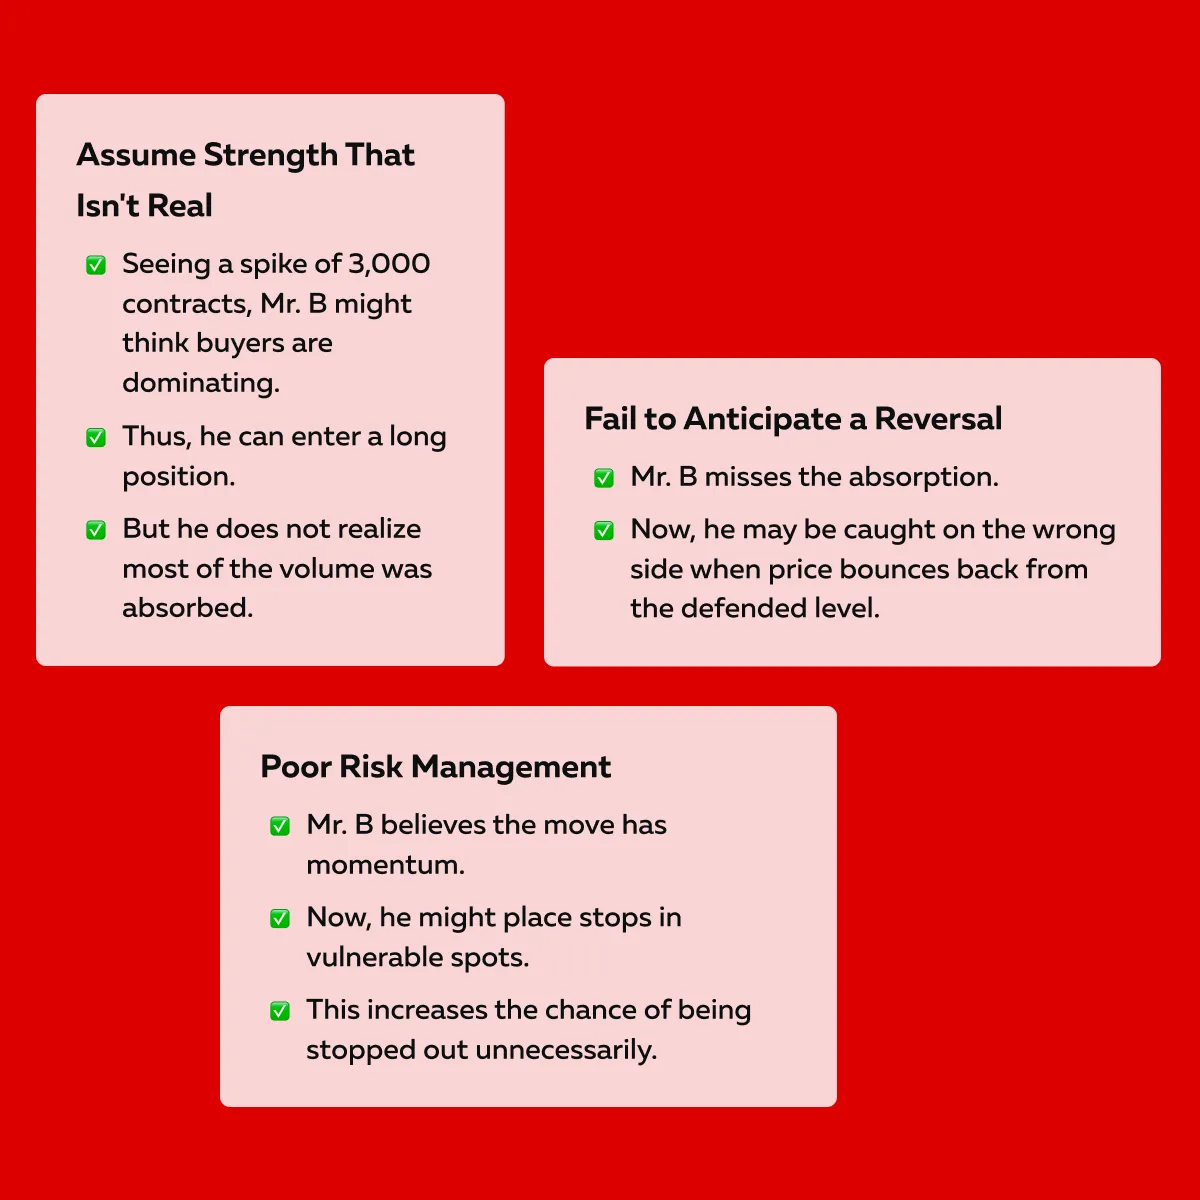
In this way, without volume at price, you can misread intent + risk losses that could have been avoided. See volume where it actually matters— not just at the bottom of your chart. Try Bookmap.
How to Spot Smart vs. Weak Volume
Do you think all volume is strong or meaningful? Nope! Sometimes, it signals just continuation, and other times, it’s a warning that the move is about to fail. The key? – It is “context”. Context decides whether it signals strength, weakness, or impending reversal. Below are three ways you can spot smart vs. weak volume:
| Way I: Aggressive Volume Without Follow-Through | Way II: Passive Absorption (Smart Money at Work) | Way III: Exhaustion (The End of a Move) |
|
|
|
Want a takeaway? Volume itself doesn’t tell the 100% story! As a smart trader, you should notice whether it’s aggressive, passive, or exhausted (the three cases mentioned above). By doing so, you can separate smart volume (institutional activity with intent) from weak volume (noise that fades).
How to Spot Smart vs. Weak Volume with Bookmap
Do you want to go beyond histograms? Want to really learn how to read volume? You can start using Bookmap to get a visual edge! Instead of just bars, you see volume dots on Bookmap. These dots show exactly where trades are hitting price levels. Furthermore, the size and placement of these dots tell you whether the activity is strong, weak, or deceptive.
Let’s understand in detail:
1. Exhaustion = Large Dots, Then Silence
Let’s say you see big dots followed by smaller dots or empty space. Now, it usually means traders hit the market hard, but no one followed through. This is a sign of “exhaustion”. You can interpret it as the move running out of steam, which may soon stall or reverse.
2. Absorption = Dots Clustered at One Level
Let’s assume that, on Bookmap, you notice multiple dots clustering at the same price. However, the market doesn’t move. Now, that’s absorption. Large passive orders (often institutions) are quietly soaking up all the aggressive trading. This tells you that someone strong is defending that level.
3. Stop Run = Heavy Dots, Then Pullback
Sometimes you’ll see a sudden burst of large dots followed by an immediate pullback. Now, that’s often a stop run. Traders’ stops get triggered and create a quick spike. However, once they’re cleared, the price snaps back. This can also mark the start of a reversal.
In this way, with Bookmap, you’re not just counting trades! Instead, you’re reading the behavior behind the volume. Using Bookmap, you can easily find the answers to these trading questions:
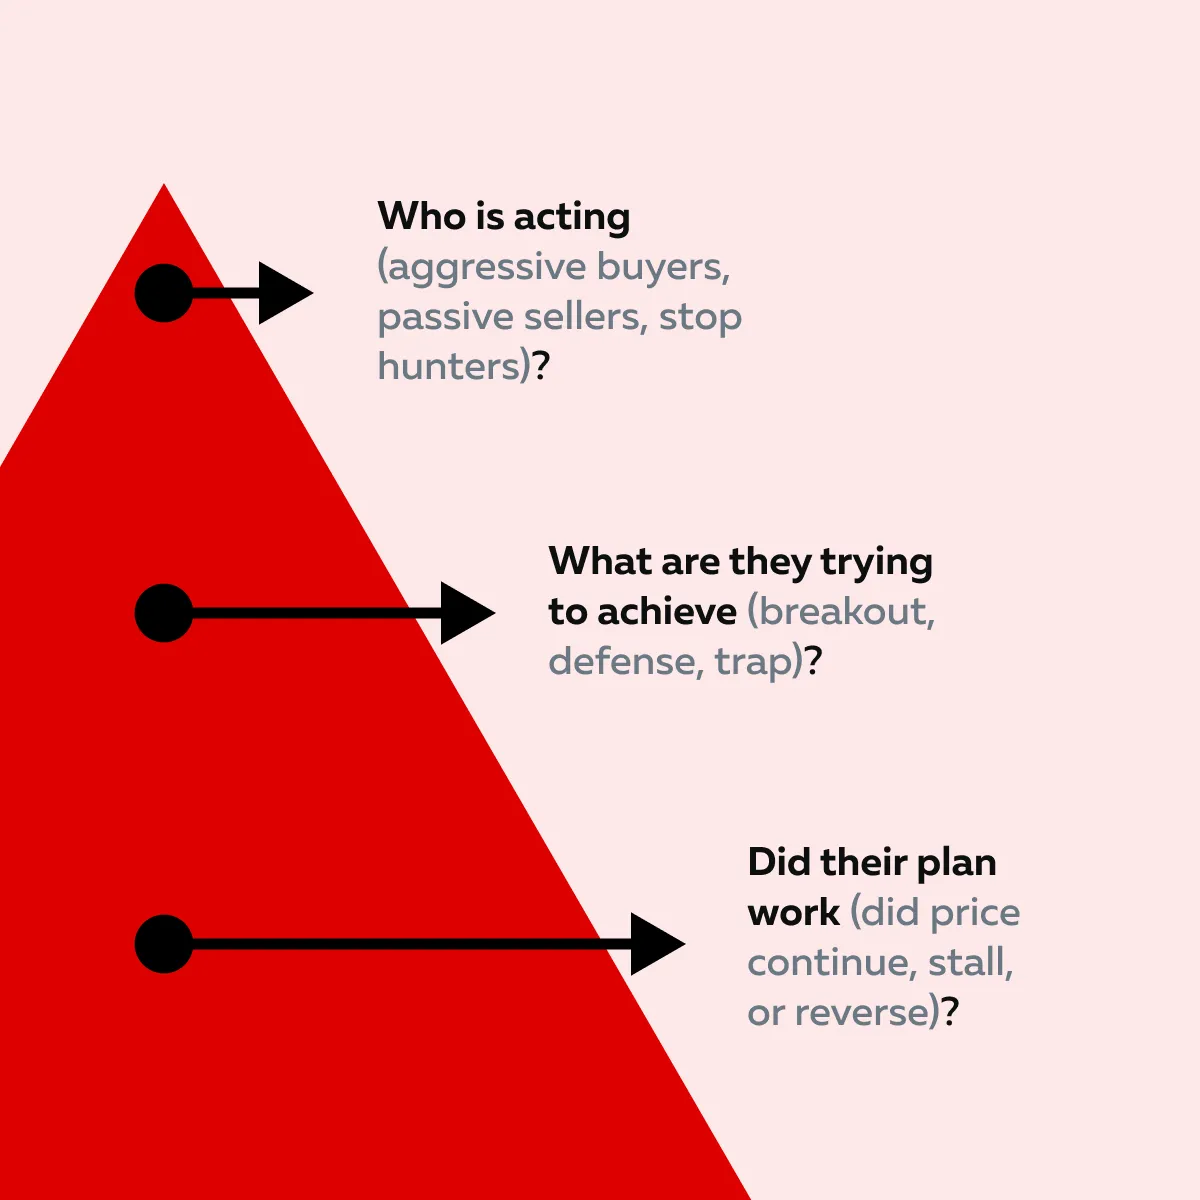
Want to read volume like a pro? Get access to full-depth volume with Bookmap.
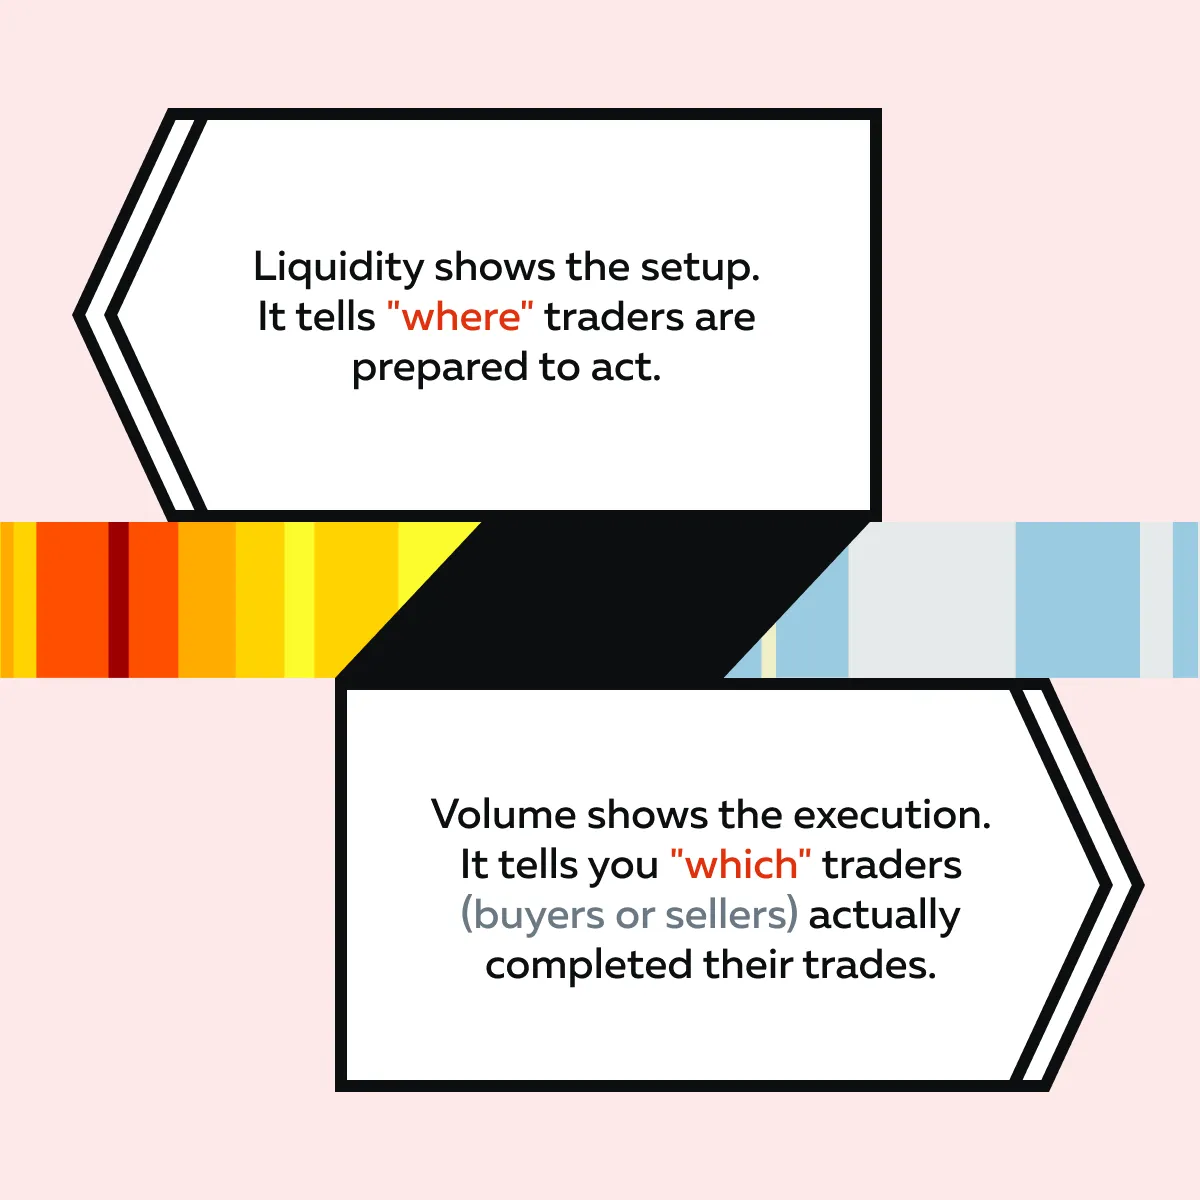
Volume Is the Result, Liquidity Is the Lead
So, by now, with little practice, you can start reading volume effectively. However, don’t get carried away! Volume only shows what has already happened. The real trading edge comes from anticipating what might happen next. But how do you know this? It comes from liquidity analysis. That’s because:
| Liquidity Shows “Trader Intent” | Volume Shows “Trader Action” |
|
|
Need a sequence? Liquidity comes first, and then volume follows. And as a smart trader, you need both! A combined analysis allows you to really understand the auction process.
For more clarity, let’s study an example:
-
- Say price is testing a level with strong buy orders (bid stacking).
- Suddenly, sellers hit it with heavy volume.
- Now, if the level holds, it means real buyers defended that liquidity.
- They may push the price higher.
- But if the level breaks, it suggests the liquidity was fake.
- Here, volume confirms whether the intent was genuine!
So, liquidity is the lead and volume is the result! To read the volume completely, you need to pair it with liquidity. This lets you see both the market’s intentions and its actions.
Conclusion
Want to trade like a professional? You must see volume the way professionals do! A simple bar chart only tells you how much was traded during a time block, but it doesn’t explain “where” or “why”. Thus, to read volume 100%, you need to go deeper! Such a deeper analysis can be done by
- Looking at volume at price,
- Spotting whether trading was aggressive or passive, and
- Recognizing signs like exhaustion or absorption (both reveal market intent).
One more important thing! Always combine volume with liquidity. This lets you see both the plans (orders waiting) and the actions (trades executed). Furthermore, to really expose the auction process, you can start using Bookmap. Utilizing this efficient tool, you can see how volume builds, changes, and reacts. Go beyond volume bars. Visualize how and where traders are interacting with the market.
FAQs
1. What is the difference between volume and liquidity?
Volume shows how many contracts or shares were actually traded. On the other hand, liquidity shows the buy and sell orders waiting in the market. It shows what traders intend to do.
For a better understanding, you can think of it as “plans vs actions”. Here, liquidity is intent, and volume is execution.
2. Can you use volume alone to trade?
Ideally, you shouldn’t! That’s because volume by itself can be misleading. To get the full picture, you need to know:
- Where the trades happened,
- How they interacted with existing orders, and
- Whether the price followed through or got absorbed.
3. What’s the best way to analyze volume in real time?
You should use tools that reveal volume at price and distinguish aggressive from passive trades. Leading platforms like Bookmap show this with volume dots and heatmaps. Using Bookmap, you can see the context behind every move.
4. Is volume more useful in futures or stocks?
Both markets benefit from volume analysis. In futures, it works particularly well because order books are fully transparent. In contrast, when it comes to stocks, volume still helps, but you should pair it with depth-of-book tools like Bookmap.
That’s because, in stocks, many large orders are hidden. Thus, analyzing volume alone can be misleading. By using Bookmap, you can see where orders are stacked and how the price reacts. This allows you to see real buying or selling pressure. Also, you can spot potential support, resistance, or traps.
Sign Up Now