See long liquidation more clearly in real time.
Compare plans to access deeper market visibility for long liquidation.
Education
December 26, 2025
SHARE
How to Spot Long Liquidations Before They Break

For most traders, liquidation happens out of nowhere and is random. But this is a myth! In reality, liquidity builds up slowly in the “order flow”. By analysing it, you can anticipate when longs are trapped, exhaustion buying sets in, and liquidity begins to vanish.
So don’t want to be the trader who reacts only once the price drop starts? You should start reading the order flow. This allows you to recognize when the market is heavy and longs are vulnerable. Also, you can receive these signals anywhere from minutes to even seconds before the break.
For more clarity, read this article to learn how to spot long liquidations before they happen and what visual cues signal pressure building. Additionally, you will learn how to utilize Bookmap and spot where buyers are running out of ammunition and identify the likely reversal zones.
What a Long Liquidation Really Is
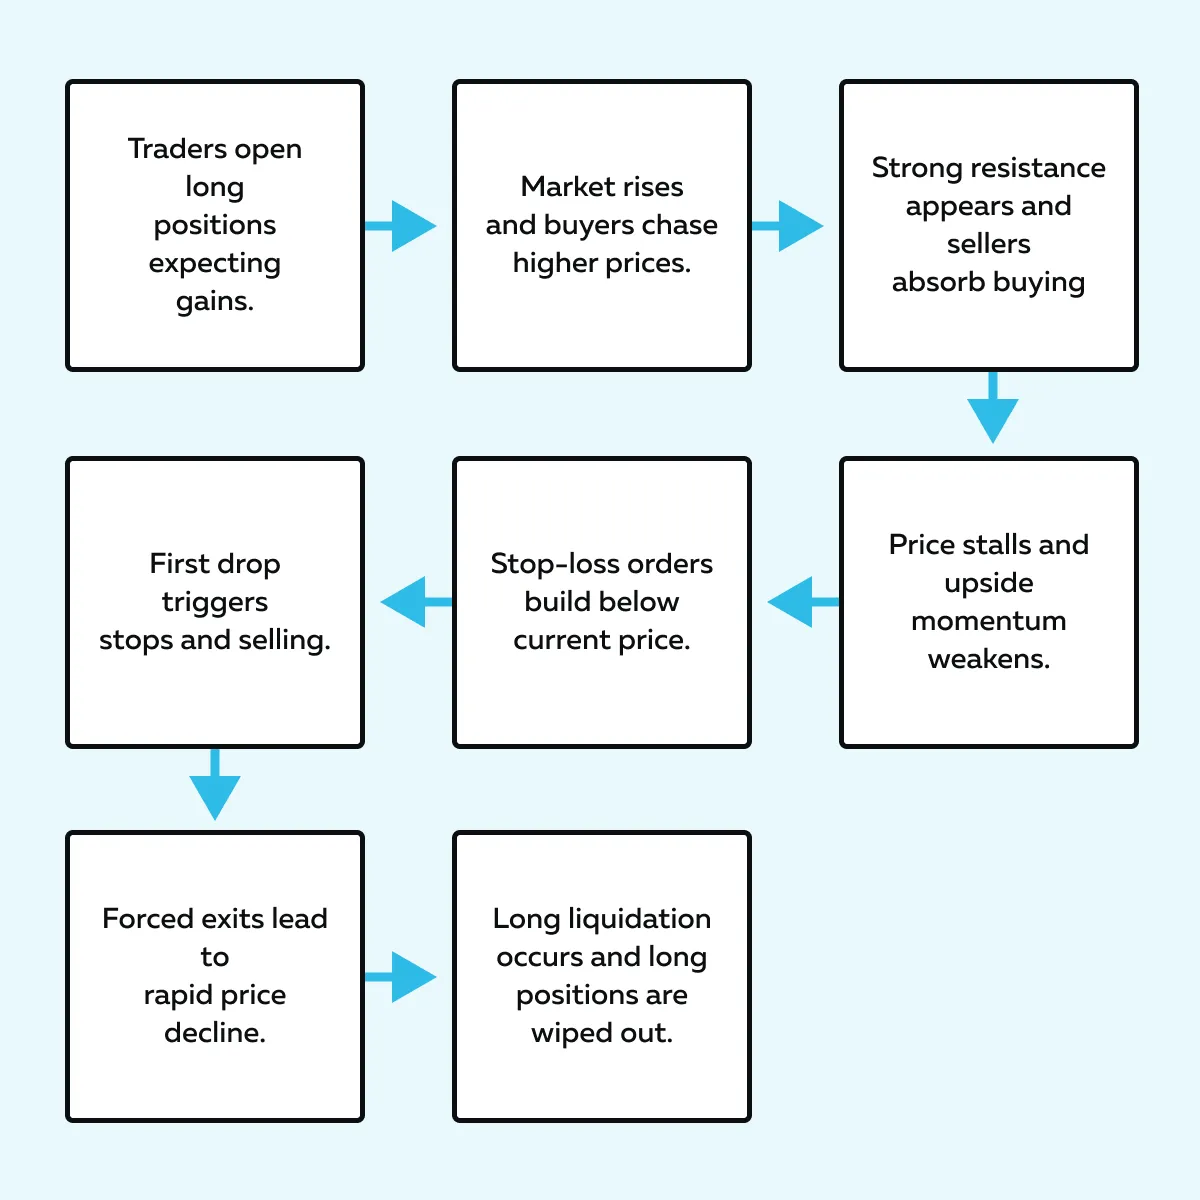
A long liquidation trading happens when traders holding long positions are forced to exit. Let’s see how it happens:
-
- Traders who went long expect prices to rise.
- As the market pushes higher, they buy more and chase continuation.
- But if the market meets heavy resistance (sellers absorb the buying), the price stalls.
- At that point, stop-loss orders start piling up below the current price.
Now, when the first drop triggers those stops, a chain reaction begins. One forced sale leads to another, resulting in a sharp downward trend. This is what we refer to as a “long liquidation”. It is a wave of long positions being closed automatically, often due to margin calls or stop-outs.
Popular trading analysts, such as Tom B, explain in their sessions that in long liquidation trading, delta (buy vs. sell pressure) can stay positive even as the price stops rising. This is a signal that buyers are trapped, and a long liquidation might be near. See forced selling unfold before it breaks using Bookmap’s real-time delta and liquidity → Compare Packages.
Early Warning Signs of Liquidation Pressure
Before a long liquidation hits, the market often shows warning signs through order flow data. Through these clues, traders can easily spot when buying momentum is weakening (even before prices drop). Below are the main signals to watch:
- Buy exhaustion:
- Traders keep buying aggressively, but the price doesn’t move higher.
- It means buyers are running out of strength.
- Liquidity shift:
- As the market nears recent lows, buyers (bids) start to disappear or “pull.”
- This leaves less support below and makes a drop easier.
- Absorption at highs:
- Large hidden sell orders absorb constant buying.
- Even though buyers are active, the price can’t rise (sellers quietly dominate).
- Delta divergence:
- Delta remains positive (with more aggressive buying), but the price is either flat or falling.
- This shows longs are getting trapped.
- Iceberg resistance:
- Hidden selling orders repeatedly block upward moves.
- The price surges are capped.
Buyers sometimes keep trying to push prices higher by repeatedly hitting sell orders. But there’s a lot of hidden selling in that area (called hidden or iceberg liquidity). As a result, the price doesn’t move up (it just gets stuck).
Then, when buyers stop supporting the market and bids disappear, all those trapped long traders are forced to sell. This sudden wave of selling creates liquidation pressure, causing the price to drop.
Spot liquidation risk before it hits the tape with Bookmap’s order flow → Compare Packages.
The Sequence of a Long Liquidation
Do you think a long liquidation just appears out of nowhere? Nope! It is not random. Instead, it’s the result of pressure that builds over time as traders get trapped on the long side. When that pressure finally breaks, the market reacts in a very specific sequence. Let’s see how long liquidation trading happens step by step:
| Step | Phase Name | What Happens | Meaning / Impact |
| I | Pre-break Buildup |
|
|
| II | Absorption Phase |
|
|
| III | Trigger |
|
|
| IV | Vacuum |
|
|
| V | Absorption after Flush |
|
|
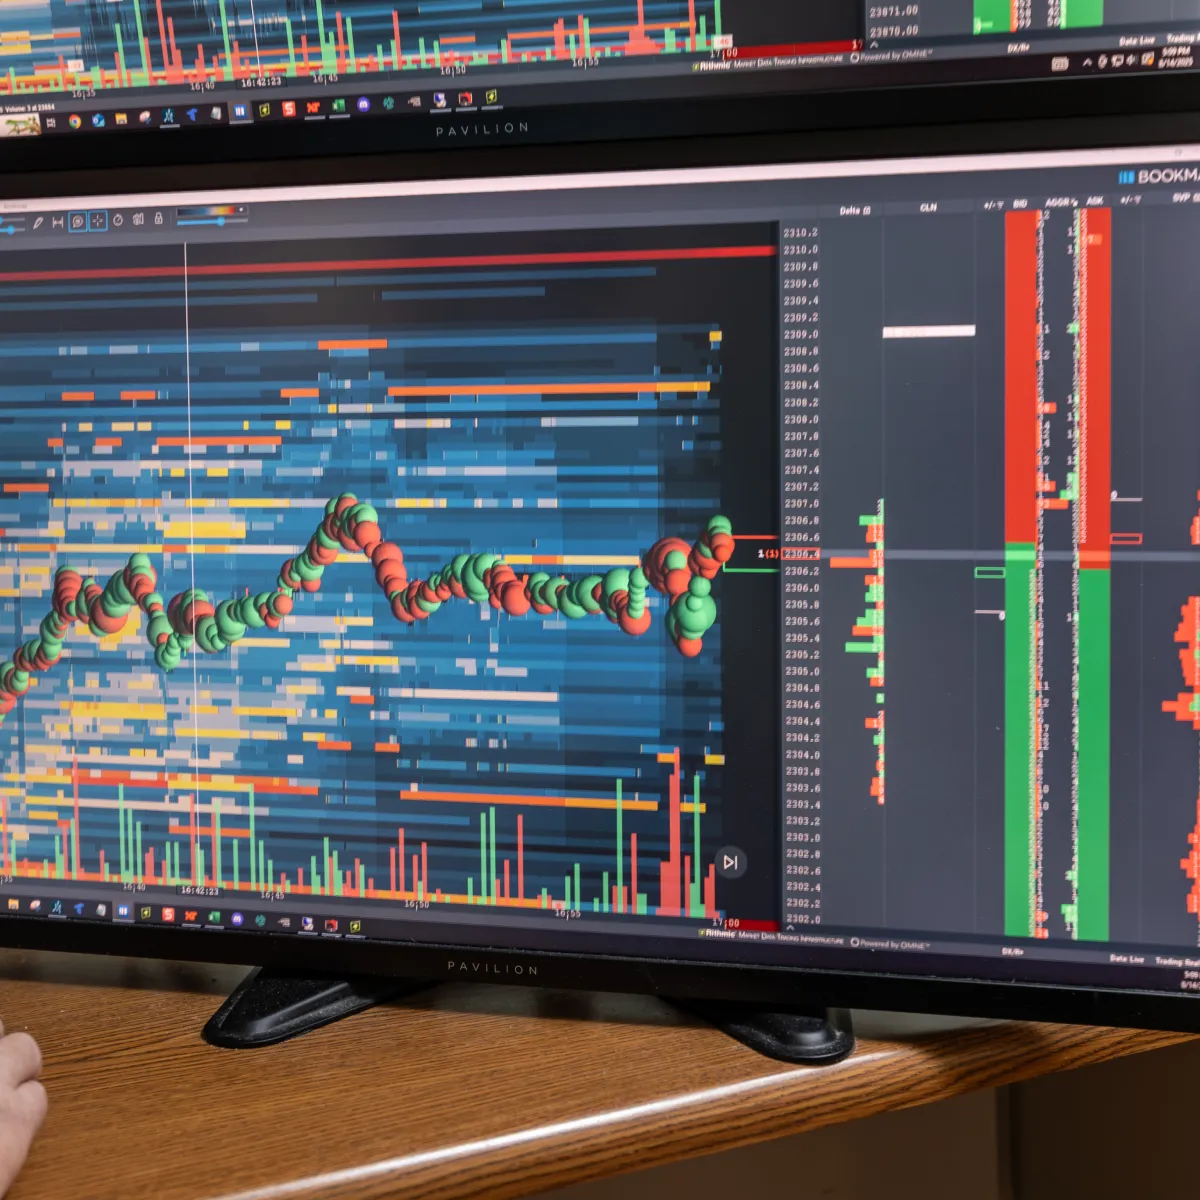
On real-time market analysis tools, like Bookmap, you can literally see this play out. On Bookmap, you will observe that:
-
- A “vacuum” of dark areas is visible when liquidity disappears.
- This vacuum is followed by “bright clusters”.
- These clusters appear when traders step in to buy at the liquidation low.
How to Trade Around Liquidations

So now you know that long liquidations aren’t random. They’re the natural release of built-up buying pressure that couldn’t break through resistance. But how do you trade around them? Is it about predicting chaos? Nope! It’s about reading behavior and using market mechanics to your advantage.
Below is a long liquidation trading guide you can apply in real time:
Pay Attention to Some Core Principles
Don’t try to catch the first flush. The first price decline is influenced by forced exits and has high risk (slippage, fakeouts). You may treat it like hot coals! Additionally, during this time, follow these tips:
| Tips | Explanation |
| Get Trade Confirmation (Not Prophecy) |
signals. |
| Use Liquidation Zones As References |
|
| Size For Volatility |
|
Follow These Steps to Trade Better
Do a pre-trade preparation. You can mark recent highs, lows, and known retail stop clusters where stops are likely to sit. Next, display your liquidation reference levels on the screen (including prior liquidation lows and micro-structure lows) and determine your maximum risk (in dollars or as a percentage) before making any entry.
After completing your pre-trade preparation, follow these steps to execute better trades around liquidation:
Step I: Observe and Watch Order Flow

Look for absorption at:
- Highs (large sell orders taking buys)
or
- Delta divergence (positive delta with flat price).
If you see liquidity pulling or bids disappearing, accompanied by buy exhaustion, be prepared for a fast move.
Step II: Avoid the First Flush
When stops trigger and prices collapse, do not enter immediately. The market can overshoot and produce fake reversals. Let the initial pressure run its course.
Step III: Wait for The Rebuild / Absorption After Flush
Now, look for these four confirmation signals:
- Buyers reappearing at lower prices
- A slowdown in selling
- Visible clusters on Bookmap or a heatmap (bright returning liquidity)
- A delta flip from “negative” back to “neutral/positive”
Read liquidation pressure before the break, not after → Compare Packages
Step IV: Entry Techniques
| I) Scaled Limit Entries | II) Probe Entries | III) Counter-Trend Only with Confirmation |
|
|
|
Step V: Stops and Targets
Place stops outside obvious liquidity just below the liquidation low if targeting a rebound. Next, position size so the dollar risk fits your plan.Your targets could be:
- The first objective is usually mid-range or VWAP.
- Larger targets can be prior high-volume nodes or the pre-liquidation midpoint.
Step VI: Risk Management and Position Sizing
During a liquidation sequence, reduce your position size by approximately 25 to 50 percent % of your normal size. That’s because volatility increases realized losses quickly. Additionally, you can also use smaller stop distances relative to size, such as a smaller size for tighter stops. Follow your fixed risk per trade rule.
Step VII: Post-trade review
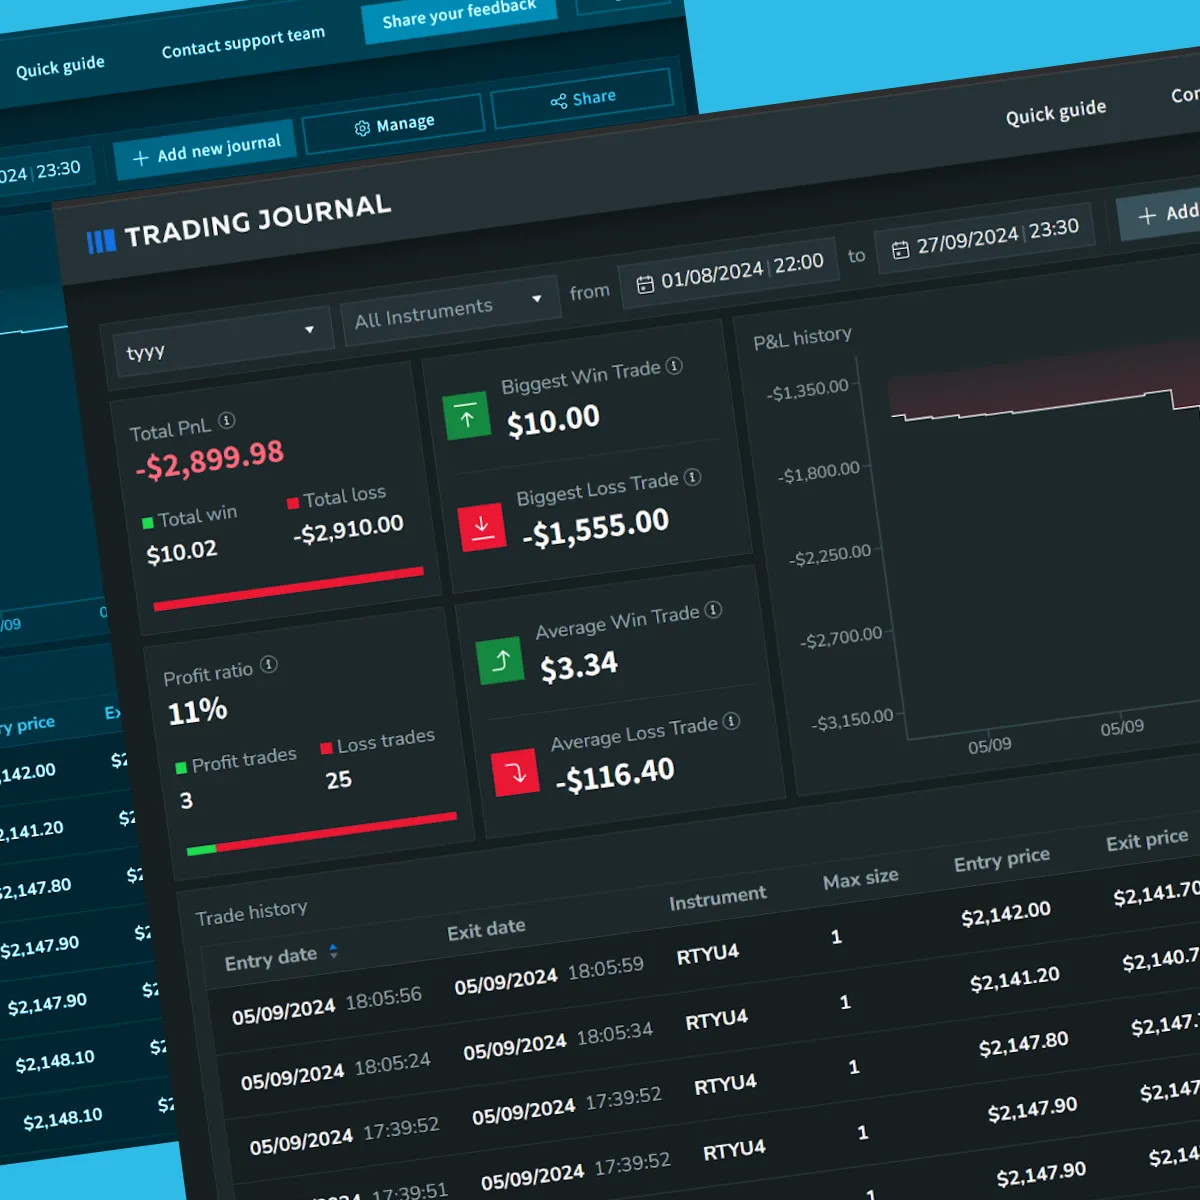
Maintain a trading journal and log what you saw in the order flow, such as:
- Absorption,
- Delta, and
- Heatmap behavior.
Gradually, you’ll learn which signals worked in which contexts. Also, ensure to review and analyze mistakes. By doing this regularly, you can spot patterns in your trading behavior like entering too early, ignoring signals, or oversizing trades. Once you observe those patterns, you can adjust your actions and improve future performance.
Need a checklist before entering a post-liquidation trade? Find it below:
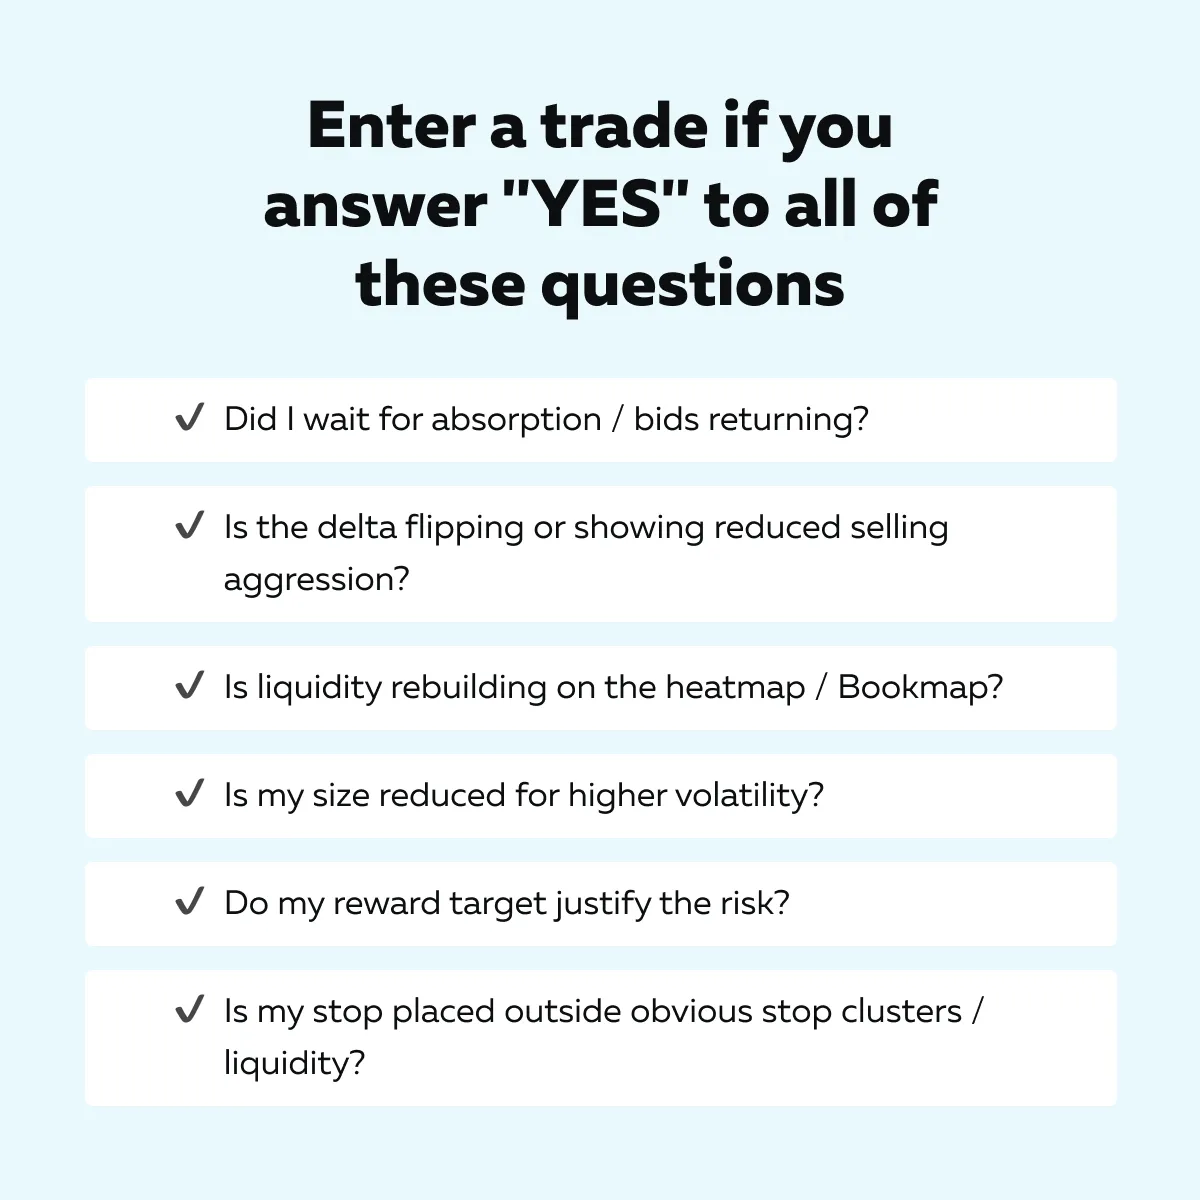
For more clarity, let’s see Tom B.’s approach to long liquidation trading:
- Tom B. often waits for the post-liquidation rebuild.
- He always observes the following:
- Price drops (first flush).
- Bookmap shows a dark vacuum as bids vanish.
- Then, on Bookmap, bright clusters appear as buyers slowly re-enter.
Additionally, he always takes a small and scaled buy only after seeing clear absorption and a delta shift. Then, he manages the size tightly and uses the liquidation low as a reference stop.
Case Study: Liquidation on ES Futures
Let’s understand through a real-world example how a long liquidation trade can happen in the ES futures market and how traders using order flow could have spotted it early:
-
- Let’s say the ES is trading above 4600.
- It shows strong bullish momentum.
- Buyers are aggressive and are lifting offers.
- They are pushing the price higher.
- But around 4605, a wall of hidden sell orders (called iceberg resistance) appears.
- Price can’t move past it.
- Now, this is your first clue – Absorption is happening, and upside strength is fading.
- Next, bids start pulling away near 4595.
- This shows that buy-side liquidity is thinning.
- The first set of stop orders gets triggered below that level.
- As a result, the selling accelerates and the price falls 25 points in seconds.
That’s a textbook long liquidation, where trapped longs are forced to exit. After that, finally, around 4570, the market finds new buyers. At this stage,
- Liquidity rebuilds,
- Selling slows, and
- Signs of exhaustion appear.
There is a high chance that the price may reverse from here.
See trapped longs unwind in real time → Compare Plans
Conclusion
Till now, you must have understood that every long liquidation tells a story of imbalance. Here, trapped longs, fading bids, and failed continuations quietly build tension until the market finally breaks. But the collapse isn’t random. It’s the natural release of pressure that’s been forming beneath the surface.
So, what should traders do? They must learn to read these signs – buy exhaustion, delta divergence, and liquidity changes. Additionally, perform order flow analysis as it gives you a trading edge. It reveals what traditional charts can’t, such as who’s trapped, where liquidity hides, and when momentum is about to flip.
Want to make all this easier? Start using advanced market analysis tools, such as Bookmap. They make everything visible in real time and allow you to trade with 100% clarity, precision, and confidence. See how Bookmap helps identify liquidation pressure in real time before the move begins → Compare Packages.
FAQs
1. What causes a long liquidation?
A long liquidation happens when many traders holding long positions are forced to sell at once. Why? This usually happens because stop-loss orders or margin calls are triggered. This creates a wave of selling that pushes prices down quickly.
2. How can you spot liquidation risk early?
You should watch for warning signs like:
- Strong buying that fails to lift prices,
- Delta staying positive while the price stalls, and
- Bids disappearing below key levels.
These signals often show that longs are trapped and pressure is building.
3. Is every sharp drop a liquidation?
No! A sharp drop becomes a long liquidation only when it follows heavy buying and shows forced selling. Such a market usually shows these signs:
- Sudden volume spikes,
- Liquidity gaps, and
- Quick downward price acceleration.
4. How does Bookmap show liquidation activity?
Using Bookmap, you can visualize market depth in real time. You can see where:
- Buyers pull bids,
- Stops get triggered, and
- New liquidity forms.
This knowledge makes long liquidation patterns clearer and easier to time.
Sign Up Now