See market activity more clearly in real time.
Compare plans to access deeper market visibility for market activity.
Education
October 29, 2025
SHARE
The Psychology of Pullbacks: Why Most Traders Buy Too Early

Pullbacks are the perfect entry points, aren’t they? You always feel tempted to buy that dip, ride the next leg up, and watch profits roll in. But you know the harsh reality!
Most of the time, you jump in too early. Next, you see the price dip farther than expected. But why does this happen so often in the first place? It’s not just impatience or lack of discipline! Instead, it’s a misunderstanding of the psychology of pullbacks. And you are still unaware of the hidden forces behind price movements.
So, want to trade better? In this article, you’ll learn how to read pullbacks with context + spot traps before they catch you. Next, we will tell you how tools like Bookmap can make you see what’s really happening behind the scenes.
Read this article till the end to know when a dip is a real opportunity (not just an illusion).
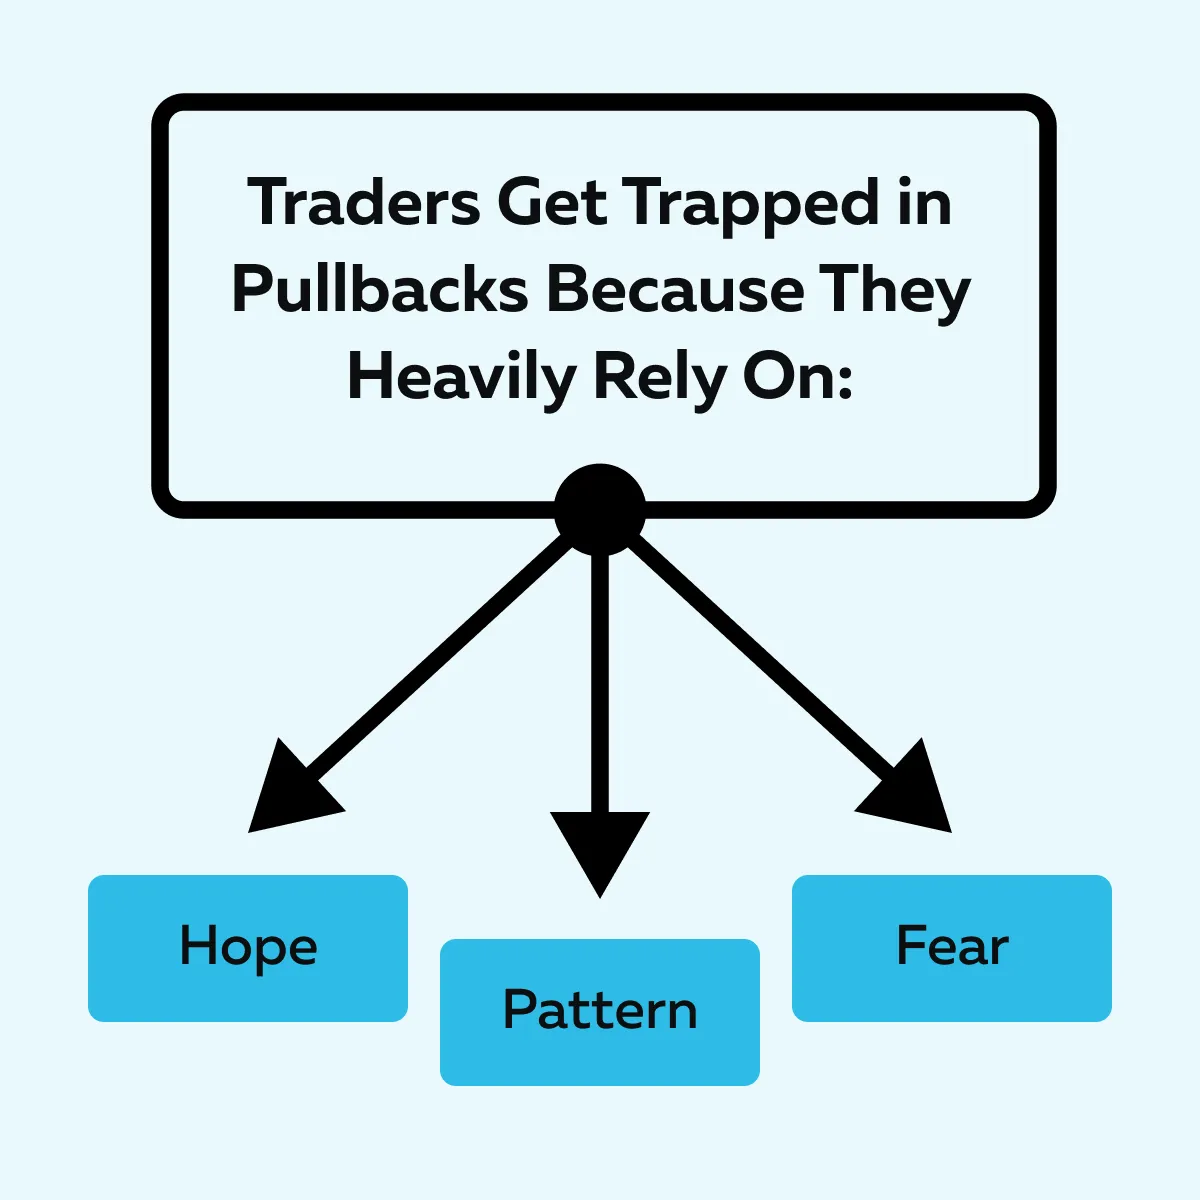
Why Most Pullbacks Feel Like a Trap
Pullbacks are tricky! They often look like a safe entry point. But many times, they aren’t. This wrong interpretation is mostly due to how traders interpret market signals and the psychology of pullbacks. For more clarity, let’s understand the three most common mistakes:
Mistake I: A Pullback Looks like Support (Until It Isn’t)

Many traders focus on fixed levels such as:
- VWAP
- Moving averages
- The prior day’s low
These levels look like strong support, but in reality, they only hold if “real buyers” step in. If there’s no strong demand from these real buyers, what feels like “buying support” can quickly collapse.
Mistake II: Pattern Bias – You Only See What You Want to See

When zooming in on the chart, most traders often see mini bull flags or a clean retest. They assume it signals “strength”. But price structure by itself is not enough! There has to be actual buying interest behind it.
In such situations, usually the brain completes patterns it wants to believe in. The result? You start developing false confidence.
Mistake III: You Have a Fear of Missing the Move
Pullbacks usually happen after a sharp + impulsive run. Now, after this, traders get eager to:
- Catch the next leg higher
and
- Jump in at the very first dip
Okay, but what’s wrong with it? This is often done without checking if the market is truly ready to continue. “Emotional FOMO” takes over and clouds your judgment. This particularly happens when volume isn’t confirming the move. So, you can conclude that:
Want to see what’s really happening during a pullback? Try Bookmap
The Order Flow Behind Failed Pullbacks
Do you know where many traders get caught? It’s when a pullback looks safe but keeps sliding lower. Why? This happens because order flow (the way buying and selling pressure shows up in the market) can make or break a price bounce. For those unaware, order flow can
- Support the bounce if buyers step in strongly
or
- Kill the bounce if sellers keep dominating
Thus, to understand the psychology of pullbacks, it’s not enough to look at price levels or patterns. You also need to see what’s happening in the order book.
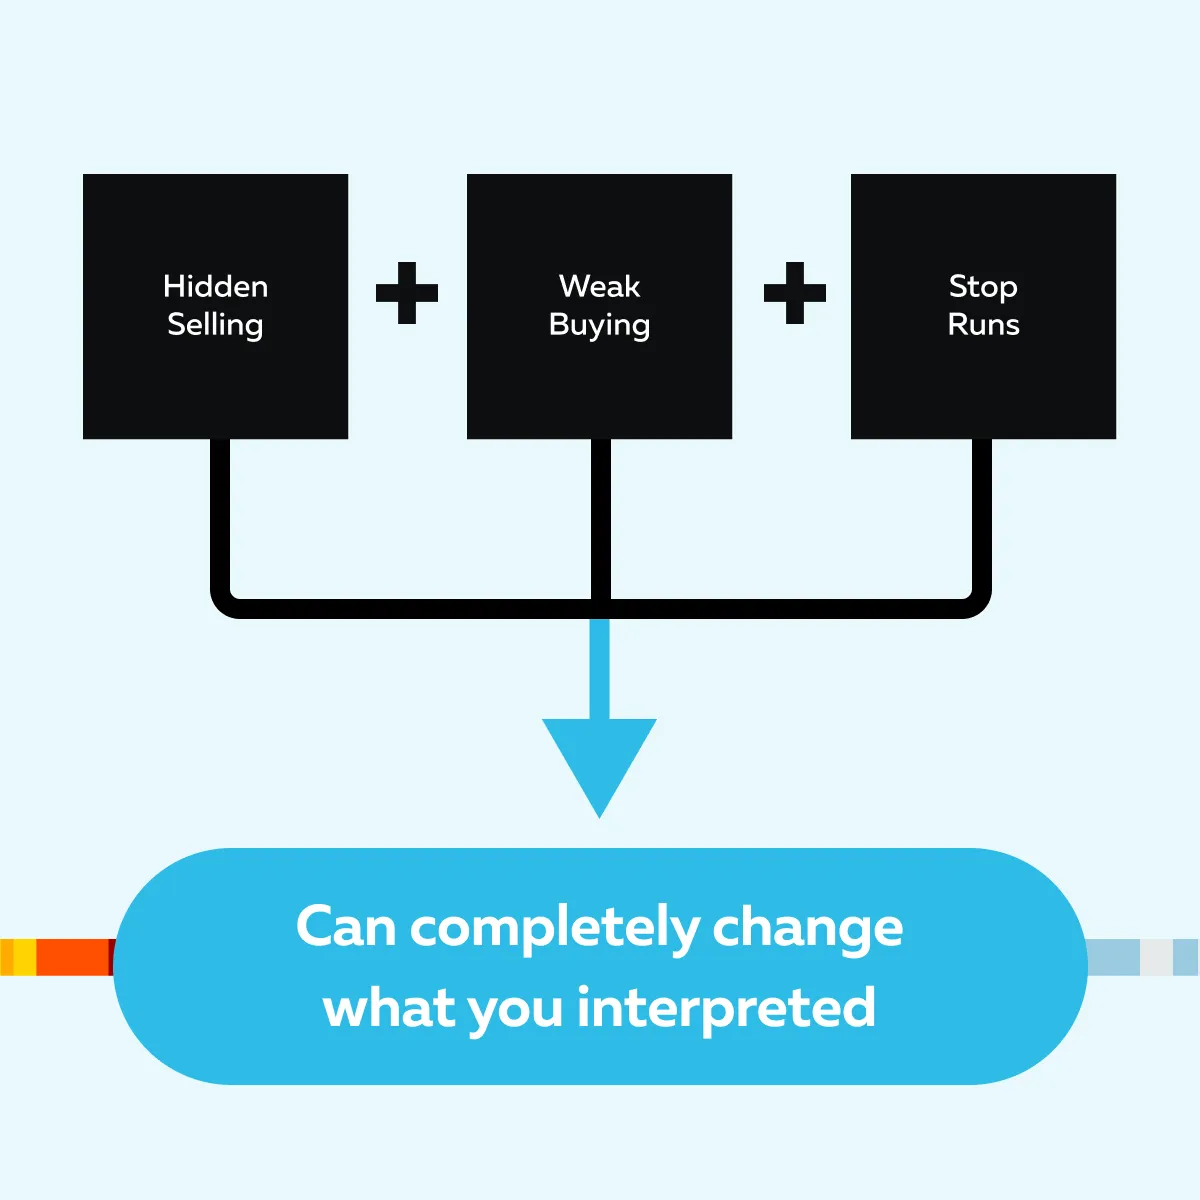
Now, let’s see different cases of how order flow looks at the time of failed pullbacks:
Passive Selling Kills the Bounce
Let’s say sellers remain active on the offer (the side where sell orders sit). Now, every attempt to push the price higher gets absorbed. Even if the chart looks like it’s bouncing, passive selling blocks momentum.
Want to visualize it? On advanced real-time market analysis tools, like Bookmap, this shows up as stacked sell orders or iceberg resistance. As a trader, you interpret it as “The bounce has little chance to succeed”.
Liquidity Gaps Create Fast Moves Down
Sometimes, there just isn’t enough buying support in the order book. Due to the absence of resting bids, the price falls and creates a sharp flush. This traps traders. Let’s see how:
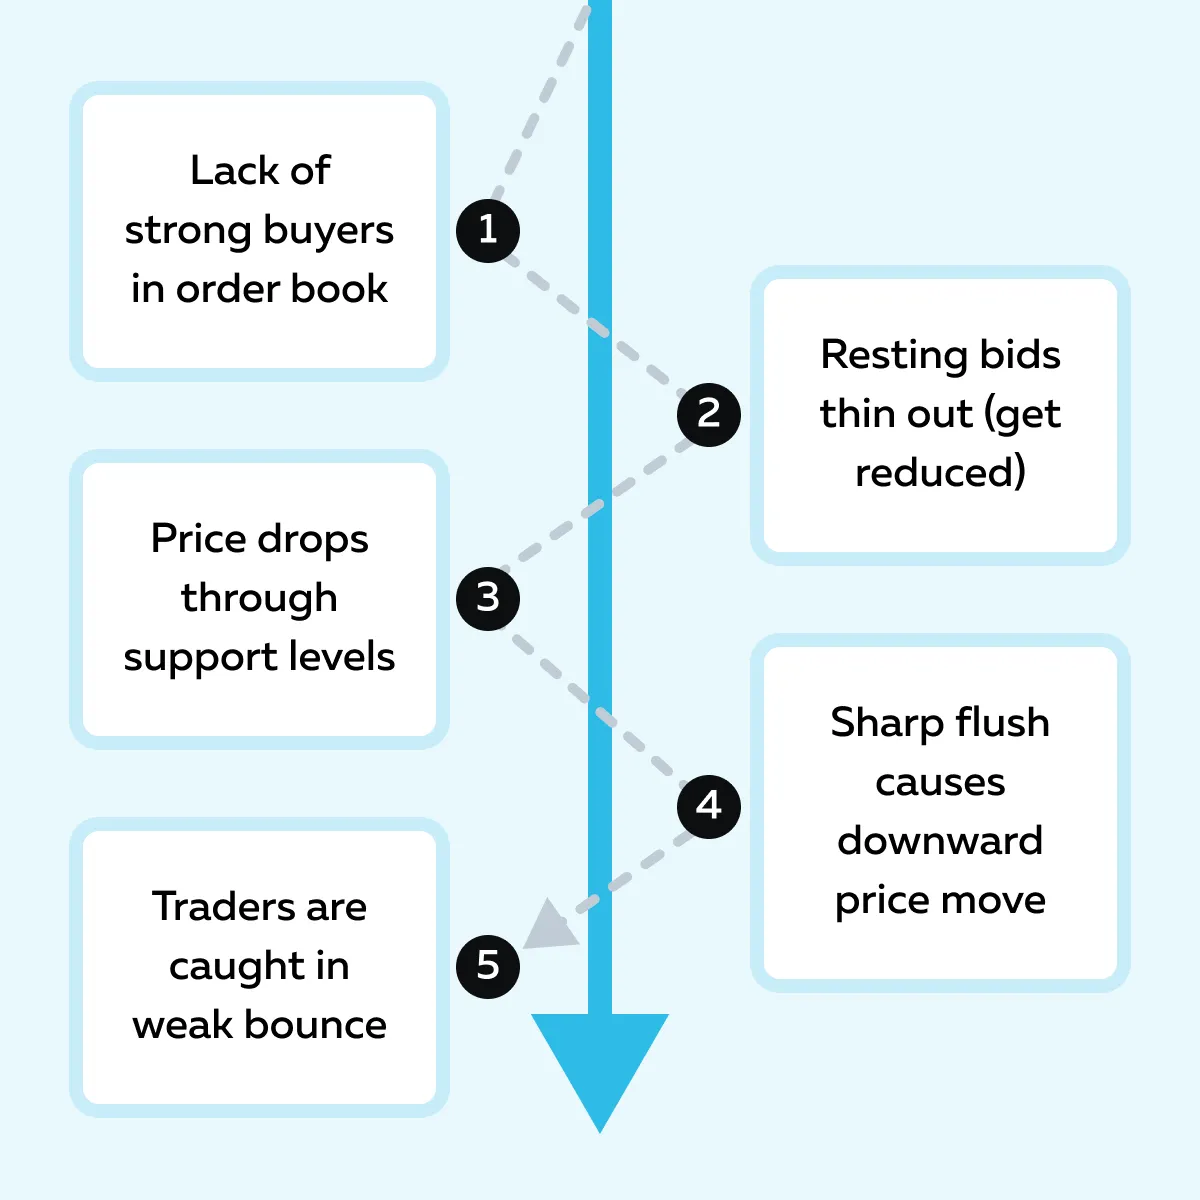
Does this always mean panic? Nope! It just reflects a lack of liquidity. As a trader, if you buy too early in these spots, you often step into empty space instead of “true value zones”.
Stop Runs Deepen the Pullback
Want to know one harsh truth? Big players know where retail traders like you place stop-loss orders. Thus, they usually push the price just below those swing lows. This lets them:
- Trigger stops
- Collect liquidity
- Then reload for the real reversal
So, is the stop run a problem? No! In reality, the real problem is the trap set before the actual bounce. This trap is what catches most small traders off guard.
For more clarity, let’s study an example:
-
- Say the ES futures (S&P 500 E-mini) are trading around 4,800.
- Price runs higher in the morning to 4,820.
- Later, it pulls back toward VWAP at 4,805.
- Now, many retail traders think, “VWAP is strong support, I’ll go long here.”
- So they buy at 4,805.
- They place their stop-loss orders just below the recent swing low (around 4,800).
- Now, big players know this.
- They let the price dip just under 4,800.
- The impact? It triggers all those stop-losses.
- This creates a burst of sell orders (extra liquidity).
During the stop run, you’ll notice on Bookmap that bids are pulling away, and there’s no aggressive buying. As a result, the pullback keeps sliding lower (maybe to 4,795). And later, once stops are flushed + new liquidity shows up, large buyers step in. They absorb the selling. As a result, aggressive buy prints start appearing, and the price bounces back strongly toward 4,810 to 4,815.
How to Read Pullbacks with Context
The psychology of pullbacks is deep! Be aware that a pullback only becomes a good entry when the market shows real buying interest. Otherwise, it’s just a pause that feels like a bottom. You can read the pullbacks by combining:
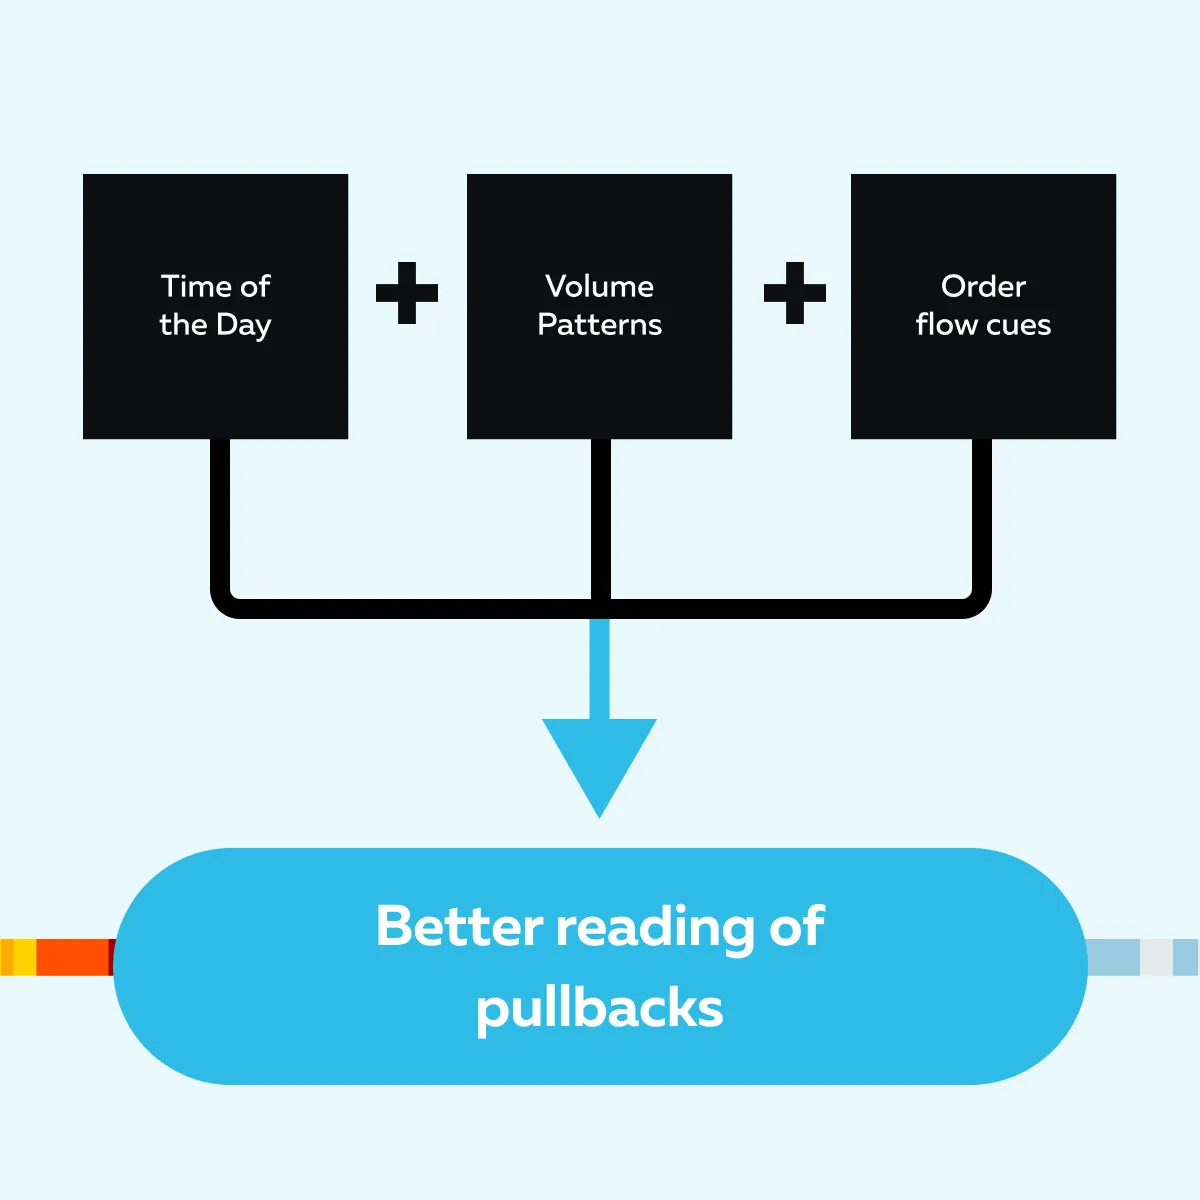
Let’s understand all these factors in detail:
Time of Day Matters
Liquidity changes through the session! In lunch hours and thin-session periods, you will usually see fewer resting orders and wider spreads. Now, understand that a bounce at low participation is more likely to fail. That’s because there aren’t enough genuine buyers to hold the price.
Furthermore, macro events (news releases, economic prints) bring sudden and event-driven liquidity. They can either blow the price through support or create fake reversals.
As a trader, you must treat pullbacks near these times with extra caution!
Volume Behavior is Important
By analysing volume behavior, you can anticipate the nature of a pullback. Let’s see how:
| A Healthy Pullback | A Weak Pullback |
|
|
Thus, in a healthy pullback, selling slows down and buyers take control. In contrast, in a weak pullback, selling grows stronger, and no buyers step in, so the price likely keeps falling.
Look for Real Interest (Not Assumptions)
You should watch these three order-flow signs that show genuine demand:
| Sign I: Iceberg Absorption (hidden bids) | Sign II: Pulling Offers | Sign III: Aggressive Buy Prints (market buys at the offer) |
|
|
|
So, when you see absorption + aggressive buy prints near a logical support (swing low, VWAP, etc.), the pullback has a much higher chance of reversing. Need a checklist to avoid the trap? Paste these steps in your trading journal:
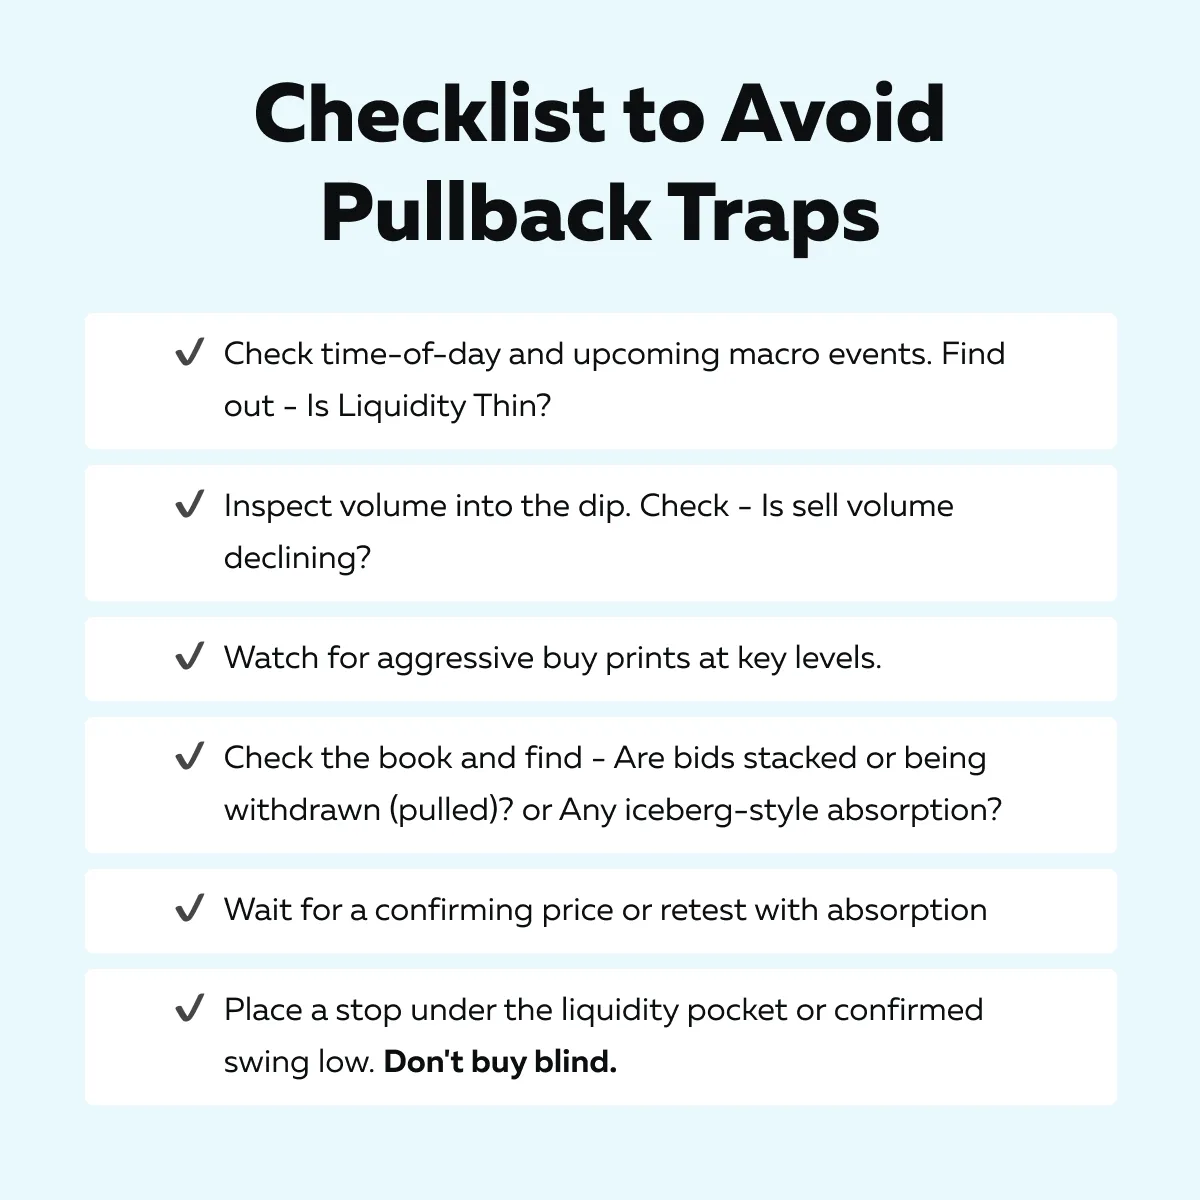
Don’t guess where the bounce happens—watch liquidity form in real time
How to Stop Buying Too Early
Want to know one of the biggest mistakes traders make? It is jumping into a pullback too quickly! The psychology of pullbacks tricks people into thinking they’re getting the perfect entry. But that’s just too early! Let’s see how you can avoid this trap:
Wait for Confirmation (Even if it Feels Late)
Many failed trades happen because traders try to catch the very bottom. Thus, instead of doing so, wait for the proof that buyers are stepping in. These proofs are:
- Aggressive buying
- Holding bids
- Volume turning up
Do you think this waiting might make you enter at a slightly higher price? Not an issue! It’s always safer to wait for proof that buyers are actually in control.
Use Pullbacks As Context (Not Signal)
A pullback by itself doesn’t mean “buy.” It’s just a pause in price. Thus, treat it as an opportunity, but only act when order flow + volume confirm support.
Instead of buying the very first dip into a support level (which might fail), you should wait until the level is tested once and actually holds. After that, start adding to your position. For example:
- Let’s say ES futures fall from 4,820 to 4,805 (VWAP).
- On the first dip to 4,805, the price keeps sliding lower to 4,800. The first test fails!
- On the second dip to 4,800, buyers step in, and aggressive buying appears.
- Now, the support is confirmed.
- Here, you begin scaling in (buying part of your position).
So, don’t gamble on the first touch. Wait for proof that the level can actually hold, then build your position gradually.
Know When to Sit Out
Not every pullback is worth trading! You should stay flat if:

Remember – “Protecting capital is also a strategy”. And sometimes the best trade is no trade at all.
Conclusion
So, till now, you must have understood that pullbacks are natural and not traps by default. But they often feel like traps when you act on assumptions and don’t wait for clear evidence. The psychology of pullbacks can create:
- Impatience
- Bias
- Fear of missing out
All three lead to poor entries! Understand that a true reversal is only when there is declining sell volume + real buyer interest. You should not anticipate a reversal just because the price touches a moving average or prior low.
Want to develop a trading edge? You should start reading the order flow. This analysis lets you separate weak bounces from genuine turning points. Furthermore, by using advanced real-time market analysis tools, like Bookmap, you can get a 100% transparent view of what’s happening behind the scenes.
On Bookmap, you can check whether bids are being pulled, sellers are stacking the offer, or icebergs are holding a level. Pullbacks aren’t random—Bookmap shows you when real buyers step in.
FAQs
1. Why do pullbacks often go deeper than expected?
The reason is that most traders assume old support levels (like moving averages or yesterday’s low) will automatically hold. But price doesn’t stop unless real buyers are active at that level.
If there isn’t enough liquidity or demand, the market keeps falling until new buyers step in. That’s why relying only on lines or static levels often misleads traders.
2. How can I avoid buying too early during a pullback?
The key is patience! Instead of buying the moment the price dips, you should wait for proof that buyers are stepping in. Some common proofs you can consider are:
- Hidden buying (iceberg orders)
- Sellers are pulling their offers
- Aggressive buying on the tape
These signals mean the market is showing interest. Always remember that jumping in too early just because a line is touched is often a trap!
3. What tools help confirm a pullback is bottoming?
A chart alone doesn’t show the full story! You should use real-time tools like Bookmap to see:
- What’s happening inside the order book
and
- Where real buyers and sellers are placing orders
Additionally, you should look for these signs:
- Strong bids that don’t disappear
- Iceberg orders absorbing selling
- A change in volume where buyers become more aggressive
These clues signal that the pullback may be ending.
4. Do stop runs always mean a reversal is coming?
Not always! Stop runs happen when big players push the market just far enough to trigger retail traders’ stop losses. This creates liquidity that they can use for entries. Sometimes the price keeps falling even afterwards.
But there are several signs that show the market has flushed out weak hands and is ready to reverse. These are:
- Strong buying
- Higher bids
- Renewed liquidity
5. What’s the biggest mistake traders make in pullbacks?
The biggest mistake is assuming that history will repeat itself! They think that price will bounce just because it bounced there before or “should” bounce at a certain level.
But traders must realize that every pullback is unique. It is influenced by who’s active in the market at that time. Thus, instead of trusting patterns alone, traders should analyze order flow and volume behaviour. Such an analysis allows traders to see if real buyers are stepping in.
Sign Up Now