See implied liquidity more clearly in real time.
Compare plans to access deeper market visibility for implied liquidity.
Trading Basics
February 4, 2026
SHARE
Implied Liquidity: How Price Structure Suggests Where Size Might Appear

Do you know what most traders do? They chase the price after it moves. Professionals, however, do the opposite. They wait at levels where history, structure, and trader psychology suggest something important is about to happen.
Most importantly, they look for “market clues,” such as repeated reversals, failed breakouts, volume pockets, and unfinished moves. Those clues reveal where buyers or sellers are likely waiting.
Want to trade like them? In this article, you will learn how to read those signals and how to mark high-probability liquidity zones. Also, you will understand how to use Bookmap and confirm when “hidden interest” transforms into “real participation”.
What Is Implied Liquidity?
Implied liquidity means traders expect buying or selling interest to appear at a certain price level. This assumption is created even though no large orders are visible yet. Okay, but why? Let’s understand this in detail.
The Foundation of Implied Liquidity Trading

The concept is rooted in how large market participants, such as banks, funds, and institutions, operate. They rarely show their full intentions in advance. Reason? If they placed all their orders in the open, other traders would:
- React to them
+
- Push the price away
So instead, they wait. Their orders often only appear once the price reaches a level they consider important. Now, that is the foundation of implied liquidity trading. As a trader, you must read where liquidity is likely to show up rather than where it is currently displayed.
Where Does Implied Liquidity Develop?
In most cases, it forms at important price zones, such as:
- Previous swing highs or swing lows,
- The top or bottom of a trading range,
- Failed breakout areas, and
- Levels where many traders are trapped in losing positions.
But why these areas? Most traders remember these price zones. If the price turned around there before, many market participants expect it to happen again.
For more clarity, let’s study an example:
Suppose the E-mini S&P (ES) reversed three times near 4560. Even if there are no large buy orders showing at that price, traders assume buyers may step in again. Now, that expectation creates implied liquidity.
Later, when the price returns to 4560, buying is likely to appear as many traders were already watching that level.
Read the market’s intentions through structure, not just visible orders → Compare Plans.
Why Liquidity Is Often Hidden Until Tested
Do you know how modern markets function? Most large traders do not place all their orders in the open. That’s because if they show their full size too early, other traders will react to it. That leads to:
- Front-running (others jumping ahead of the order)
+
- Slippage (getting a worse price)
Now, to avoid this and maintain better pricing, institutions wait until the price reaches a level they care about. At that price, they start to buy or sell in size. Want to know how this hidden behavior shows up? Check out the three prominent ways below:
| I) Iceberg Orders | II) Algorithmic Timing | III) Conditional Participation |
|
|
|
For a better understanding, let’s study an example:
Assume that you are using an advanced market analysis tool like Bookmap. On it, you see the price moving toward a previous high with very little resistance. You interpret that the market can go higher.
But the moment the price touches that old high, a “large sell wall” suddenly appears. Do you think that wall was random? Nope! That level already had meaning in the market. The liquidity was “implied” by the structure and only became visible once the price tested it.
This is why experienced traders try to find out where liquidity is likely to appear. They do not focus on where it is visible right now.
How to Identify Implied Liquidity Through Price Structure

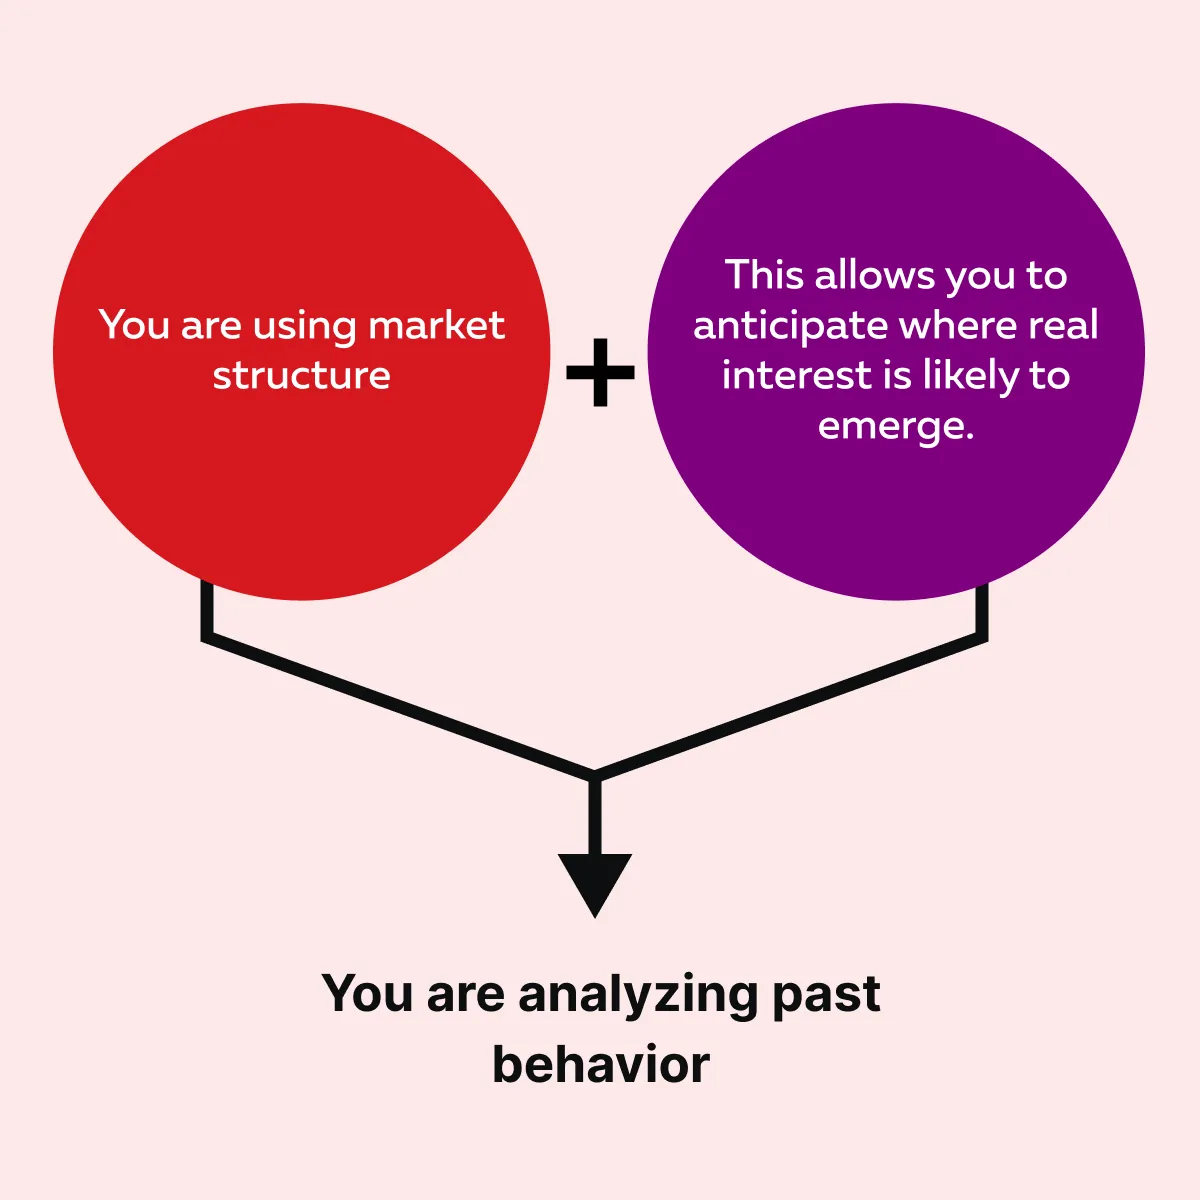
Most traders think they need to see large orders on a heatmap to know where liquidity is likely to appear. But that’s a myth because price itself leaves clues! By studying how the market behaved at certain levels in the past, you can estimate where buyers or sellers may step in again.
And while making this analysis, you may look for the following six indicators:
1. Repeated Reaction Points
When the price turns around at the same level multiple times, it shows that strong players are active there. Each reaction means that buyers or sellers defended that price. The more often a level holds, the more important it becomes.
Over time, this creates implied liquidity. Even if you do not see large orders on the book, traders expect that interest will appear again when the price returns to that level.
Example
- Let’s say ES forms a triple bottom near 4530.
- Now, it means buyers stepped in three times to prevent the price from falling further.
- On the next test of 4530, many traders will expect buyers to defend it again.
- That expectation is implied liquidity.
2. Unfinished Business
Sometimes, the price moves too fast through an area. In such zones, there is:
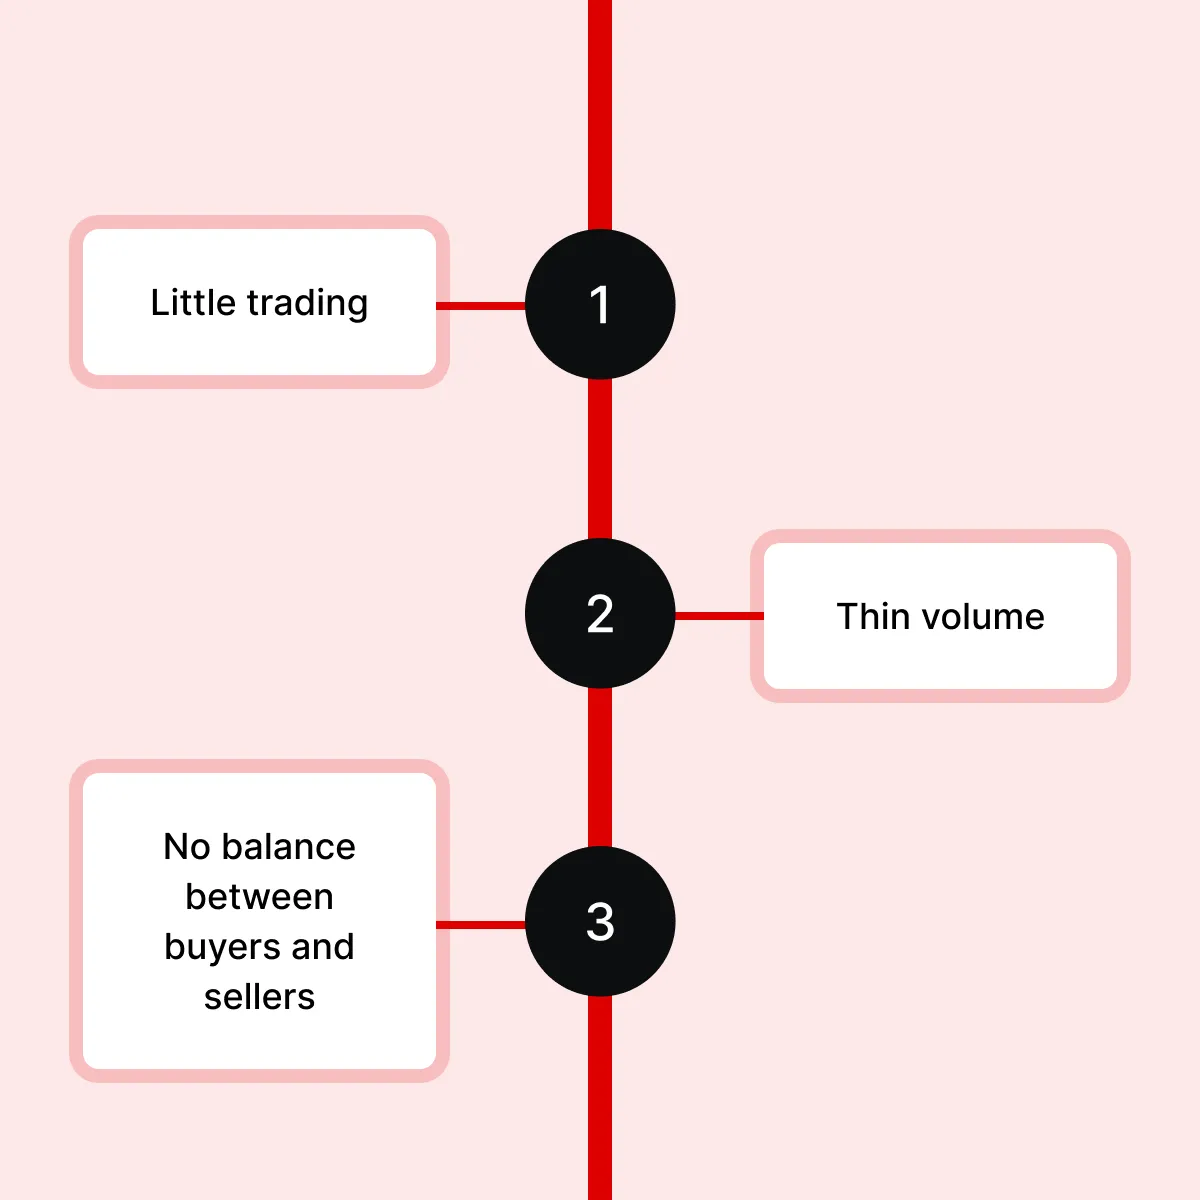
This creates what traders call “unfinished business.” Markets usually revisit these zones. And when they do, new liquidity tends to appear as traders use that area to enter or exit positions.
Example
-
- Suppose ES breaks quickly from 4580 to 4600.
- And very little trading takes place in between.
- When price pulls back, traders often look to 4580 as a place to step in.
- Buyers or sellers may step in there, even if nothing is visible in advance.
- That level holds implied liquidity because of the “earlier imbalance”.
3. Trapped Positioning
Always remember that “trapped traders” create future liquidity. That’s because when a breakout fails, or a strong move suddenly reverses, one side gets stuck in losing positions. And those traders remember that price level.
When price returns, they often act again to exit or defend, which creates implied liquidity.
Example
-
- Let’s say price breaks above a high and then drops back below it.
- Now, many traders who bought the breakout are trapped.
- When price revisits that level, they may sell to get out.
- This creates implied sell liquidity at that price.
4. Prior Absorption or Iceberg Zones
Sometimes, the price reaches a level and keeps getting absorbed rather than moving further. This happens because large hidden orders, such as iceberg orders, were active there.
Those traders care about that level. As a result, when the price comes back later, they are likely to defend or re-enter. That history creates implied liquidity at the same price.
5. Round Numbers and Psychological Anchors
Clean numbers like 4500, 4550, or 4600 attract attention. Institutions and large traders often place orders around these levels because they are easy to track and manage.
Even if nothing is visible yet, these prices act like magnets. Traders expect activity there, making them common zones for implied liquidity.
6. Volume Clusters and Balance Edges
When price trades sideways and builds significant volume, it forms a “balance area”. Now, the top and bottom of that area are important. Why? That’s because they mark where buyers or sellers previously stopped the price from moving further.
Later, when the price returns to those edges, traders expect interest to reappear. That creates implied liquidity at those boundaries.
Confirming Implied Liquidity with Order Flow
Do you think finding a level on the chart is enough? Nope! It is only the first step. In implied liquidity trading, you also need to see how the market behaves when the price actually reaches that level. Okay, but how? You must start using advanced order flow tools like Bookmap. They let you see when hidden interest turns into real and active trading.
Let’s assume that on Bookmap, you observed that the price has moved into a zone where you expected implied liquidity. Now, you should watch for these four signs:
| Order-Flow Signal | What You See on the Chart | What It Means | Why It Confirms Implied Liquidity |
| I) Liquidity appears suddenly | New buy or sell orders quickly stack up at the level when the price gets close. | Large traders were waiting for this price before placing size | The level already had implied liquidity; now, it becomes visible. |
| II) Absorption | Price trades into the level but does not move past it. | A bigger participant is absorbing aggressive buyers or sellers. | Hidden liquidity is defending the level. |
| III) Delta shifts | Delta flips direction near the level, i.e., buying turns to selling (or vice versa). | Control changes from one side to the other. | Trapped traders and institutional orders are being activated. |
| IV) Faster reactions | Sharp bounces, quick rejections, or rapid rotations occur at the level | Real participation enters the market. | It confirms the zone was not random but structurally important. |
Okay, but what is the importance of these order-flow signals? Usually, when they appear together, it can be confirmed that:
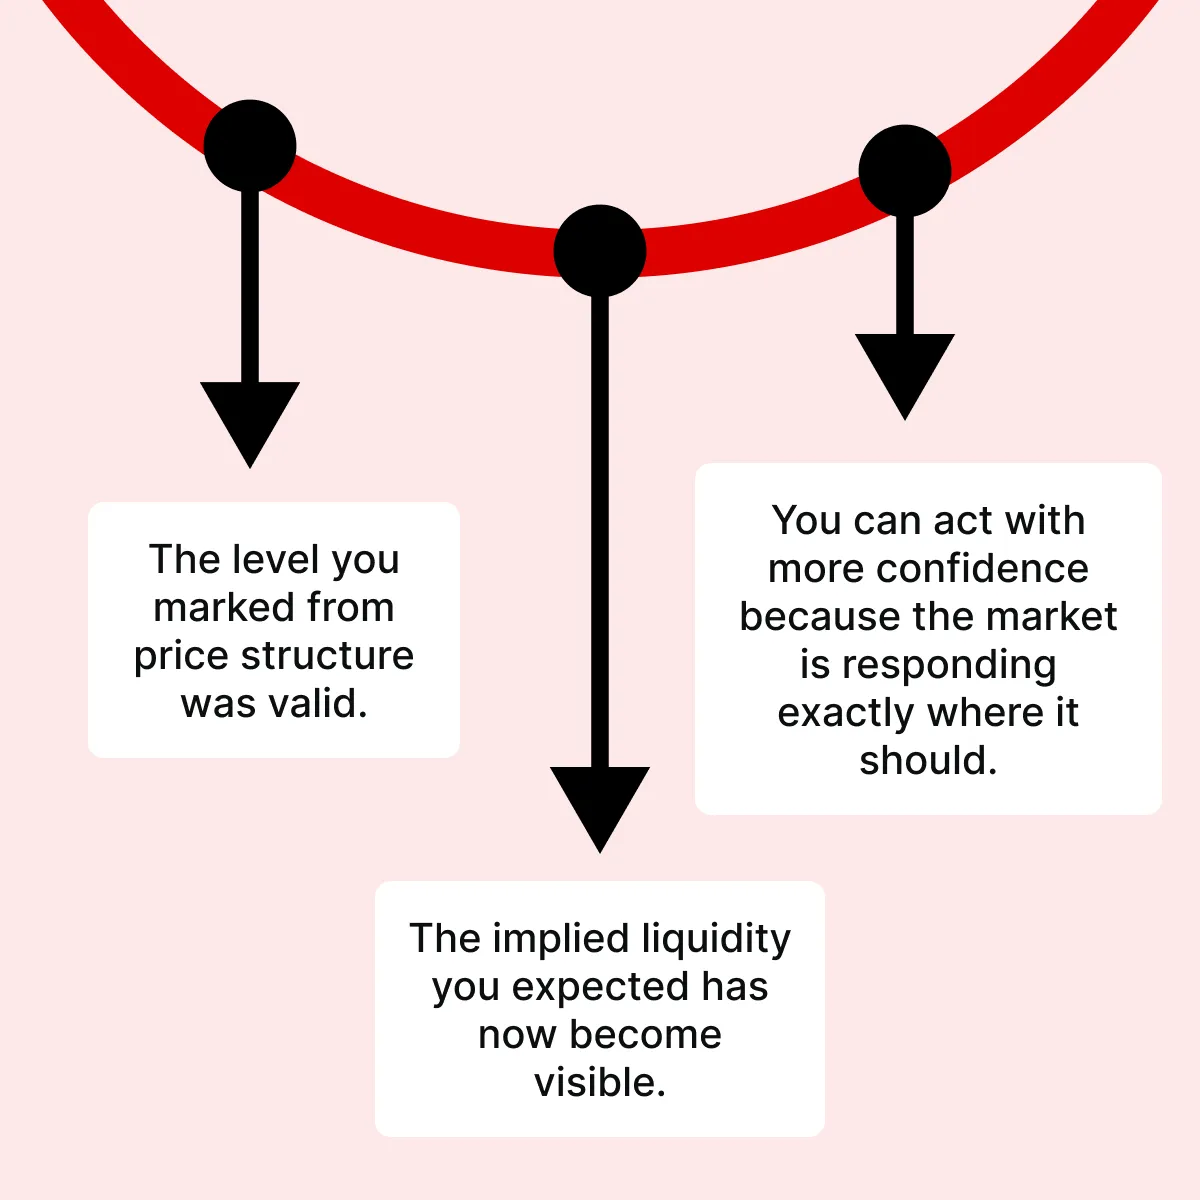
See how implied and visible liquidity interact in real time with Bookmap → Compare Packages.
Using Implied Liquidity for Trade Planning
How does implied liquidity change how you plan trades?
- You stop chasing price after it has already moved.
+
- You prepare in advance for where buyers or sellers are likely to step in.
This is the core advantage of implied liquidity trading. You start acting at important levels and not in the middle of random movement. Let’s see how traders use it:
- For Entries
-
-
- Rather than buying or selling in the middle of a move, you wait for the price to reach a zone where you expect liquidity to appear.
- Then you look for order-flow confirmation, such as new bids or offers showing up.
- This allows you to enter closer to the real decision point in the market.
-
- For Targets
-
-
- You can project where the price may react before it gets there.
- Structural highs, lows, and unfinished price zones often attract liquidity.
- These make “natural areas” to take profits because the price may stall or reverse there.
-
- For Risk
-
-
- Stops are best placed beyond implied liquidity zones.
- These areas usually have:
- Noise,
- Quick tests, and
- Temporary breaks.
- Placing a stop just beyond them saves you from getting taken out by normal market probing.
-
- For Trade Management
-
- When visible orders appear at a level you already marked as important, it confirms your idea.
- At that point, many traders take partial profits or tighten stops around that structure.
For more clarity, let’s study an example:
Assume that you expect to buy near 4500. Now, as the price reaches it, you see bids appear, and delta turns positive. That is a strong signal. It shows that the:
- Trade was planned around implied liquidity
and
- It was not triggered by a sudden price move.
Conclusion
By now, you know how to interpret “implied liquidity” the next time. You will instantly remember that the market has memory and prices do not move randomly. Instead, they respond to levels where traders acted before. By studying those reactions, you can forecast where buying or selling is likely to appear again.
Usually, when the price reaches a key level, visible orders and order flow confirm what the structure already suggested. How? They present these signs – bids stack up, offers absorb, and delta shifts. These signs confirm that the hidden intent is becoming visible.
So, want to connect this structure to real-time behavior? You can start using Bookmap. It lets you watch liquidity form, defend, or fail right where you expected it. Learn to anticipate where liquidity might appear before it becomes visible → Compare Packages.
FAQs
1. What is implied liquidity in trading?
Implied liquidity means expecting buyers or sellers to appear at a particular price level, even though you cannot see their orders yet. This expectation comes from how the price behaved there before.
If the price reacted strongly at a level in the past, traders assume large players may act there again. That expected interest is implied liquidity.
2. Why does implied liquidity matter?
Large traders do not show their full orders early. They wait for the price to reach a level they value. If you can identify those levels in advance, you can plan trades before the real buying or selling starts. The advantage? Such a proactive approach prevents you from chasing price and lets you trade closer to where big decisions are made.
3. How can you identify implied liquidity?
You can find it by studying the price structure. Ideally, you should look for levels where:
- Price reversed many times,
- Breakouts failed,
- Price moved too fast, and
- Heavy volume stopped the price before.
These areas show where traders were active in the past, so they are likely to be active again.
4. How does Bookmap help confirm implied liquidity?
Bookmap shows “when” hidden orders suddenly appear. When the price reaches a level you marked, you may see:
- New bids,
- New offers,
- Absorption, and
- Delta changes.
These signals indicate that real traders are now active at that price. This confirms that the implied liquidity you expected is actually there.
Sign Up Now