See real time more clearly in real time.
Compare plans to access deeper market visibility for real time.
Education
February 3, 2026
SHARE
Stock Trading Tools with Real-Time Data: How Modern Traders Monitor Markets
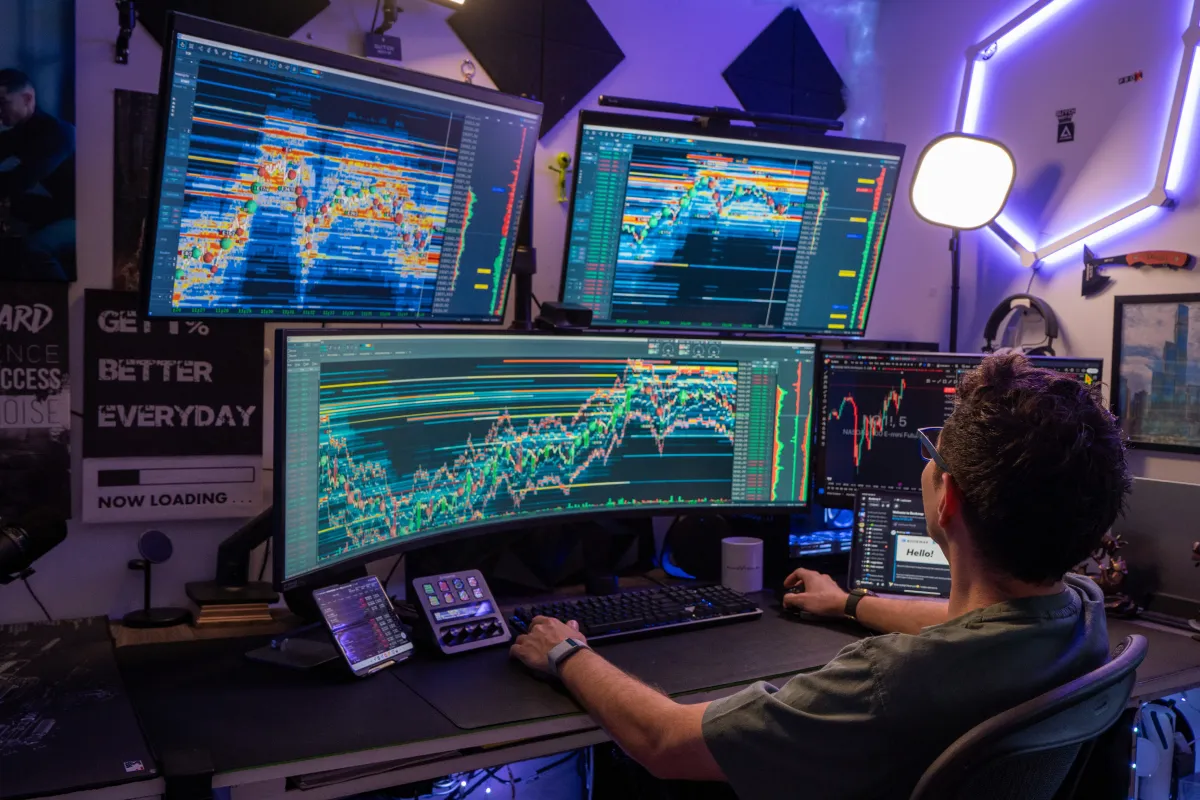
Stock trading tools with real-time data have become essential for traders who need immediate visibility into price movement, liquidity, and execution conditions. As markets move faster and competition increases, delayed quotes and static charts no longer provide enough context to make informed decisions.
Real-time stock data allows traders to monitor price changes as they occur, react to liquidity shifts, and manage risk more precisely. Whether you are an active equity trader, a longer-term investor, or a professional managing larger positions, access to live market information plays a critical role in execution quality and decision-making.
This guide explains how real-time stock trading tools work, what types of data they provide, and how traders use them to understand market behavior more clearly.
What Are Stock Trading Tools with Real-Time Data?
Stock trading tools with real-time data are platforms or software systems that stream live market information directly from exchanges or approved data sources. Instead of relying on delayed price updates, these tools show current prices, active bids and offers, executed trades, and sometimes full market depth.
Common examples include:
- Live equity data software used for monitoring price action
- Real-time share market platforms designed for execution and analysis
- Instant stock price monitoring tools that update continuously during market hours
Unlike end-of-day or delayed feeds, real-time data reflects what is happening in the market at that exact moment. This distinction is critical during volatile periods, news releases, or high-volume trading sessions.
Why Real-Time Stock Data Matters for Trading
Real-time data is not just about seeing the latest price. It affects how trades are executed and how risk is managed.
When prices update instantly:
- Traders can avoid entering trades based on outdated information
- Slippage risk is reduced, especially during fast moves
- Liquidity conditions are easier to assess before placing an order
Markets are dynamic. A stock that appears liquid on a delayed chart may actually be thinning out in real time. Without live data, traders may not see spreads widening, liquidity pulling, or aggressive orders entering the market.
Types of Real-Time Stock Market Data
Not all real-time stock data is the same. Different tools provide different levels of detail depending on the data feed and platform design.
Real-Time Price Quotes
These show the current traded price, along with the best available bid and ask. This is the most basic level of real-time data and is often sufficient for casual investors.
Level 2 Market Data
Level 2 data displays multiple bid and ask levels beyond the best price. This reveals where liquidity is stacked and how supply and demand are distributed across prices. Traders who focus on short-term execution often rely on this view.
Time and Sales
Time and sales data shows each trade as it executes, including price and size. This helps traders understand trade flow and participation intensity.
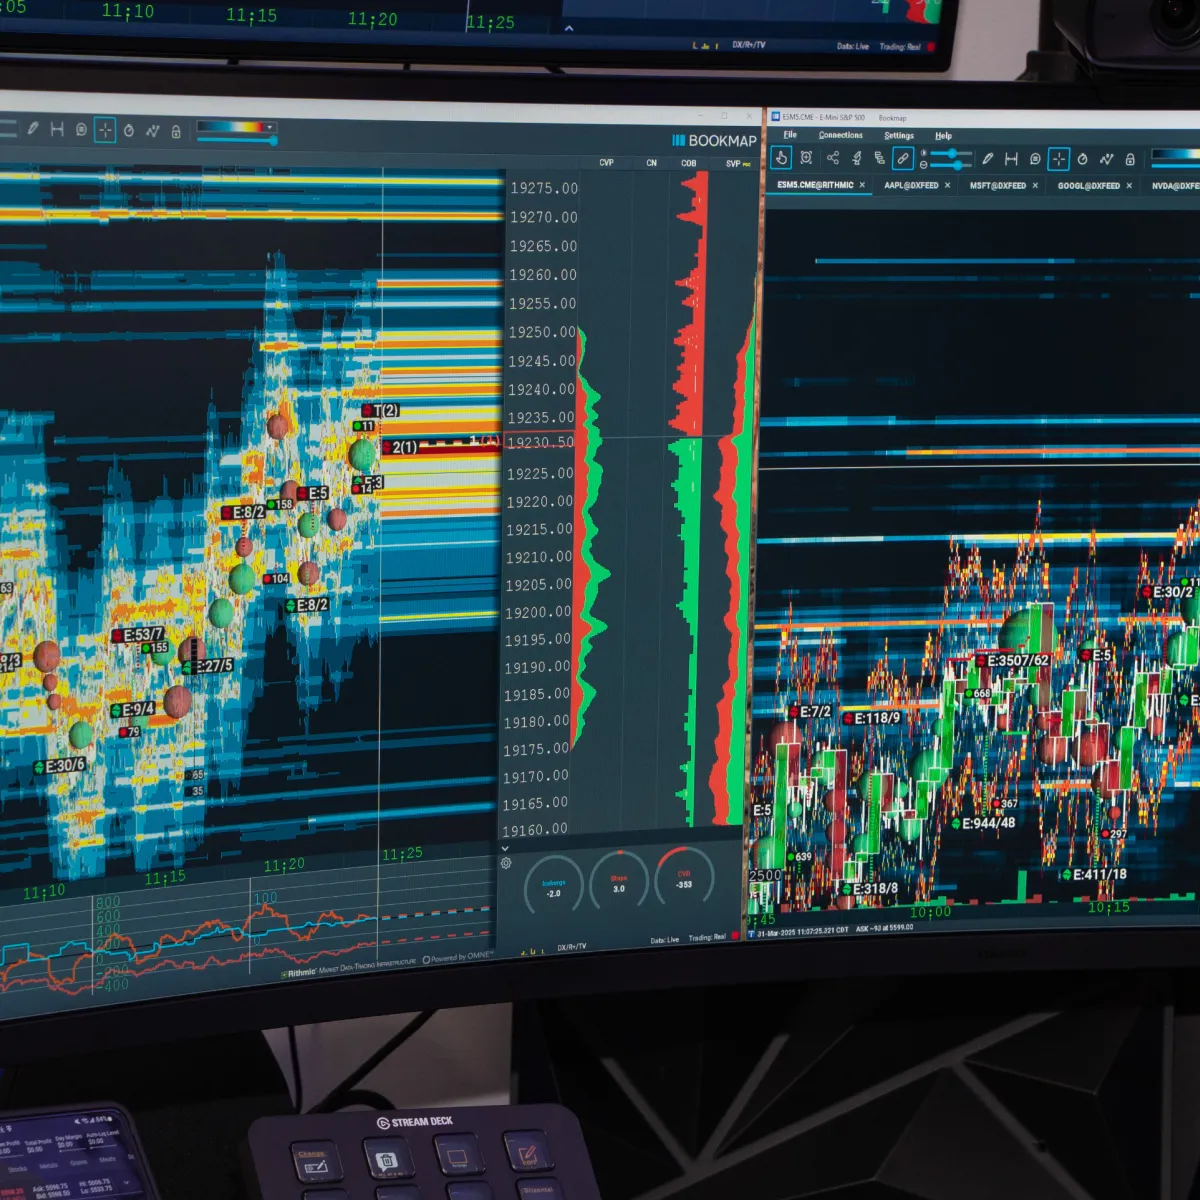
Market Depth and Order Book Data
More advanced stock trading tools visualize how the order book evolves over time. This includes changes to resting orders, cancellations, and executions. These insights help traders interpret intent rather than just outcome.
Live Equity Data Software vs Basic Charting Tools
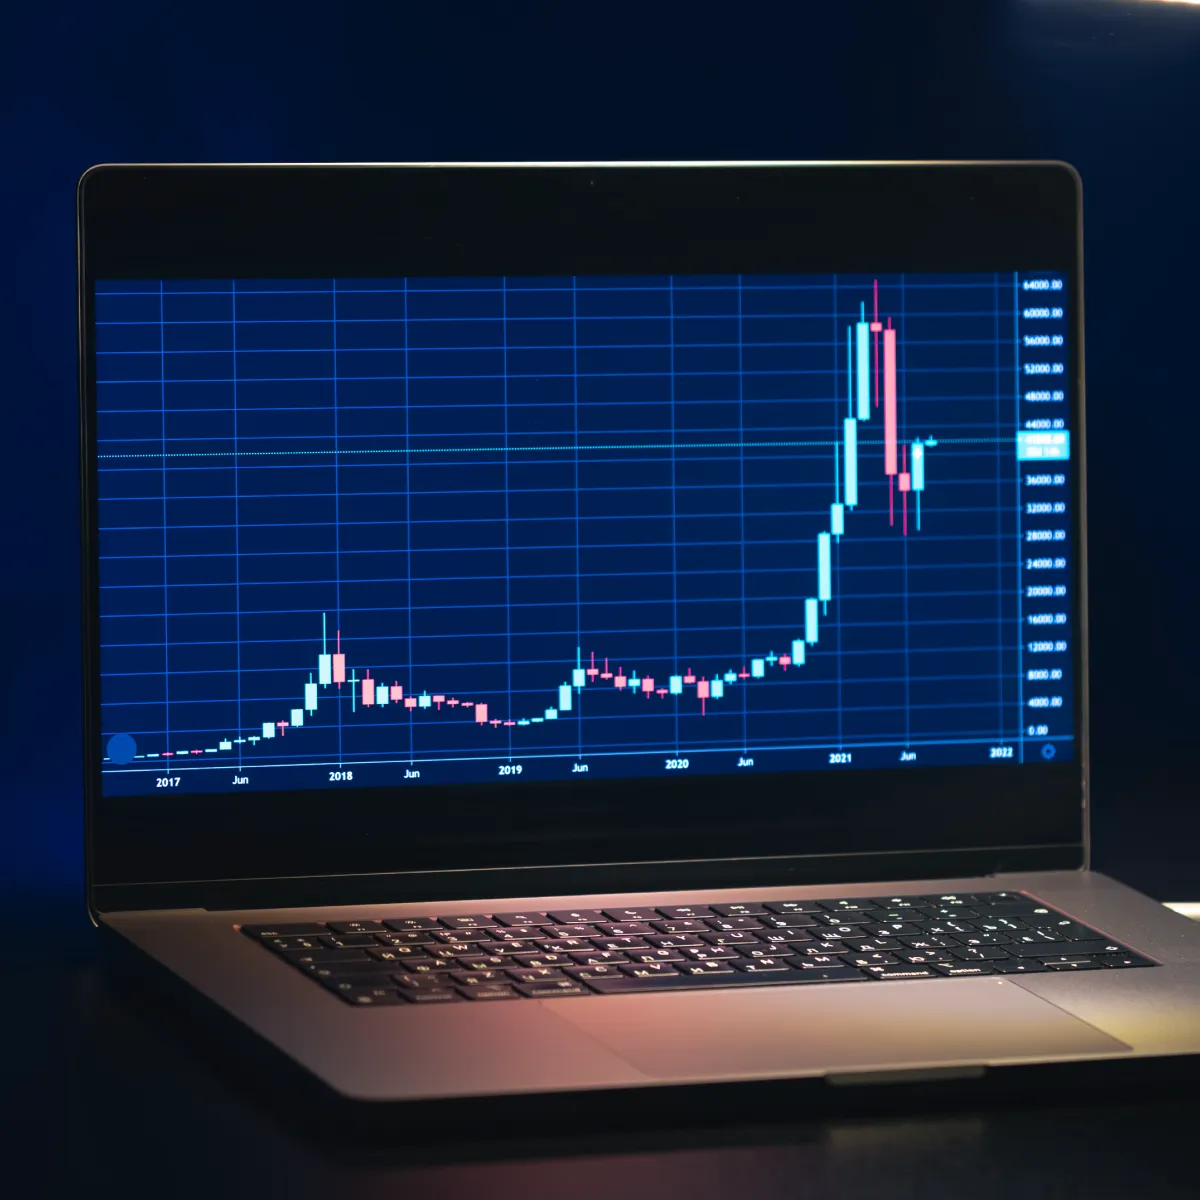
Basic charting tools often rely on aggregated or delayed data. While useful for higher-level analysis, they lack the resolution needed for precise execution.
Live equity data software focuses on:
- Continuous data updates
- Real-time interaction between buyers and sellers
- Visibility into liquidity behavior
This difference becomes especially important during high-volume periods or when trading around key price levels.
How Traders Use Real-Time Data in Practice
Monitoring Liquidity Conditions
Real-time tools allow traders to see whether liquidity is holding, pulling, or being consumed. This helps avoid entering trades when conditions are unstable.
Managing Trade Execution
By observing spreads and order flow, traders can choose between market orders and limit orders more effectively. This reduces unnecessary costs.
Responding to Volatility
When markets move quickly, delayed data can create false signals. Real-time monitoring helps traders react to actual market behavior rather than lagging indicators.
Best Low-Latency Trading Data Providers in 2026

Low latency refers to how quickly data travels from the exchange to the trader’s platform. For active traders, even small delays can impact execution.
Professional environments often prioritize:
- Direct exchange feeds
- Optimized data routing
- Stable, high-throughput infrastructure
Many institutional-grade tools focus on reducing latency to support fast decision-making and precise execution.
Free vs Paid Real-Time Stock Data
Some platforms offer free real-time stock charts for desktop use, while others require paid subscriptions.
Free data may include:
- Real-time last price
- Basic bid and ask information
Paid services typically offer:
- Full Level 2 market depth
- More reliable low-latency feeds
- Coverage across multiple exchanges
The choice depends on how actively a trader participates and how sensitive their strategy is to execution quality.
Financial Market Analytics Software and Trading Infrastructure
Beyond individual tools, real-time data is part of a broader trading infrastructure. Financial market analytics software combines live data with visualization, analytics, and execution tools.
This infrastructure supports:
- Investment research technology used by professionals
- Trading infrastructure solutions designed for high-volume environments
- Integrated analysis of price, volume, and liquidity
Rather than focusing on a single indicator, modern platforms aim to show how different market forces interact in real time.
Real-Time Monitoring
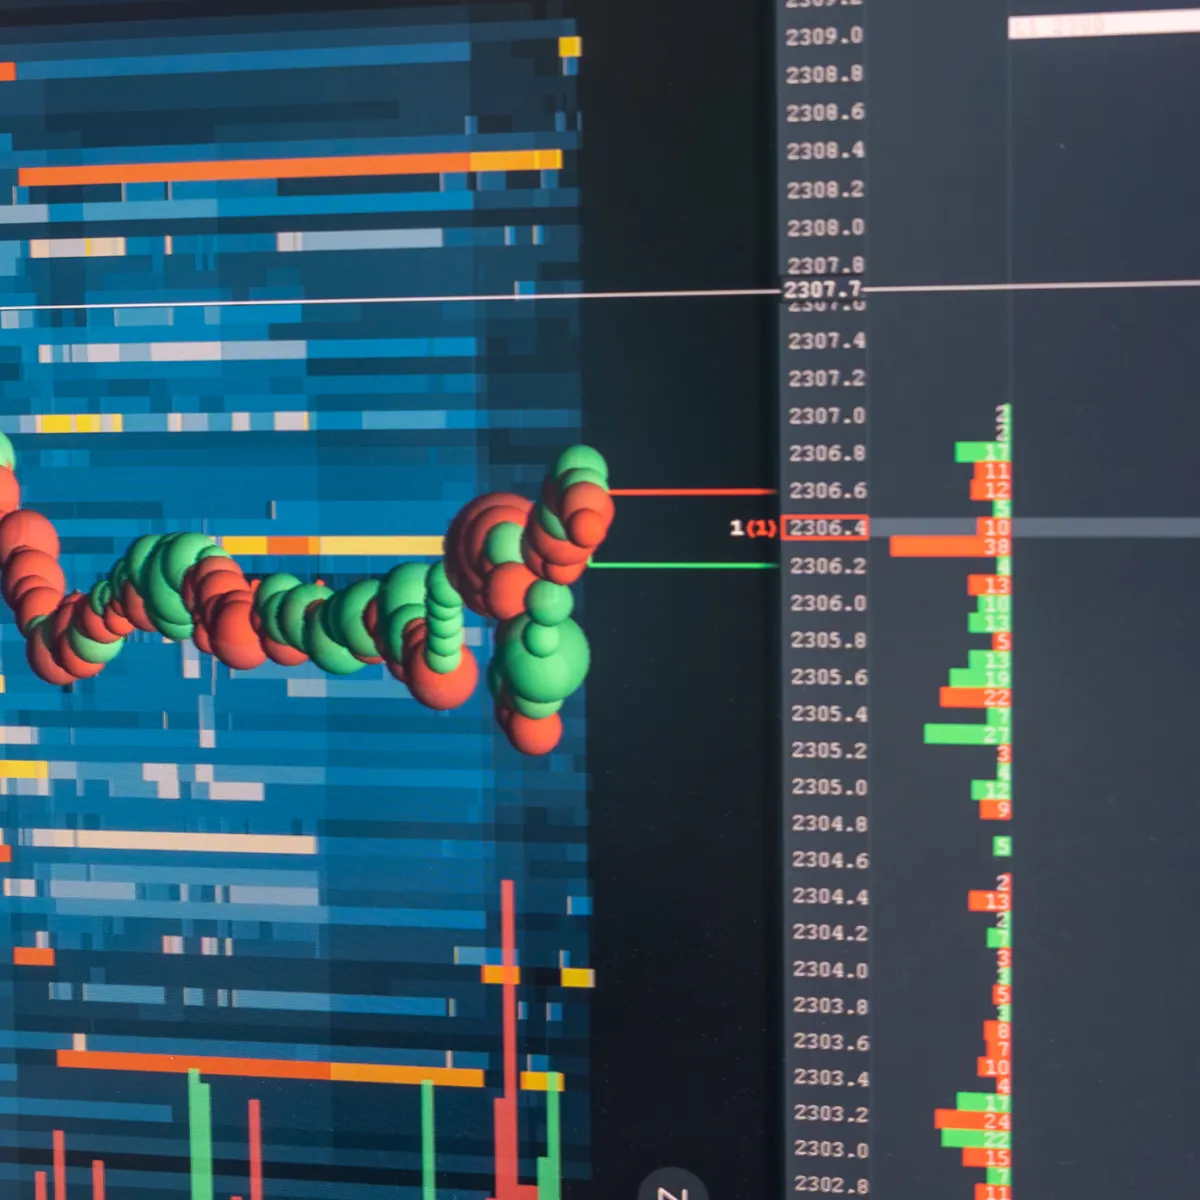
Instead of relying on external alert systems, many traders prefer continuous real-time visualization of price, liquidity, and order flow. Watching how liquidity behaves at key levels often provides earlier and more reliable signals than static alerts triggered by price alone.
By observing live changes in market depth, spread behavior, and executed volume, traders can react to developing conditions as they unfold rather than after an alert fires. This approach is especially useful in fast-moving or high-liquidity markets where conditions can change within seconds.
Broker Connectivity and Trading with Bookmap
Bookmap is not a broker, but it integrates directly with a wide range of supported brokerage partners for trading and execution. This allows traders to analyze real-time market data in Bookmap and place trades through their connected broker without switching platforms.
Through these broker integrations, traders can:
- View real-time order flow and market depth
- Execute trades directly from the Bookmap interface
- Manage positions while maintaining visibility into liquidity and order book behavior
Bookmap supports connectivity with multiple futures and equities brokers, giving traders flexibility to choose execution services that fit their trading style while keeping analysis centralized in one platform.
This broker-connected workflow is particularly valuable for active traders who rely on real-time liquidity conditions when entering, managing, or exiting trades.
Choosing the Right Real-Time Stock Trading Tool
Before selecting a tool, traders should clarify their requirements.
Ask yourself:
- Are you looking for a retail trading platform or a developer API?
- Do you need Level 2 market depth or just basic price quotes?
- Is your focus on US equities or international exchanges?
Answering these questions helps narrow down the type of real-time data and tools that make sense for your workflow.
How Bookmap Approaches Real-Time Stock Data
Rather than focusing only on price updates, Bookmap visualizes how liquidity and order flow evolve in real time. This allows traders to see not just where price is, but why it is moving.
By displaying historical and live order book behavior together, traders gain context that is difficult to extract from traditional charts alone. This approach supports both discretionary decision-making and execution-focused strategies.
Conclusion
Stock trading tools with real-time data are no longer optional for traders who care about execution quality and market awareness. As markets become faster and more competitive, understanding live liquidity, order flow, and price interaction is critical.
Whether through live equity data software, real-time share market platforms, or instant stock price monitoring tools, the goal remains the same: to make decisions based on what the market is doing now, not what it did moments ago.
Traders who understand how to evaluate and use real-time data are better positioned to manage risk, reduce costs, and navigate modern electronic markets more effectively.
Sign Up Now