See synthetic indices more clearly in real time.
Compare plans to access deeper market visibility for synthetic indices.
Education
July 18, 2024
SHARE
Synthetic Indices and Their Visualization: Trading Beyond Traditional Markets

Thanks to rapid developments and innovations in the world of financial markets, new products frequently emerge, paving new pathways of trading. Synthetic indices are one of them. They are financial instruments created using algorithms and mathematical models. They simulate the behavior of actual market indices. By using them, traders gain market independence and enjoy lower entry barriers.
Through this article, we’ll understand the popular types of synthetic indices, like volatility indices, and examine how they are used in trading strategies. Also, we will learn about the importance of visualization tools like Bookmap in understanding market dynamics and identifying trends. Lastly, we’ll understand how features such as heatmaps, volume dots, and liquidity maps can be utilized to gain insights into market activity and order flow. Let’s get started.
What are Synthetic Indices?
Synthetic indices are financial instruments. These are specifically designed to mimic the behavior of real market indices, such as:
- Stock indices or
- Commodity indices.
These instruments use algorithmic means rather than direct ownership of underlying assets. They are created using complex mathematical models and algorithms that replicate the price movements and characteristics of the targeted market indices.
One of the key advantages of synthetic indices is their market independence. Unlike traditional indices that are influenced by the performance of specific assets or sectors, synthetic indices can be constructed to be independent of any underlying market conditions.
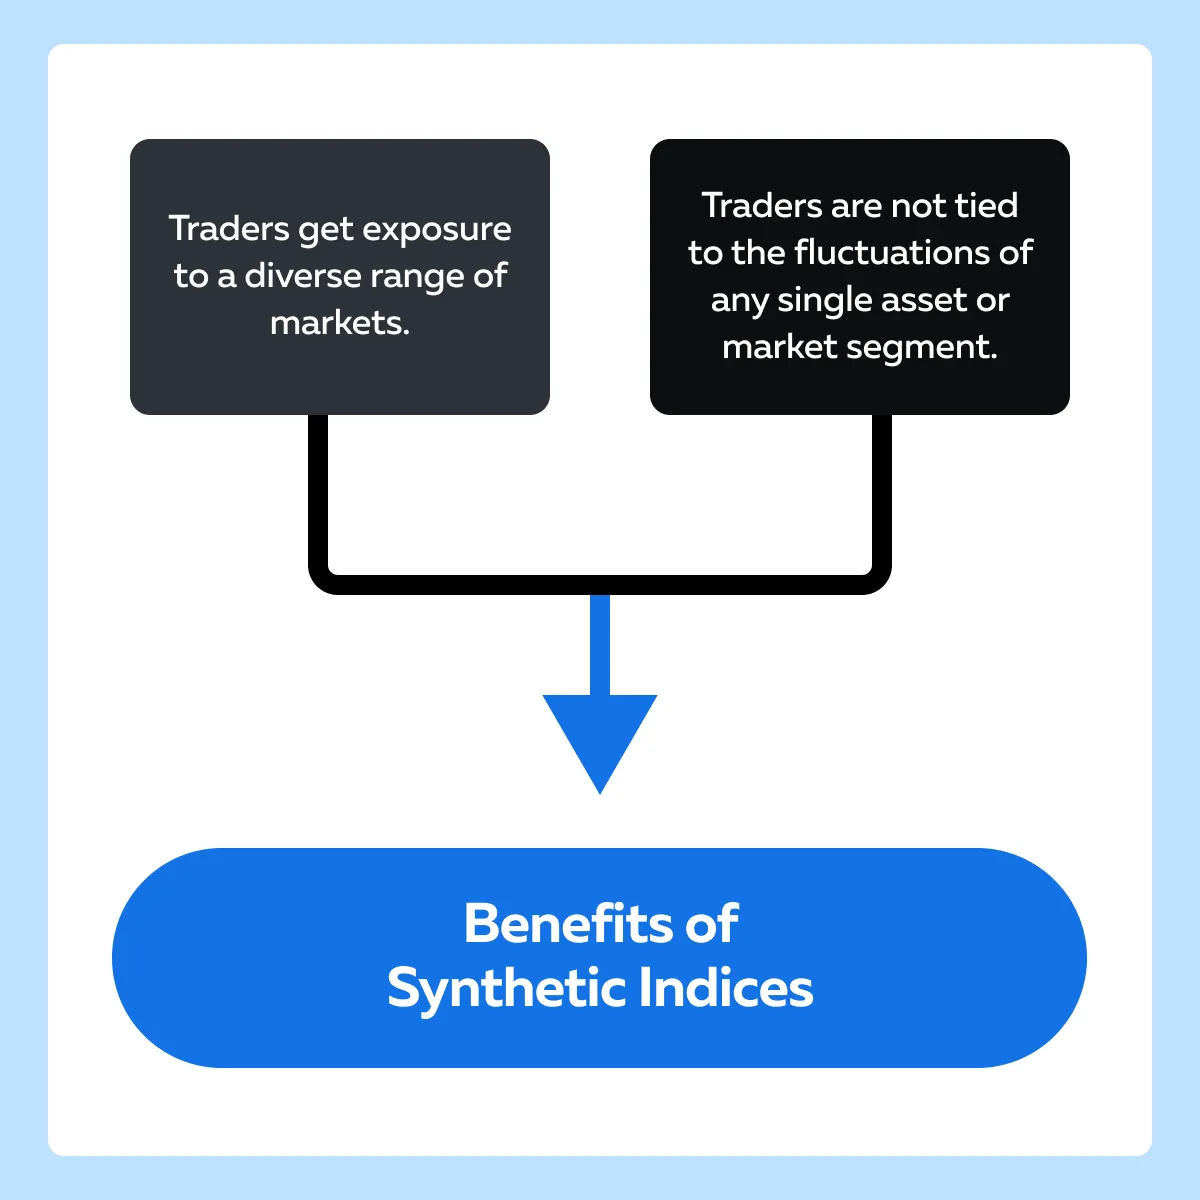
Additionally, synthetic indices often present lower entry barriers compared to direct investment in traditional indices. This is because they typically require smaller initial capital investments and can be accessed through various financial instruments such as:
- Contracts for difference (CFDs) or
- Derivatives.
Another advantage of synthetic indices is their high liquidity. They offer:
- Greater liquidity compared to traditional indices
and
- Enable traders to enter and exit positions swiftly and with ease.
Synthetic Indices Present Arbitrage Opportunities
Synthetic indices present arbitrage opportunities. They get created due to discrepancies between:
- The prices of a synthetic index
and
- The prices of the underlying assets these indices seek to replicate.
Traders can exploit these discrepancies by simultaneously buying and selling the synthetic index and its underlying assets to profit from the price differentials. For example,
- Say a synthetic index tracking technology stocks are trading at a premium compared to the combined value of its underlying assets.
- A trader bought the individual stocks in the index.
- Simultaneously, they sell short the synthetic index.
- By exploiting this price differential, the trader profits as the prices converge.
Popular Types of Synthetic Indices
“Multibook synthetic instruments” are a sophisticated type of synthetic indices. These allow traders to create custom financial instruments by combining multiple order books from different markets. These instruments are algorithmically constructed to replicate the price behavior of various assets or indices.
Traders using multibook get access to diverse markets through a single synthetic instrument. Additionally, multibook synthetic instruments offer several advantages, such as:
- Enhanced liquidity,
- Reduced market impact, and
- Increased trading opportunities.
By aggregating order books from multiple markets, these instruments provide deeper liquidity and tighter spreads compared to trading each asset individually. Additionally, traders can execute large orders more efficiently without significantly impacting the market price.
What are some popular synthetic indices?
Apart from Multibook synthetic instruments, there are several other popular types of synthetic indices as well. One such example is volatility indices. It measures the market’s expectation of future volatility based on the prices of options contracts. These indices, such as the VIX (Volatility Index) in the US market, are:
- Commonly used as indicators of market sentiment
and
- Often traded directly or through derivative products.
Some other examples of synthetic indices include:
- Sector Indices
-
-
- Synthetic indices track the performance of stocks within different sectors or industries like:
- Technology,
- Healthcare, or
- Finance.
- These indices allow traders to gain exposure to particular segments of the market
- There is no need to invest in individual stocks.
- Synthetic indices track the performance of stocks within different sectors or industries like:
-
- Currency Indices
-
-
- Synthetic indices represent the value of a basket of currencies relative to a base currency.
- For example,
- The US Dollar Index (DXY) measures the value of the US dollar against a basket of other major currencies.
- This way, it provides insights into the overall strength of the dollar.
-
- Commodity Indices
-
- Synthetic indices track the performance of commodities such as:
- Gold,
- Oil, or
- Agricultural products.
- These indices allow traders to speculate on commodity prices without directly trading physical commodities.
- Synthetic indices track the performance of commodities such as:
How These Indices Are Used in Trading Strategies?
Traders use various strategies when trading synthetic indices. Their choice usually depends on a trader’s:
- Investment goals
and
- Market outlook.
Let’s have a look at some common strategies:
- Volatility Trading
-
-
- Traders use volatility indices to speculate on changes in market volatility.
- For example,
- Say a trader goes long on volatility indices if they expect:
- Increased market turbulence or
- Short volatility indices during periods of stability.
- Say a trader goes long on volatility indices if they expect:
-
- Sector Rotation
-
-
- Traders use sector indices to implement a sector rotation strategy.
- Using it, they reallocate their investments to sectors that are expected to outperform others.
-
- Hedging
-
-
- Synthetic indices can also be used for hedging purposes.
- They can help in mitigating risks associated with specific assets or portfolios.
- For instance,
- Say a trader holds a portfolio of stocks.
- They can hedge against market downturns by taking a long position in a volatility index.
-
- Arbitrage
-
- Traders can exploit price discrepancies between:
- Synthetic indices
- Traders can exploit price discrepancies between:
and
- Their underlying assets.
- This way they can generate profits through arbitrage trading strategies.
- This strategy involves simultaneously buying and selling related instruments to capitalize on temporary price divergences.
Visualizing Market Movements with Bookmap
Effective visualization is crucial for trading synthetic indices. That’s because it provides traders with a clear understanding of:
- Market dynamics,
- Order flow, and
- Liquidity.
Synthetic indices are often complex instruments that track the behavior of multiple underlying assets or markets. Therefore, visualizing market movements in real-time becomes important. An effective analysis of this visualization can help traders identify:
- Patterns,
- Trends, and
- Potential trading opportunities.
How Bookmap Can Help You Analyze Synthetic Indices?
Bookmap is an advanced market analysis tool and a popular trading platform known for its offering modern visualization tools. Several traders use them to analyze synthetic indices and draw meaningful conclusions. Let’s see what features you can use:
| Heatmaps | Volume Dots | Liquidity Maps |
|
and
|
|
Interpreting Heatmaps for Synthetic Indices
Heatmaps are valuable tools for:
- Interpreting market activity
and
- Identifying trends in synthetic indices trading.
Let’s see how to read and interpret heatmaps specifically for trading synthetic indices:
- Color Gradients
-
-
- In a heatmap, color gradients represent different levels of market activity.
-
- Darker colors indicate higher trading volumes or order flow.
-
- Lighter colors indicate lower activity.
- For synthetic indices,
- Darker areas on the heatmap suggest significant trading activity or liquidity.
- Whereas, lighter areas indicate quieter market conditions.
- Identifying High-Interest Areas
-
- Traders should focus on identifying high-interest areas on the heatmap where large volumes of trades have occurred.
- These areas highlight significant support or resistance levels in synthetic indices trading
- High-interest zones signal:
- Crucial pivot points where the market might turn and
- Potential areas of price congestion or breakout.
- By closely monitoring these high-interest areas on the heatmap, traders can:
- Anticipate potential price movements
and
- Tailor their trading strategies accordingly.
- Analyzing Price Patterns
- In synthetic indices trading, heatmaps help traders to:
- Analyze price patterns
and
- Identify trends.
- By observing how trading activity is distributed across different price levels, traders can identify recurring patterns such as:
- Price consolidations,
- Breakouts, or
- Reversals.
- For example
- Say you observed clusters of dark colors near support or resistance levels.
- You interpret them as strong buying or selling pressure.
How to Analyze Changes Over Time in Heatmaps to Spot Trends?
To effectively spot trends using heatmaps in synthetic indices trading, it’s essential to observe changes in market activity over time. Let’s see how you can do it:
| Tips | Explanation |
| Observe Gradual Shifts |
or
|
| Spotting Significant Events |
and
|
| Interpreting Trend Reversals |
|
Let’s understand better through a hypothetical example
The scenario
- Assume a synthetic index that tracks a composite of various technology stocks.
- During a product launch event by a major tech company, the heatmap shows a sudden shift in color from light blue to deep red around the price level of $150.
- This shift indicates a surge in buy orders.
The interpretation
- Traders interpret this shift as a “strong buyer response” to the product launch.
- The surge in buy orders suggests that the market views the product launch favorably.
- This establishes a bullish sentiment among investors.
The action
- Based on this interpretation, traders enter long positions.
- They expect further price increases in the synthetic index.
- They set entry points just above the $150 level to capitalize on potential upward momentum.
- Additionally, traders also place stop-loss orders below recent low-volume areas shown on the heatmap.
- This way they protect their positions against sudden reversals.
Analyzing Volume and Liquidity
Identifying volume clusters and understanding liquidity maps help traders in:
- Analyzing market trends
and
- Identifying potential reversal points.
Let’s understand in detail.
How do identifying volume clusters help pinpoint market trends and potential reversal points?
Volume clusters refer to concentrations of trading volume at certain price levels over a specified time. These clusters indicate areas of market interest where significant buying or selling has occurred. They often act as psychological barriers or supports in synthetic indices trading.
Traders use volume clusters to gauge the strength of a price level. For example,
- Say there exists a strong volume cluster at a lower price point.
- This existence indicates:
- A solid support zone
and
- A possibility that the market could bounce back if it reaches this level again.
- Conversely, a dense volume cluster at a higher price level acts as a resistance zone
- It indicates potential selling pressure.
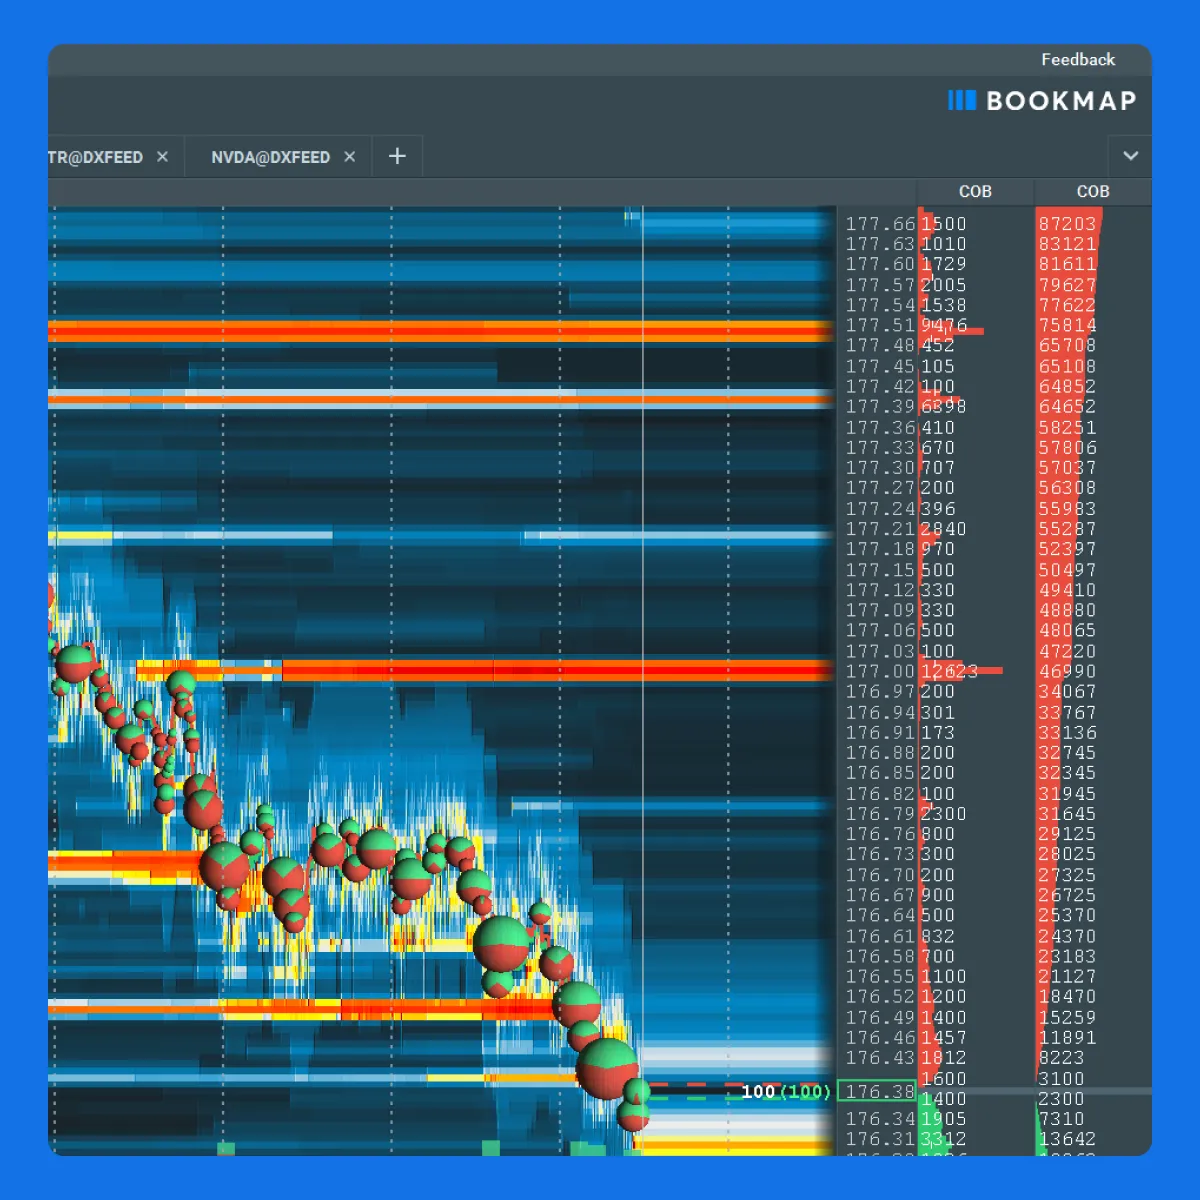
How do liquidity maps provide insights into market depth and order flow?
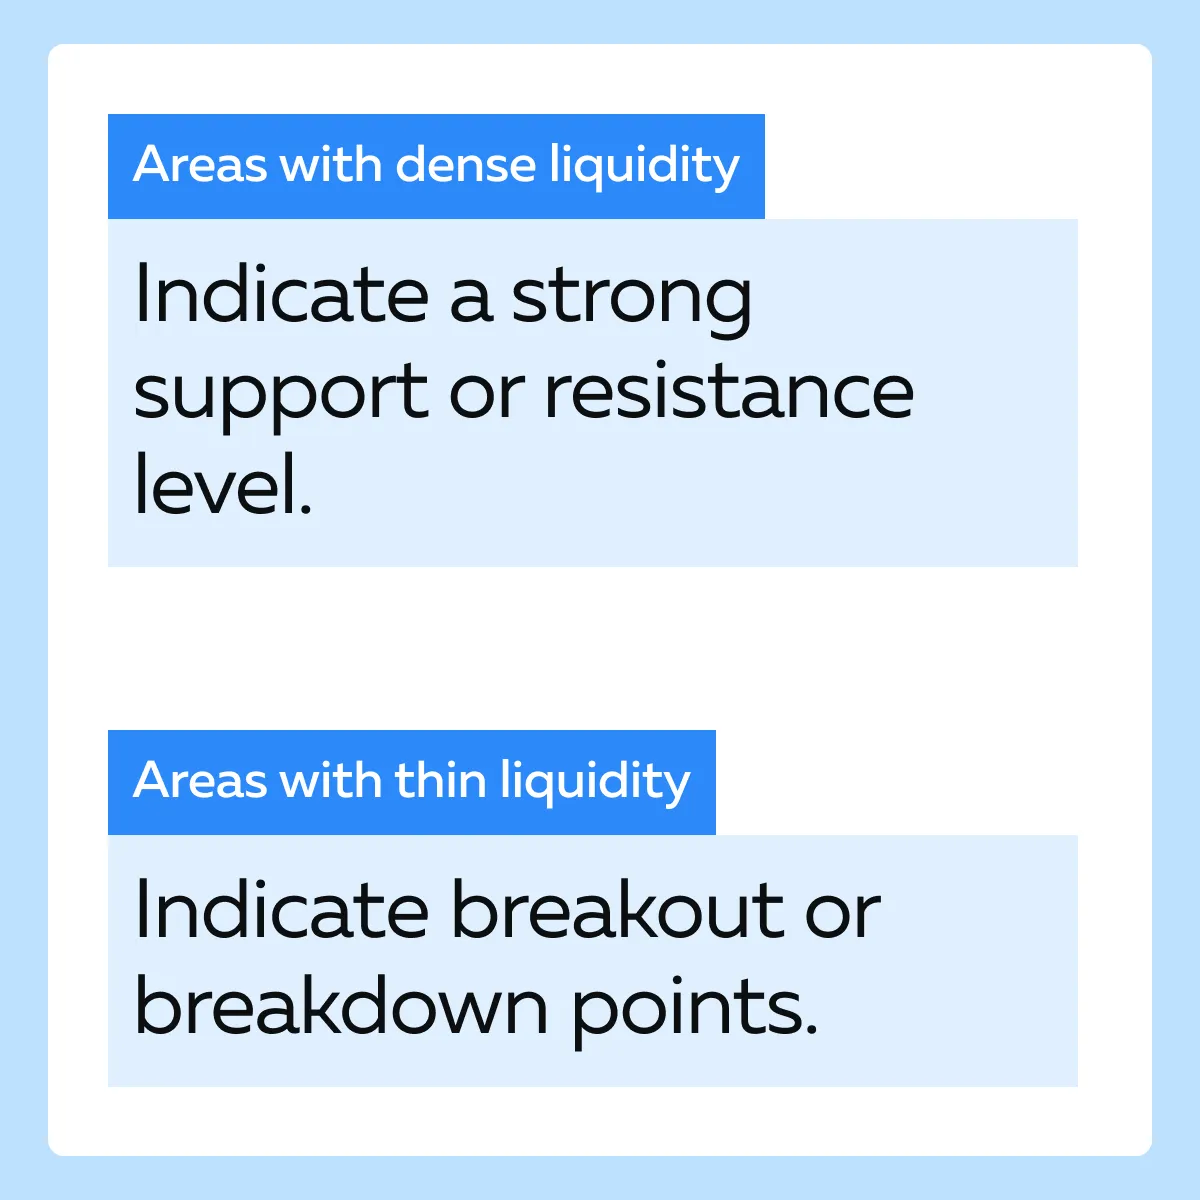
Liquidity maps visualize the live depth of market data. They show where buy and sell orders are concentrated at different price levels. Traders can interpret liquidity maps by identifying gaps in liquidity. These gaps often indicate potential price jumps. For example,
- Say a synthetic index shows thin liquidity at higher price levels.
- However, it also shows dense liquidity below current prices.
- This situation suggests a lack of selling pressure.
- There could be upward moves.
Additionally, liquidity maps help traders understand where the market might move next. This prediction is based on where the liquidity is pooled.
Strategic Approaches to Trading Synthetic Indices
There could be multiple approaches to trading synthetic indices including both long-term and short-term. Let’s study them in detail:
Short-term Trading Strategies
| Scalping | Day Trading |
|
and
|
Why Longer-Term Approaches Are More Beneficial?
Longer-term traders often use trend-following strategies to capitalize on sustained price movements in synthetic indices. They can identify and follow established trends by analyzing:
- Historical price data
and
- Trend indicators.
Trend-following strategies require patience and discipline but can yield significant profits if executed effectively. Furthermore, synthetic indices offer opportunities for portfolio diversification. They allow investors to spread their risk across different asset classes and markets.
By incorporating synthetic indices into their investment portfolios, investors can:
- Reduce exposure to specific market risks
and
- Enhance overall portfolio resilience.
Again, long-term investors can benefit from the stability and growth potential of synthetic indices as part of a diversified investment strategy.
Conclusion
Trading synthetic indices offers various benefits and strategic opportunities. By visualizing market data through advanced tools like Bookmap, traders gain valuable insights into market dynamics, order flow, and liquidity. Thanks to modern features like heatmaps, volume dots, and liquidity maps, traders can identify trends, pinpoint key support and resistance levels, and make informed trading decisions in real-time.
Also, experimenting with Bookmap’s features allows traders to fully leverage the potential of synthetic indices in their trading activities, whether they prefer short-term strategies like scalping and day trading or longer-term approaches like trend following and portfolio diversification.
Do you wish to explore further and fully leverage the potential of synthetic indices in your trading? If yes, ensure to check out Bookmap’s Multibook Synthetic Instruments.
Sign Up Now