See market activity more clearly in real time.
Compare plans to access deeper market visibility for market activity.
Futures
March 6, 2024
Updated
SHARE
Trading the ES: Insights From the Bookmap Community
The ES (S&P 500) is one of the most popularly traded and highly liquid stock indexes in the world, home to some of the powerhouse companies such as Apple, Microsoft, and Amazon.
That is one of the reasons the S&P 500 is often referenced as a proxy for the state of the US economy overall.
Let’s have a look at some of the ways the Bookmap community traders this incredibly important stock index future.
A Brief Intro to Insights
Insights is a page of curated trading content produced by our diverse community across social media.
On the page, you can search for content by certain tags such as asset class (Futures, Stocks, Crypto), instrument (e.g. ES or BTCUSD), indicator (e.g. Stops & Icebergs), order flow phenomena (e.g. Aggressive Sellers), etc.
Setup #1: Absorption
What is Absorption?
The Absorption Indicator is a tool that traders can use to identify areas of the market where a significant amount of trading volume has taken place over short periods of time.
This happens when buyers or sellers aggressively engage in trading (usually with market orders) at key liquidity levels, which are passive limit orders. If the aggressors are unable to fully consume the passive orders, this can result in absorption. In simple terms, when there are large resting sell limit orders (which could also be Iceberg orders), they can sometimes absorb large buying aggressors, and when there are large buy limit orders, they can sometimes absorb large selling aggressors.
The Absorption Indicator isn’t necessary to identify absorption, as this can sometimes be assumed with only the Bookmap heatmap.
Absorption & Market Profile
Looking for absorption of aggressors within the context of Market Profile can add confluence to trading setups.
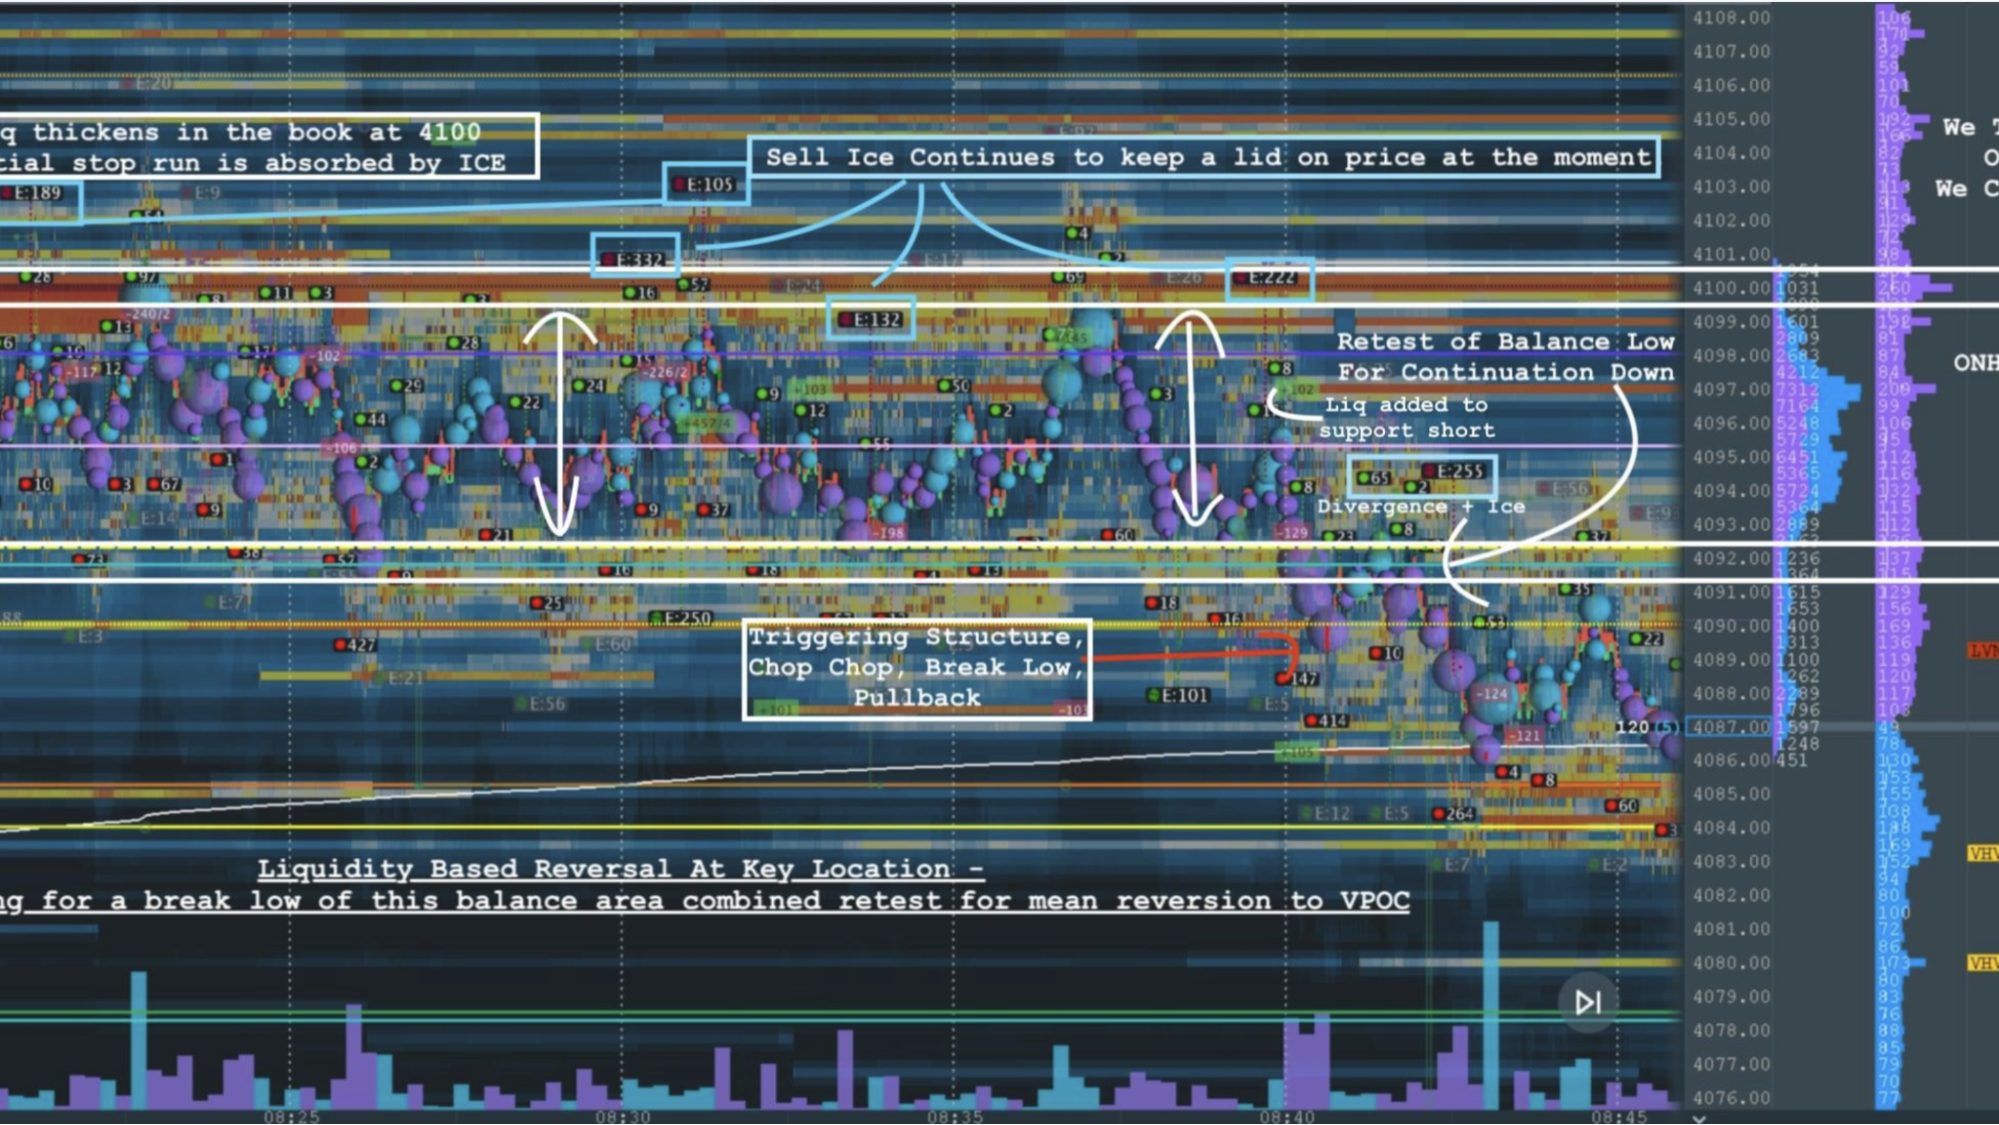
Image 1: A break lower of the balance area, combined with a retest is slowdown’s confirmation for “mean reversion to (the) VPOC”.
In the above screenshot, we see how trader ‘slowdown’ notices the thickening of the offers at 4100 in the order book, as well as the triggering Iceberg orders also keeping “a lid on price”.
When price comes down to test the “Balance Low” and sell liquidity is added lower, this is potentially increasing the probability of a successful short trade.
Absorption & Market Pulse
Previous Blue Jacket winner ‘jec’ shares a trade he took on CPI day, Tuesday the 14th of February, 2023. Along with absorption, he also utilized the Market Pulse add-on.
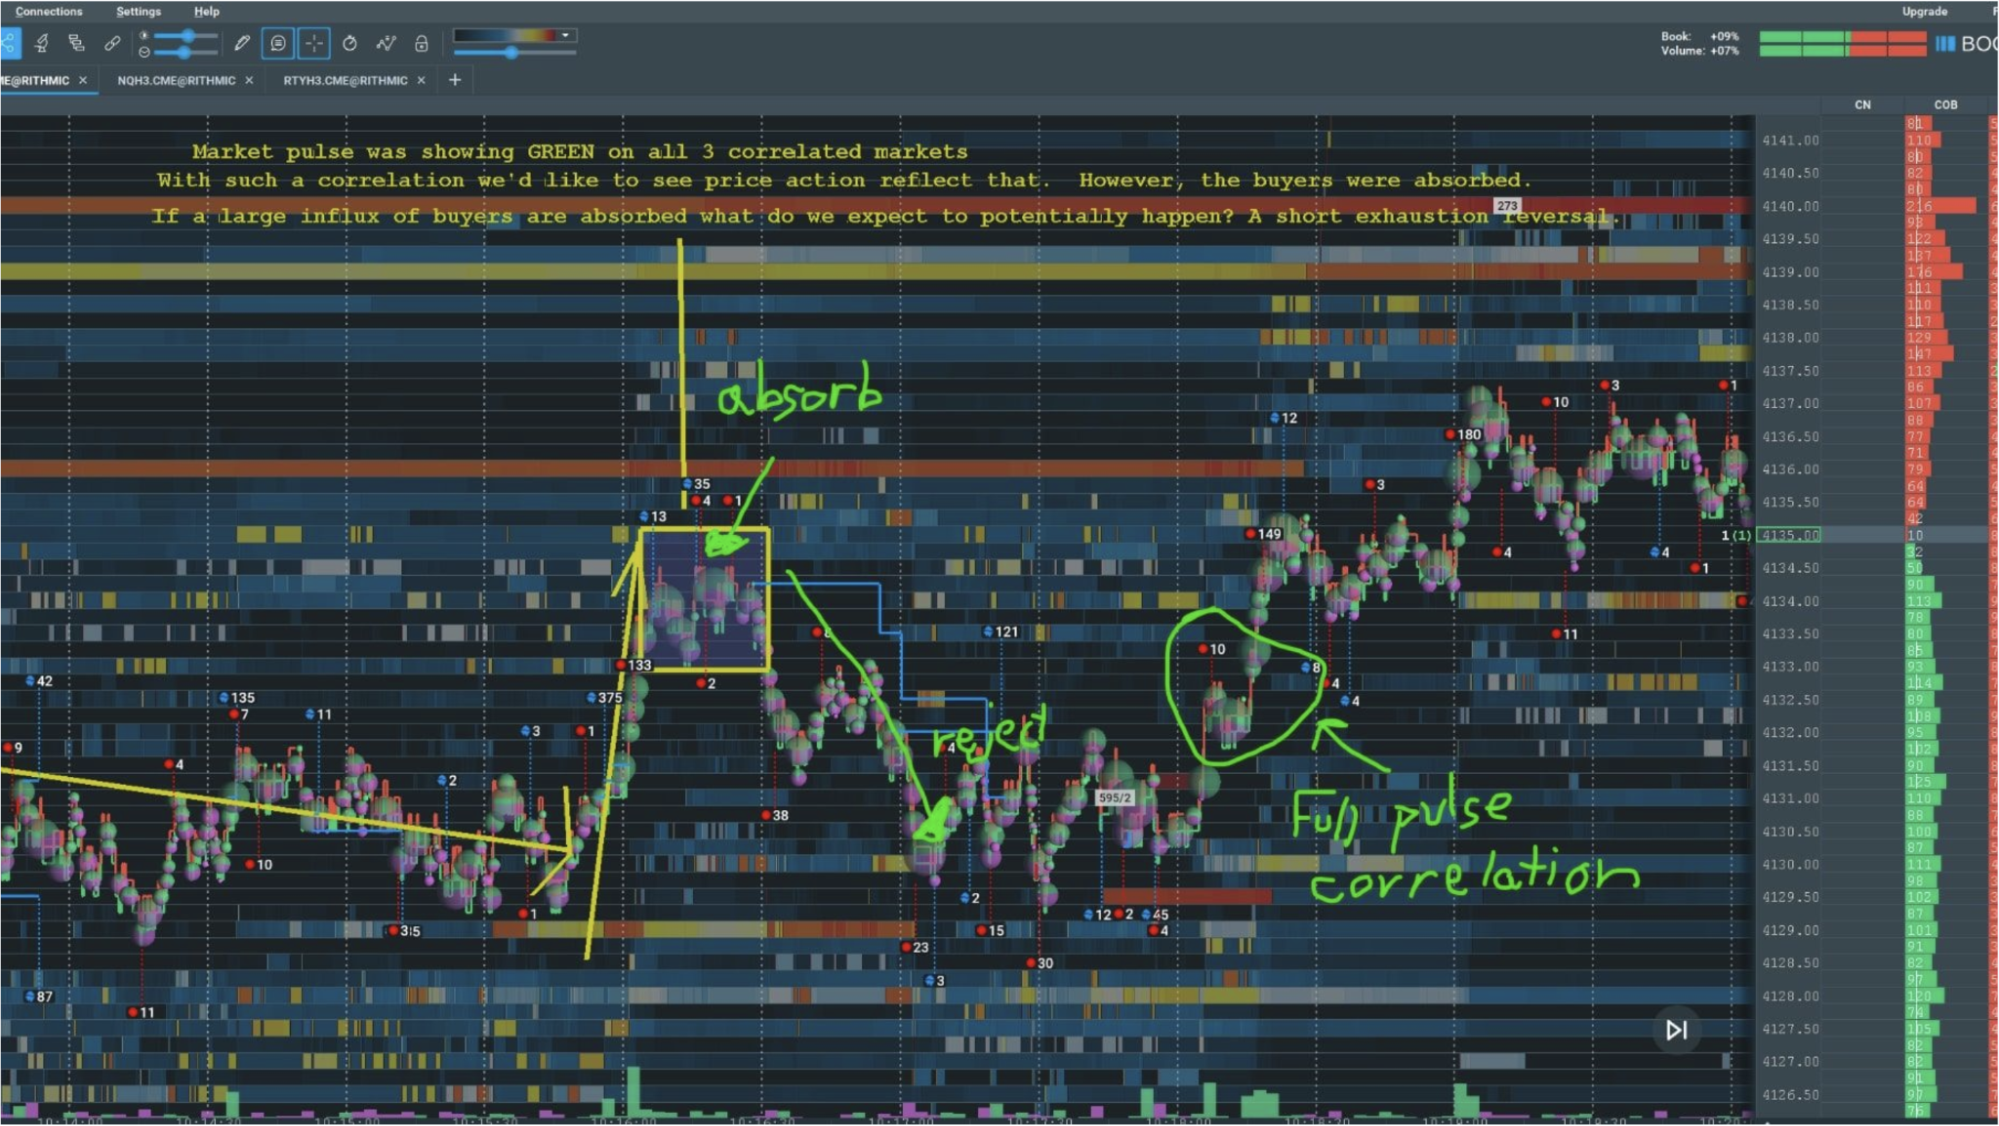
Image 2: jec shares a trade that was, according to him, “NOT the standard momentum play”.
With Market Pulse showing GREEN on “all 3 correlated markets” (ES, NQ, RTY), jec was looking for price action to reflect that.
However, when the buyers were absorbed, he expected a potential “short exhaustion reversal” before leading to a “full pulse correlation” and a continuation higher.
Setup #2: Stops
What are Stops?
As written in our Complete Guide to Stops, a stop order “allows for a security to be bought or sold when its price moves past a particular point”.
Stops can be used to exit trades as either protective stops to limit losses, or to take profit on gains (such as with trailing stops). The positioning of stops can make a huge difference to the results of your trading strategy. A cluster of stops, for instance, can lead to a “stop run”. Read our Complete Guide to Stops for more information about how this comes about.
Identifying where stops are located can also be a source of alpha. Bookmap’s Stops & Icebergs On-Chart and Sub-Chart add-ons can show you where, when, and how many contracts were triggered as stop orders. These areas can be vital points in the trajectory of price action.
Stops & Double Tops/Bottoms
Bookmap Academy trader ‘dov’ is fond of trading classic chart patterns such as Double Tops and Double Bottoms that appear on the heatmap, especially when they are at areas of confluence such as triggered stops.
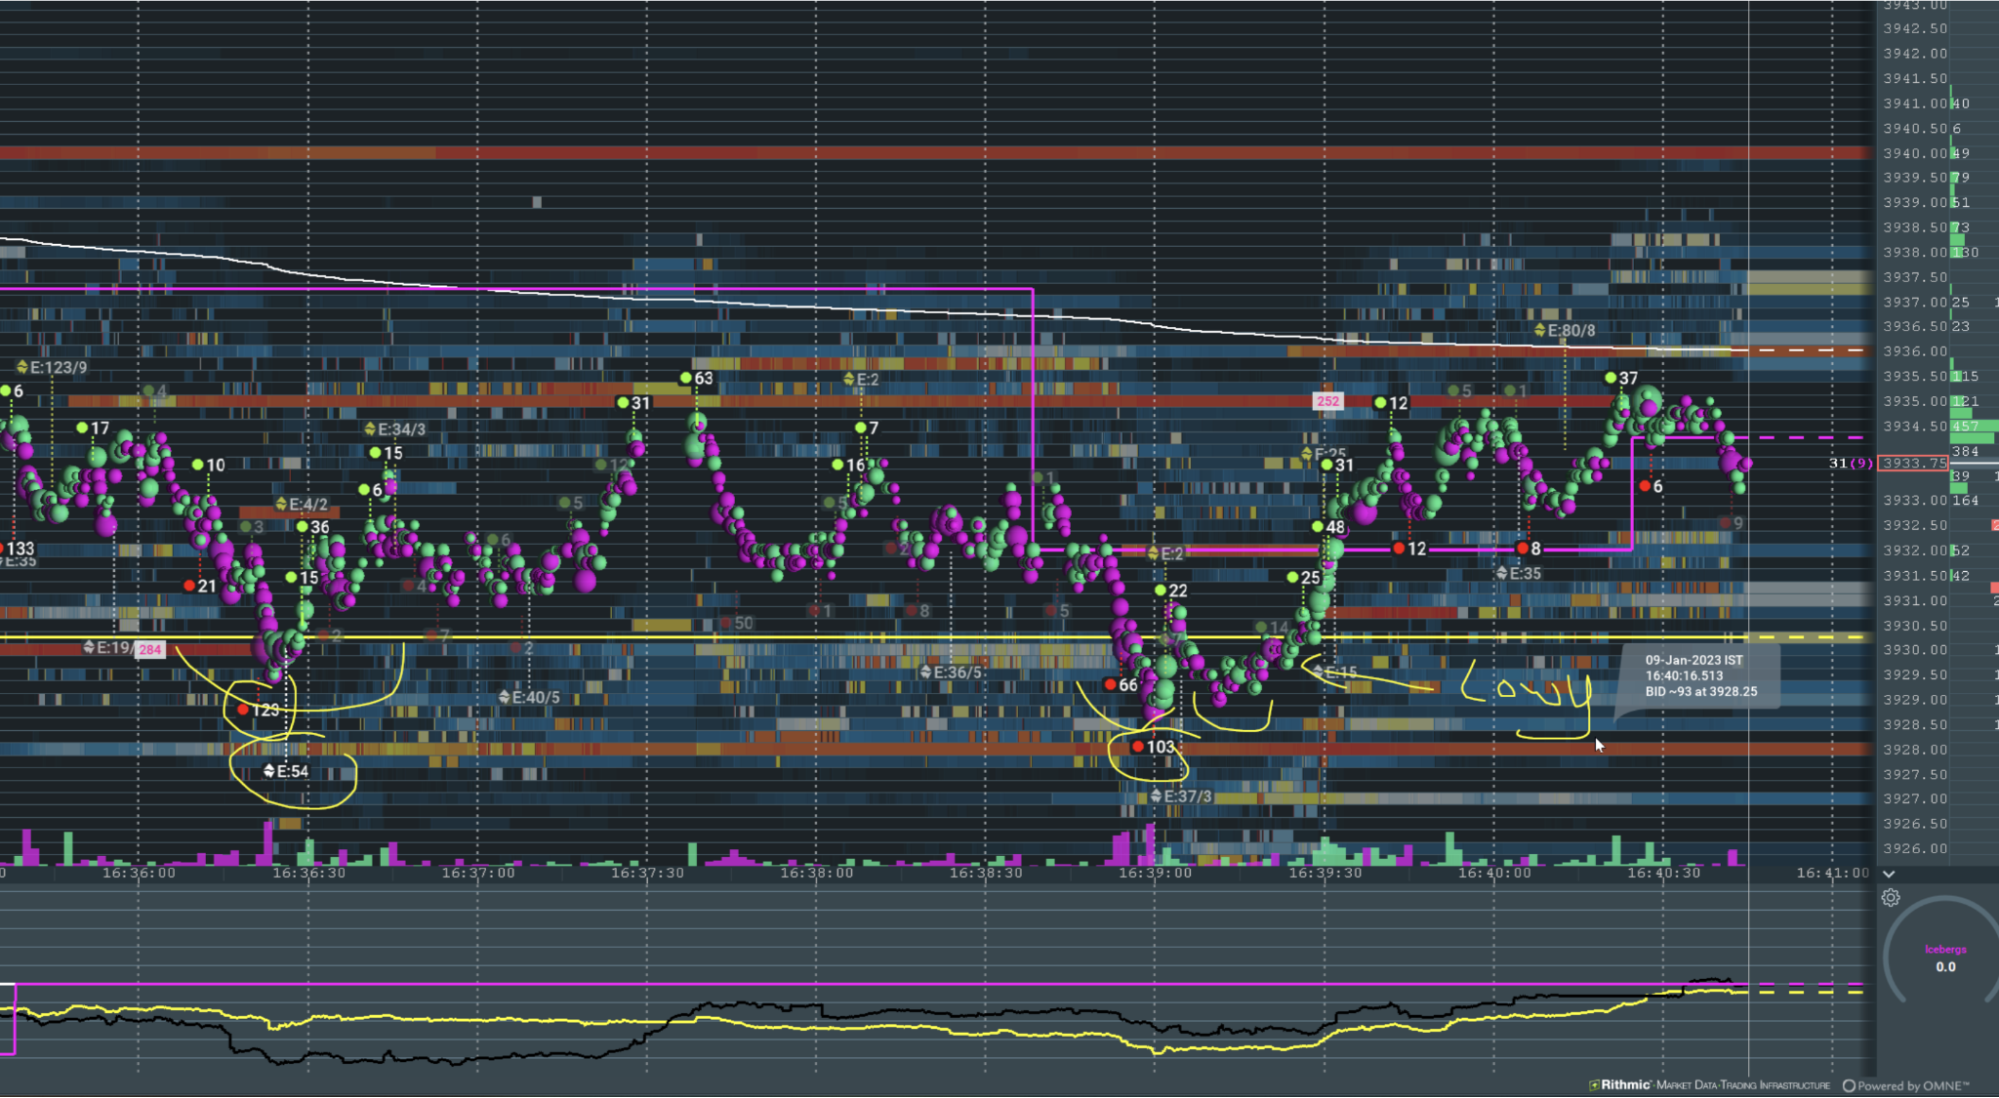
Image 3: A double bottom with stops triggered leads to a long signal.
In the above example from the beginning of 2023, dov goes long after a second stop run fails to successfully knock prices lower than the previous area where stops were also triggered.
Stops & VWAP
The VWAP (Volume-Weighted Average Price), a measurement that shows the average price over time adjusted for volume, can be calculated in various fashions. Regardless of exactly when choosing to reset the calculation (most choose to reset at the beginning of a trading session or market opening), the VWAP can be a great addition of confluence to other signals.
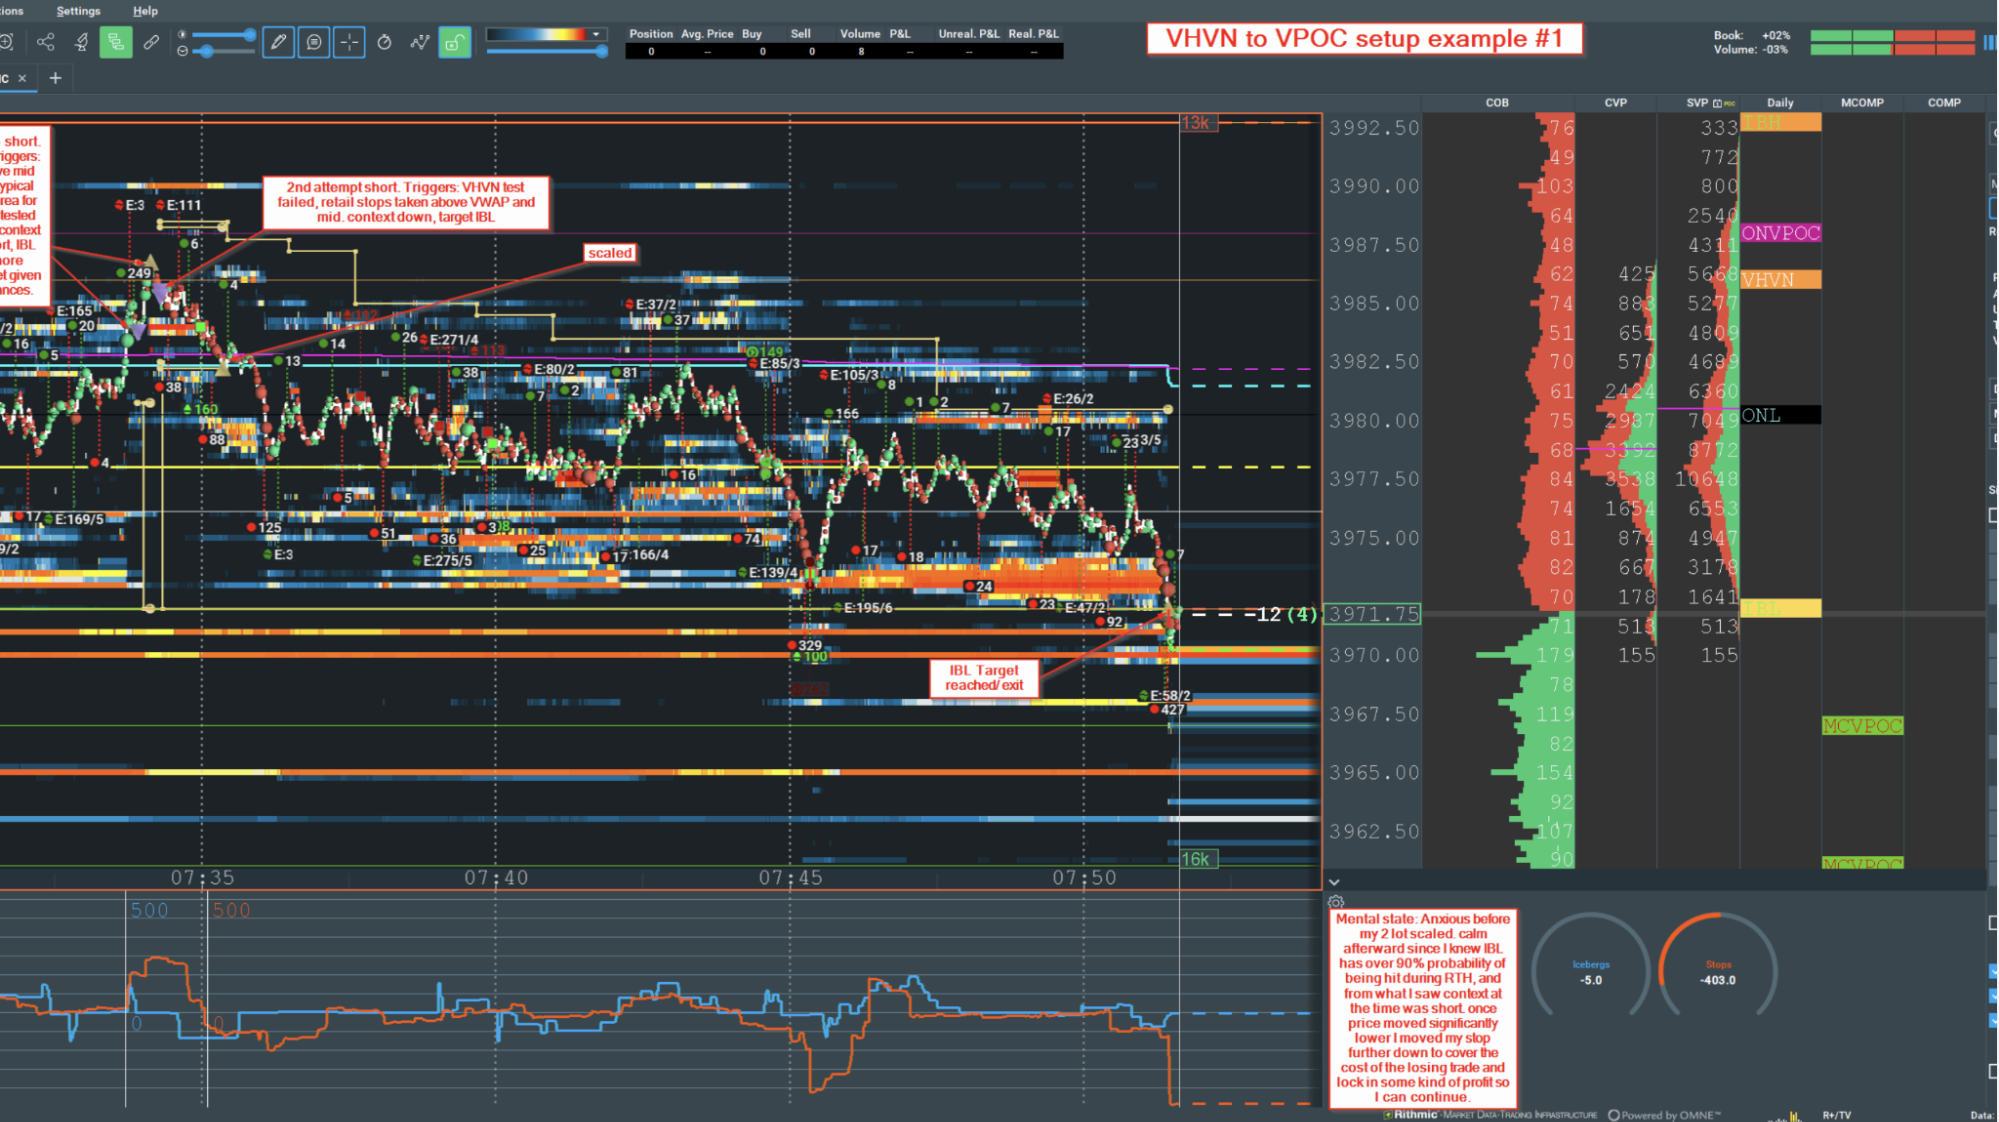
Image 4: Another Blue Jacket winner, Rob Davies, shows a short trade he took after “retail stops” were “taken above VWAP” and “mid”.
For the take-profit exit, he targets the Initial Balance Low, the lowest price established within the first hour of the trading session.
Conclusion
To utilize all of the add-ons mentioned in this article, you will need Global or Global+ with the MBO bundle. Click here to see a package comparison.
If you want to trade as well as the traders in this article and potentially be featured in a future article, choose to see the whole picture today.
Risk Disclaimer: Trading Equities and Futures involves substantial risk of loss and is not suitable for all investors. Past performance is not indicative of future results.
Sign Up Now